We’ve past yet another hurdle of concern for markets this past week. Last Friday this time, we had a potential catastrophic category 5 hurricane projected to decimate Florida.
Though there was plenty of destruction in Irma’s path, the weakening of the storm through the weekend ended in a positive surprise relative what could have been.
So we end with stocks on highs. And remember, we’ve talked over past month about the quiet move in copper (and other base metals) as a signal that the global economy (and especially China) might be stronger than people think. Reuters has a piece today where they overlay a chart of economist Ed Yardeni’s “boom-bust barometer” over the S&P 500. It looks like the same chart.
What does that mean? The boom-bust barometer measures the strength of industrial commodities relative to jobless claims. Higher commodities prices and lower unemployment claims equals a rising index as you might suspect (i.e. suggesting economic boom conditions, not bust). And that represents the solid fundamental back drop that is supporting stocks.
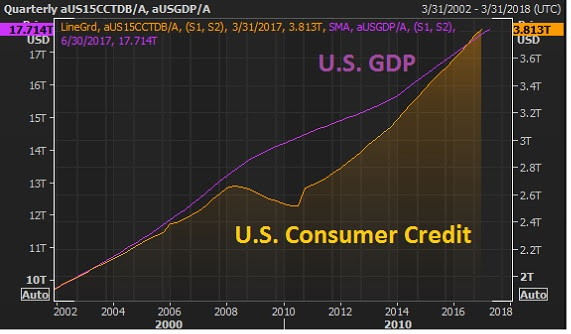
With that in mind, consider this: In the recent earnings quarter, earnings and revenue growth came in as good as we’ve seen in a long time for S&P 500 companies. We have 4.4% unemployment. The rise in equities and real estate have driven household net worth to $94 trillion – new record highs and well passed the pre-crisis peaks (chart below).
Now, people love to worry about debt levels. It’s always an eye-catching headline.
But what happens to be the key long-term driver of economic growth over time? Credit creation (debt). The good news: The appetite for borrowing is back. And you can see how closely GDP (the purple line, economic output) tracks credit growth.
Meanwhile, and importantly, consumers have never been so credit worthy. FICO scores in the U.S. have reached all-time highs. So despite what the media and some of Wall Street are telling us, things look pretty darn good. Low interests have produced recovery, without a ramp up in inflation.
But as I’ve said, it has proven to have its limits. We need fiscal stimulus to get us over the hump – on track for a sustainable recovery. And we now have, over the past two weeks, improving prospects that we will see fiscal stimulus materialize — i.e. policy execution in Washington.
To sum up: People continue to look for what could bust the economy from here, and are missing out on what looks like the early stages of a boom.
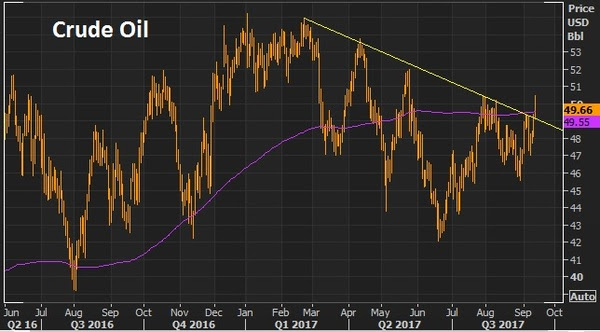
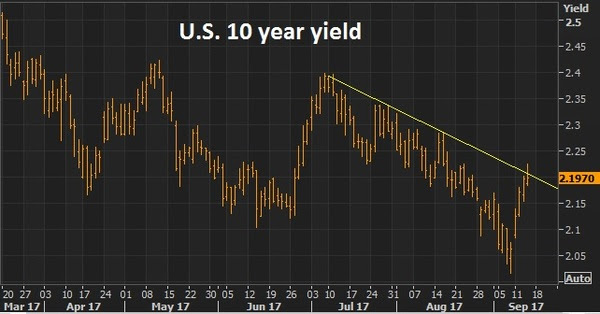
Yesterday we looked at the charts on oil and the U.S. 10 year yield. Both were looking poised to breakout of a technical downtrend. And both did so today.
Here’s an updated look at oil today.
And here’s a look at yields.
We talked yesterday about the improving prospects that we will get some policy execution on the Trumponomics front (i.e. fiscal stimulus), which would lift the economy and start driving some wage pressure and ultimately inflation (something unlimited global QE has been unable to do).
No surprise, the two most disconnected markets in recent months (oil and interest rates) have been the early movers in recent days, making up ground on the divergence that has developed with other asset classes.
Now, oil will be the big one to watch. Yields have a lot to do, right now, with where oil goes.
Though the central banks like to say they look at inflation excluding food and energy, they’re behavior doesn’t support it. Oil does indeed play a big role in the inflation outlook – because it plays a huge role in financial stability, the credit markets and the health of the banking system. Remember, in the oil price bust last year the Fed had to reverse course on its tightening plan and other major central banks coordinated to come to the rescue with easing measures to fend off the threat of cheap oil (which was quickly creating risk of another financial crisis as an entire shale industry was lining up for defaults, as were oil producing countries with heavy oil dependencies).
So, if oil can sustain above the $50 level, watch for the inflation chatter to begin picking up. And the rate hike chatter to begin picking up (not just with the Fed, but with the BOE and ECB). Higher oil prices will only increase this divergence in the chart below, making the interest rate market a strong candidate for a big move.
Join our Billionaire’s Portfolio today to get your portfolio in line with the most influential investors in the world, and hear more of my actionable political, economic and market analysis. Click here to learn more.
Over the past two trading days, we’re seeing the “risk-off” flow of global capital that we saw through the early stages of the global financial crisis.
For a long time, Wall Street sold us on the idea of sector and geographic diversification for stocks. That abruptly ended in 2008-2009. It was clear that in a global crisis, the correlations of sectors, geographies and many asset classes went to 1 (i.e. almost everything went down–a few things went up).
Our table below gives some perspective on how the swings in global risk appetite have affected financial markets since the onset of the financial crisis in 2008.
In a sense, the risk trade is an easy one to understand. When the world looks like a scary place, people pull back and look for protection. They pull money out of virtually everything, including banks, and plow money into the U.S. dollar, U.S. Treasurys and gold (the safest parking place for money in the world, on a relative basis).
At the depths of the global financial and economic crisis, there was a clear shift in investor focus, away from “return ON capital” toward one of “return OF capital.” Then, as sentiment improved about the outlook, people started taking on more risk, and that capital flow reversed. But with each economic threat that has bubbled up since, we’ve seen this risk-off dynamic quickly emerge again.
Two trading days following the Brexit vote, the market behavior is clearly back in the risk-off phase. The question is: Are we back into the risk-on/risk-off seesaw in markets that we dealt with for several years coming out of the worst part of the crisis?
As we said, there are huge differences between now and 2008. When Lehman failed, global credit froze. Today financial conditions globally have tightened a bit, but nothing remotely near the post-Lehman fallout. Most importantly, as we’ve said, we had no idea how policy makers might respond and how far they might go. Now we know, they will “do whatever it takes.”
When was the last time we had a huge sentiment shock for global financial markets and for the global economy? It was only a year ago, in Greece. The Greek people voted NO against more austerity and more loss of sovereignty to their European neighbors (namely Germany). That vote too, shocked the world. But all of the draconian outcomes for Greece, which were being threatened, with such a vote, didn’t transpire. Greece and Europe compromised.
Bottom line (and something to keep in mind): A bad outcome for anyone, at this stage in the global economic recovery, is a bad outcome for everyone.
To follow our big picture views and our hand selected portfolio of the best stocks owned by the best billionaire investors in the world, join us in our Billionaire’s Portfolio.
The world was stirring today over the UK decision to leave the European Union. Here are a few things to keep in mind. As we discussed earlier in the week, the repercussions of the Brexit are very different than those that were feared over the potential “Grexit.” Greece was threatening to leave the euro. It would have had major and immediate financial complications, which could have quickly paralyzed the financial system.
The Brexit is more political than economic (not financial). And any retrenchment in the banking system because of uncertainty can be immediately quelled by central bank intervention. Not only were the central banks out in front of the potential exit outcome, promising to provide liquidity to the banking system, but they were also in last night stabilizing currencies, and likely bond yields as well.
As we said, there are also huge differences between now and 2008. When Lehman failed and global credit froze, we had no idea how policy makers might respond and how far they might go. Now we know, they will “do whatever it takes.”
The market volatility surrounding the Brexit may actually be a positive for the global economy. Seven years into the global economic recovery, global central banks have thrown the kitchen sink at the crisis, and they’ve proven to be able to stabilize the financial system and the global economy, and restore confidence. And that has all indirectly created an economic recovery, albeit a slow and sluggish one. But they haven’t been able to directly stimulate meaningful economic growth (the kind you typically see coming out of recession) because of the nature of the crisis.
Fiscal stimulus has been the missing piece of the puzzle.
Governments have been reluctant to spend, given the scars of the debt crisis. This may give policy makers an excuse to green light fiscal stimulus. After all, growth (or the lack thereof) is the primary driver of the public discontent – not just in the UK, but globally. Growth has a way of solving a lot of problems.
To follow our big picture views and our hand selected portfolio of the best stocks owned by the best billionaire investors in the world, join us in our Billionaire’s Portfolio.
After a shaky few days for markets, we head into the weekend with some relative calm today. Next week the UK vote on leaving or staying in the European Union will dominate the market focus.
The pressure in markets had been building in recent days on the pick-up in momentum for the Brexit vote in the UK. A log on the fire for that pressure was the inaction from the four central banks that met this week (Fed, BOJ, SNB and BOE). Yields in German 10-years slid below zero. U.S. yields (10 years) hit four year lows. Stocks were sliding, globally. The upward momentum for gold started to kick in. And then we had the tragic murder of a member of British Parliament (widely considered to be politically driven, as she was a ‘stay’ advocate).
So leveraged positions across markets that were leaning in the direction of the momentum unwound, to an extent, on the news.
Today we want to step back and take a look at some key charts as we head into next week.
First, the odds of a Brexit from the bookmakers…
As we’ve said, along the way, despite the coin flip projections coming out of the many polls in the UK, this estimation has been clearly favoring the ‘stay’ camp by about 70/30. Though in recent days the probability of an exit had risen to 44%. Following the tragic news yesterday, that number is now back to 36%.
Next is a chart of gold. This is the safe haven trade, though it hasn’t much allure in quite some time. Still, gold found some legs in the past 10 days.
But as you can see in the chart above, after a $35 higher yesterday, it reversed sharply to close on the lows. In the process it put in a very nice technical reversal pattern (an outside day – where the day’s range engulfs the prior day’s range, caused by low conviction ‘longs’ reversing course near the highs and hitting the exit doors, exacerbating the slide into the close). That price action would argue for lower gold, and in general, the end of this recent flurry of doubt surrounding the UK vote (and uptick in broad market volatility).
As we know, the sustainability of the crude oil recovery is a huge factor in global financial market stability. After trading above $50, it had six consecutive days of lower lows, but it bounced back aggressively today, also posting a key reversal signal (bullish outside day – again, good for the global stability outlook).
Finally, a look at the chart of the S&P 500 …
Despite all of the negative messaging across the media and uncertainty from the investment community, as we head into the weekend stocks sit just 3% off of the all-time highs.
To follow our big picture views and our hand selected portfolio of the best stocks owned by the best billionaire investors in the world, join us in our Billionaire’s Portfolio.
German yields (10 year futures) went negative today, but importantly didn’t close negative. We’ve talked about the important symbolism of this market. This is a big deal, especially the recovery into the close, finishing spot on the zero line heading into tomorrow’s Fed and tomorrow nights BOJ meeting.
The Fed decision is tomorrow afternoon. Remember Fed members went on a public campaign to build expectations for a June hike — a second hike in their nascent rate hiking cycle. Of course, it’s not a normal hiking cycle, but just the slow removal of emergency level policies that were in place to avert a global economic disaster and fuel a recover, albeit a very slow and weak one.
But now, as the vote in the UK on whether or not to leave the European Union has become increasingly questionable over recent weeks, the expectations of a Fed hike tomorrow have evaporated. With that, the weak job creation number at start the month came as a gift to the Fed. It gave them a credible reason to back off of their stance, even though the threat to global economic stability (the chance of a UK/Brexit shakeup) is front of the mind for them.
Remember, last September, the Fed had set the table for a first hike. They told us they would, and they balked. The culprit then was the currency devaluation from China which shook up global markets and sent stocks falling. The Fed didn’t hike. And that added even more fuel to the market shakeup. It warranted the question: Does the Fed have that little confidence in the robustness of the economic recovery?
So this time around, changing course again on the Brexit risk would have made them look weak and uncertain (as they did back in September). But influenced by the changing data (the weak jobs number) — the market this time has given them a pass.
If they were to surprise and hike at this point, it would likely be equally as harmful as it was back in September when they chose not to hike.
What’s the point? The Fed has made it clear all along that they need stocks higher. It’s a huge component in restoring wealth, jobs and broader confidence and stability. Anything that can derail that is very dangerous to the recovery, and the Fed knows it very well. So do central bankers in Europe and Japan.
With that said, as has been the case the past three Fed events this year, the main event for monetary policy isn’t in Washington, the main event this week is in Japan.
The BOJ has given us plenty of clues that more action is coming:
1) Even after three years of Japan’s unprecedented policy attack on deflation and a stagnating economy, the head of the BOJ has said numerous times that they remain “only half way there” on meeting their objectives.
2) As we’ve said, two key components of Japan’s stimulus program are a weaker yen and higher stocks — both assist in demand creation, growth and debt reduction. On that note, there has been talk out of Japan that they may increase the size of their direct ETF purchases (more outright buying of stocks).
3) There has also been talk out of Japan that the BOJ may start paying banks to borrow money from the BOJ (negative interest rates on loans) and may start buying high risk corporate debt.
To simplify it, below is the most important data for the BOJ. The yen and the Nikkei. Both are going the wrong direction for the BOJ. All of their work since initiating the second round of QE in Japan has been undone.
Source: Billionaire’s Portfolio
The Nikkei opened at 15,817 the day the BOJ surprised the world with more QE in October of 2014. After trading as high as almost 21,000 last year, the Nikkei closed today at 15,859. And the yen is already at a higher point against the dollar than it was when the BOJ boosted stimulus last – bad news for the BOJ.
We said this last month going into BOJ: “An aggressive response would surprise markets. That’s what the BOJ likes and wants, because it gives their policy actions more potency.” It didn’t come then, but we think we will see it tomorrow night, even though the market is betting on no change.
To follow our big picture views and our hand selected portfolio of the best stocks owned by the best billionaire investors in the world, join us in our Billionaire’s Portfolio.
Last week we talked a lot about the German bund yield, the most important market in the world right now. Today we want to talk about how to trade it.
The best investors in the world love asymmetric bets (limited downside and virtually, if not literally, unlimited upside). That’s the true recipe to building huge wealth. And there is no better asymmetric bet in the world right now than the German 10-year bund.
With that in mind, in recent weeks, we’ve revisited Bill Gross’ statement last year, when the 10-year government bond yields in Germany were flirting with zero the first time. He called it the “short of a lifetime” to be short the price of German bunds – looking for yields to bounce back. It happened. And it happened aggressively. Within two months the German 10 year yield rocketed from 6 basis points to over 100 basis points (over 1%). But even Gross himself wasn’t on board to the extent he wanted to be. The bounce was so fast, it left a lot of the visionaries of this trade behind.
But over the past year, it’s all come back.
Is it a second chance? German yields are hovering just a touch above zero — threatening to break into negative yield territory for one of the world’s most important government bond markets.
As we said on Friday, the zero line on the German 10-year government bond yield is huge psychological marker for perceived value and credibility of the ECB’s QE efforts. And that has huge consequences, not just for Europe, but for the global economy.
Given the importance of this level (regarding ECB credibility), it’s no surprise that the zero line isn’t giving way easily. This is precisely why Bill Gross called it the “short of a lifetime.” With that, let’s take a look at the incredible risk/reward this represents, and a simple way that one might trade it.
There is a euro bund future (symbol GBL) that tracks the price of the German 10-year bund. Right now, you can trade 1 contract of the German bund future at a value of 164,770 euros by putting up margin of 3,800 euros (the overnight margin at a leading retail broker). If you went short the bund future, here are some potential scenarios:
If you break the zero line in yield, the euro bund future would trade up to about 165.50 (it currently trade 164.77). If you stopped out on a break of zero in yield, you lose 730 euros (about $820 per contract). If the zero line doesn’t breach, and yields do indeed bounce from here, you make about 1,500 euros for every 10 basis point move higher in the German 10-year bund yield.
For example, on a bounce back to 32 basis points, where we stood on March 15th, the profit on your short position would be about 4,600 euros (or about $5,200). If German bund yields don’t breach zero and bounce back to 1%, where it traded just a year ago, you would make about 15,000 euros ($16,900) per contract on your initial risk of $820 – a 20 to 1 winner. Of course, there are margin costs to consider, given the holding period of the trade, but in a zero rate world, it’s relatively small.
If you’re wrong, and the German 10-year yield breaches zero, you’ll know it soon.
To follow our big picture views and our hand selected portfolio of the best stocks owned by the best billionaire investors in the world, join us in our Billionaire’s Portfolio.
On Wednesday we talked about the most important market in the world, right now. It’s German bunds.
The yield on the 10-year German bund had traded to new record lows, getting just basis points away from the zero line, and thus from crossing into negative yield territory for the 10-year German government bond. That has inched even closer over the past two days, touching as low as 1 basis point today.
Not surprisingly, stocks sold off today. Volatility rose. Commodities backed off. And the broader mood about global economic stability heads into the weekend on the back foot. For perspective, though, U.S. stocks ran to new 2016 highs this week, and are sniffing very close to record highs again. Oil and commodities have been strong, and the broad outlook for the economy and markets look good (absent an economic shock).
What’s happening? Of course, the vote that is coming later this month in the UK, on whether or not UK citizens will vote to ‘Stay’ in the European Union or ‘Leave’ continues to bubble up speculation on the outcome. That creates uncertainty. But the real reason rates are sliding is that the European Central Bank is in buying, not just government bonds, but now corporate bonds too. The QE tool box has been expanded. That naturally drives bond prices higher and yields lower. But the question is, will it translate into a bullish economic impact (i.e. the money the ECB is pumping into the economy resulting in investing, spending, hiring, borrowing). As we discussed on Wednesday, it’s the anticipation of that result that sent rates higher in the U.S. when the Fed was in, outright buying assets, in its three rounds of QE.
With that, the most important marker in the world for financial markets (and economies) in the coming days, remains, the zero line on the German 10-year government bond yield. Draghi has already told us, outright, that they will not take benchmark rates negative (as Japan did). That makes this zero line a huge psychological marker for perceived value of the ECB’s QE efforts.
With this in mind, we head into a Fed meeting next week. The Fed has done its job in managing down expectations of a hike next week. With that, they have no risk in holding off until next month so that they can see the outcome of the stay/leave vote in the UK. And, as we’ve discussed, the Bank of Japan follows the Fed on Wednesday night with a decision on monetary policy. They are in the sweet spot to act, not only to reinvigorate the weak yen trend and strong stock trend in Japan, but to add further stimulus and perception of stability to the global economy. We think we will see that happen.
Join us in our Billionaire’s Portfolioandfollow the lead of the best billionaire investors in the world. Learn more here.
On Tuesday we talked about the quiet bull market in commodities. Today we want to talk about one specific commodity that has been lagging the sharp rebound in oil, but is starting to make a big-time move. It’s natural gas. And this is an area with some beaten up stocks that have the potential for huge bounce backs.
Natural gas today was up almost 6% to a six month high. The U.S. Energy Information Administration said in its weekly report that natural gas storage rose less than what analysts had forecast. But that was just an extra kick for a market that has been moving aggressively higher in the past NINE days (up 37% in nine days).
Now, we should note, nat gas is a market that has some incredible swings. Over the past three years it has traded as high as $6.50 and as low as $1.64.
For perspective on the wild swings, take a look at this long term chart.
You can see we’re coming off of a very low base. And the moves in this commodity can be dramatic.
Three months ago natural gas was continuing to slide, even as oil was staging a big bounce. But natural gas has now bounced 58% after sniffing around near the all-time lows. Meanwhile, oil has doubled.
Based on the backdrop for oil, broader commodities, the economy we’ve been discussing, and the acknowledging the history of natural gas prices, we could be looking at early stages of a big run in nat gas prices.
Summer is one of the most volatile periods for natural gas with the combination of heat waves, hurricanes and potential weather pattern shifts such as La Nina. During the summer months, a 50% move in the price of natural gas is not uncommon. Another 50% rise by the end of the summer would put it around $4. And four bucks is near the midpoint of the $6.50 – $1.65 range of the past three years.
Billionaires investor David Einhorn has also perked up to the bull scenario in nat gas. In his most recent investor letter his big macro trade this year is long natural gas. Here’s what he had to say: “Natural gas prices are not high enough to justify drilling in all but the very best locations. The industry has responded by dramatically reducing drilling activity. As existing wells deplete, supplies should fall. The high cost of liquefying and transporting natural gas limits competition to North American sources. Current inventories are high following a period of over-drilling and a record warm winter. However, the excess inventory is only a couple percent of annual production, which has already begun to decline. Normal weather combined with lower production could lead to a shortage within a year.”
This all contributes to the bullish action we’re seeing across commodities, led by the bounceback in oil. The surviving companies of the energy price bust have been staging big comebacks, but could have a lot further to go on a run up in nat gas prices.
In our Billionaires Portfolio, we have an ETF that has 100% exposure to oil and natural gas – one we think will double by next year. Join us today and get our full recommendation on this ETF, and get your portfolio in line with our Billionaire’s Portfolio.
The word China is often thrown around to explain why markets are in turmoil. China doing well was a threat to western civilization. China doing poorly is now a threat to Western civilization.
Which one is true?
First, a bit of background. Over the past twenty years, China’s economy has grown more than fourteen-fold! … to $10 trillion. It’s now the second largest economy in the world.
During the same period, the U.S. economy has grown 2.5x in size.
So how did China achieve such an ascent and position in the global economy? One word: Currency.
To follow the stock picks of the world’s best billionaire investors, subscribe at Billionaire’s Portfolio.
For a decade, China maintained a fixed exchange rate policy — the yuan was pegged against the dollar. One U.S. dollar bought 8.27 yuan. This allowed China to undercut the rest of the world, churning out cheap commoditized goods, competing on one thing: Price.
But in 2005, China changed its currency policy. It abandoned the peg.
After political tensions rose between China and its key trading partners, namely the U.S., China adopted a “managed float.” Under this policy China agreed to let the yuan trade in a defined daily trading band, while gradually allowing it to appreciate. This was China’s way of pacifying its trading partners while maintaining complete control over its currency.
Over the next three years the Chinese yuan climbed 17 percent against the dollar, enough to ease a politically sensitive issue, but far less than the relative economic growth would warrant. In fact, China’s economy grew by 43 percent while the U.S. economy grew only 10 percent.
That timeline leads us up to the bursting of the global credit bubble. What caused it? The housing bubble can be credited to a key decision made by the government sponsored credit agencies (Fitch, Standard and Poors, Moody’s), all of which stamped AAA ratings on the mortgage bond securities that Wall Street was churning out.
With a AAA rating, massive pension funds couldn’t resist (if they wanted to keep their jobs) loading up on the superior yields these AAA securities were offering. That’s where the money came from. That’s the money that was ultimately creating the demand to give anyone with a pulse a mortgage. That mortgage was then thrown into a mix of other mortgages and the ratings agencies stamped them AAA. They rinsed and they repeated.
But where did all of the credit come from in the first place, to fuel the U.S. (and global) consumption, the stock market, jobs, investment, government spending … a lot of the drivers of the capital that contributed to the pin the pricked the global credit bubble (i.e. the U.S. housing bust)? It came from China.
China sells us goods. We give them dollars. They take our dollars and buy U.S. Treasuries, which suppresses U.S. interest rates, incentives borrowing, which fuels consumption. And the cycle continues. Here’s how it looked (and still looks):
The result: China collects and stockpiles dollars and perpetuates a cycle of booms and busts for the world.
That’s the structural imbalance in the world that led to the crisis, and that problem has yet to be solved. And the outlook, longer term, for a solution looks grim because it requires China to move to develop a more robust, and consumer led economy. That structural shift could take decades. And going from double digit growth to low single digit growth in the process is a recipe for social uprising of its billion plus people.
In the near term, the likelihood that China will fight economic weakness with a weaker currency is high. We’ve seen glimpses of it since August. And the hedge fund community is ramping up bets that it’s just starting, not ending.
Above is a look at the dollar vs the yuan chart (the line going lower represents yuan appreciation, dollar depreciation). Longer term, China’s weak currency policy is a threat to economic stability and geopolitical stability. But short term, it could be a shot in the arm for their economy and for the global economy.
To get our best of the best portfolio of billionaire owned stocks at our new Billionaire’s Portfolio, subscribe today.
The goal of the Billionaire’s Portfolio is simple: to provide retail investors with the same plain-vanilla stock investments that the world’s greatest billionaire investors and hedge funds own. And our subscribers can invest alongside these billionaires without the typical $5 million minimum investments and paying big hedge fund management and performance fees. Instead, they get access to our best of the best portfolio of billionaire owned stocks for just $297 a quarter.

 We’ve past yet another hurdle of concern for markets this past week. Last Friday this time, we had a potential catastrophic category 5 hurricane projected to decimate Florida.