April 17, 5:00 pm EST

Last month we talked about Chinese stocks has a key spot to watch for: 1) are they doing enough to stimulate the struggling economy, and 2) (more importantly) are they taking serious steps to get to an agreement on trade with the U.S.?

The signal has been good.  Chinese stocks are up 34% since January 4th.

As I said back in March, Chinese stocks are reflecting optimism that a bottom is in for the trade war and for Chinese economic fragility.  That’s a big signal for the global (and U.S.) economy.

Fast forward a month, and we’re starting to see it (the bottoming) in the Chinese data.  Overnight, we had a better than expected GDP report.  And industrial output in China climbed at the hottest rate since 2014.

For those that question the integrity of the Chinese GDP data, many will look at industrial output and retail sales.  Retail sales had a better than expected number too overnight.  And the chart (too) looks like a bottom is in. 

Remember, by the end of last year, much of the economic data in China was running at or worse than 2009 levels (the depths of the global economic crisis).

The signal in stocks turned on the day that the Fed put an end to its rate hiking path AND when the U.S. and China re-opened trade talks (both on January 4th).

April 10, 5:00 pm EST

The minutes were released from the March Fed meeting today.  But we already know very clearly where they stand.

Remember, they spent the better part of the first three months of the year marching out Fed officials (one after another) to give us a clear message that they would do nothing to kill the economic recovery.

Just in case there was any question, Jay Powell stepped in just ahead of the March Fed meeting with an exclusive 60 Minutes interview, where he spoke directly to the public, to reassure everyone that the economy was in good shape, and that the Fed was there to promote stability (i.e. rates on hold and even prepared to act if the environment were to turn for the worse).

As expected, the ECB echoed that position today, following their meeting on monetary policy.  As we’ve discussed, the major global central banks have again coordinated both messaging and policy to ward off an erosion of confidence in the global economy.   No surprises.  And I’m sure managing the U.S. 10-year yield has been part of that coordinated response.  In addition to the speculative flows that have pushed yields lower, I suspect there has been a healthy dose of central bank buying (Bank of Japan and others through sovereign wealth funds).

With that, even though stocks have bounced back, commodities are on the move, and we’ve had improvements in global economic data, we still have European 10-year yields (Germany) at zero and U.S. yields at 2.50%. That is promoting the global central bank stability plan.

Sign up to my Billionaire’s Portfolio and get my market beating Billionaires Portfolio … Live Portfolio Review conference calls … Weekly notes with updates and specific recommendations on following the best billionaire investors …  Access to my member’s only area on the Billionaire’s Portfolio.  Plus, my blog — full of information that will set you apart from other average investors.

Join now and get your risk free access by signing up here.

April 5, 5:00 pm EST

As we end the week, the overhang of risks to markets, the Trump administration and the economy are as light as we’ve seen in quite some time.

With that, stocks are back within sniffing distance of record highs.  And I suspect it’s just getting started.

Remember, we’ve talked a lot about the comparisons between today and 1995.  But we should also acknowledge how things played out through 2000, after the Fed backtracked on errant policy in the mid-90s.

Let’s revisit an excerpt from my daily notes on the topic …

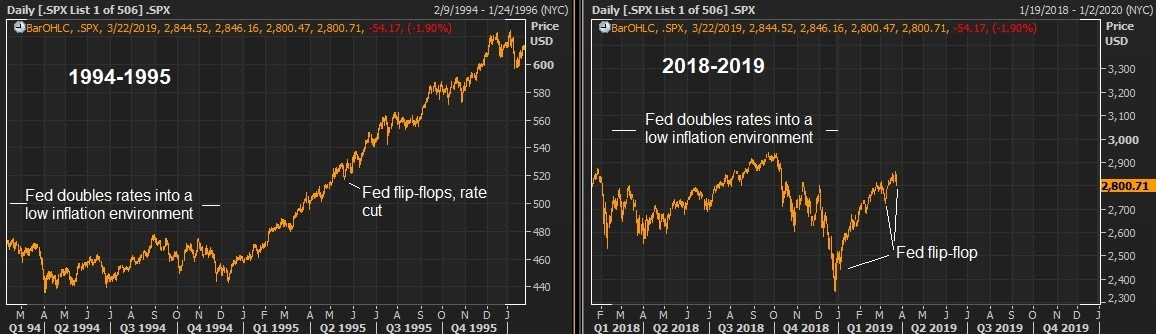
“Last year (2018) was the first year since 1994 that cash was the best producing major asset class (among stocks, real estate, bonds, gold). The culprit for such an anomaly: An overly aggressive Fed, tightening into a low inflation, recovering economy. 

The Fed ended up cutting rates by 1995, and that spurred a huge run up in stocks (up 36%). Fast forward: we now (too) have a Fed that has been overly aggressive, tightening into a low inflation, recovering economy. And just as they did in 1995, the Fed is now doing an about face. Given where the Fed has positioned itself now, compared to just three months ago, I would argue we already have a repeat of 1995 from the Fed … Within a few quarters of the 1995 rate cut, U.S. growth was printing above 4% and did so for 18 consecutive months. Stocks TRIPLED over that period.”

So, just as people are arguing that the expansion cycle of the past decade is coming to an end, we may very well see that the real boom is just getting started.

We continue to have tailwinds of fiscal policy, deregulation and structural reform still working through the economy.  And the Fed has now given us the greenlight, with policies designed to fuel higher stock prices!

These are the moments when real wealth can be created in stocks. I want to make sure you are acting, not watching from the sidelines.

With that, today I want to offer you a peak at my premium advisory service for zero risk.

Sign up today and look through my entire portfolio of stocks, all of which are vetted and owned by the best billionaire investors in the world.  Listen to my recorded “Live Monthly Portfolio Reviews.”  Read all of my past notes to my subscribers.  Take it all in.  If you find that it doesn’t suit you, just email me within 30 days and I’ll refund your money in full immediately.

Frankly, I know when people join this service, they don’t leave.  In fact, they refer their friends.  If you can read a weekly note from me, I can help you make money.

You’ll get my market beating Billionaires Portfolio … Live Portfolio Review conference calls … Weekly notes with updates and specific recommendations on following the best billionaire investors …  Access to my member’s only area on the Billionaire’s Portfolio.  Plus, my blog — full of information that will set you apart from other average investors.

Join now and get your risk free access by signing up here.

April 2, 5:00 pm EST

Oil is one of the biggest movers of the day, now back above $60.

That’s nearly 50% higher from the lows of late December.

Is that surprising?  It shouldn’t be.  Declines in both stocks and oil (late last year) were triggered by threats of sanctions on Saudi Arabia.  We talked about it as it transpired in these daily notes. The stock market decline started on October 3rd when headlines hit that implicated the Saudi Crown Prince in the murder of the journalist, Jamal Khashoggi.  Oil topped the same day, and then accelerated the day Trump spoke with the Saudi Crown Prince on the phone on October 16. Oil opened that day at $72 and hasn’t seen the level since (forty-three days later it was trading at $42).

The Saudi capital flight threat dissolved as it became clear later in the year that the U.S. would sanction Saudi individuals only — and not the Crown Prince, nor the government.  Sill those geopolitical risks early on, soon turned into eroding sentiment — as lower stocks, feed weaker confidence.

But we’ve had a full “V-shaped” recovery in stocks.  And I’ve suspected we would see the same in oil prices. And the catalyst has been a coordinated response from global central banks, not too dissimilar from what we saw in 2016, following another oil prices crash.  Oil and stocks rallied aggressively back then.  And we’re seeing a similar result this time.

Remember, we looked at this chart back in February…


Here is a look at the chart now as crude continues to recover the declines of late last year (working toward completing the “V”)…

Join me here to get my curated portfolio of 20 stocks that I think can do multiples of what broader stocks do, through the end of the year.

April 1, 5:00 pm EST

Last week we talked about the buildup to the Lyft IPO.

Lyft, “lifted” to a valuation of close to $25 billion when shares started trading on Friday.  Today, it’s down as much as 20% from the Friday highs.

The last private investment valued the company at $15.1 billion.  That gave them a paper gain of over 60% on Friday, for just a 9-month holding period. Good for them.

For everyone else, remember, you’re looking at a company that did a little over $2 billion in revenue, while losing almost a billion dollars. Most importantly, over the three years of data that Lyft shared in its S-1 filing, revenue growth has been slowing and losses have been widening.

So, you’re buying a company that hopes to be profitable in seven years, to justify the valuation today.  This is a company that has only existed seven years.  And to think that we can predict what the next seven will look like, in the ever changing technology and political/regulatory environment (much less economic environment), is a stretch.

For some perspective on these valuations, below is what it looks like if we compare the three largest/dominant car rental car companies (Enterprise, Hertz and Avis) to the two largest/dominant ride sharing companies.


With Uber now expected to be valued at around $120 billion when it goes public (possibly this month), the ride sharing industry is valued at about 14 times the car rental industry.

The rental car industry has been priced as if ride-sharing industry has destroyed it.  Ironically, if the ride sharing movement is to succeed in the long-run, and is to fully reach the potential that is being priced into the valuations, then they will need these car rental companies to supply and manage the fleet of vehicles required for Uber and Lyft to scale.

Join me here to get my curated portfolio of 20 stocks that I think can do multiples of what broader stocks do, through the end of the year.

March 29, 5:00 pm EST

We’ve talked about the prospects of a repeat of 1995, when the Fed flip-flopped — cutting rates, following an overly aggressive tightening cycle. Stocks soared.

With that in mind, in addition to the about-face the Fed has done over the past three months, verbally managing down expectations on rates, we’ve since heard from (effectively) the White House, calling for “an immediate 50 basis points cut.”

Trump has selected Stephen Moore as an nominee for the Fed.  He publicly called for the 1/2 point cut this week.  And today, Larry Kudlow, the White House Chief Economic Advisor, said the same.

The Fed wants ammunition if a U.S. slowdown occurs (as damage control).  The White House wants a cut to “protect” the current growth — i.e. to pre-empt a slowdown (prevent the damage).

This comes following a weaker final Q4 GDP number, which dropped full year 2018 growth just below 3% (2.9%).  And the reality is, Q1 won’t be a big number (thanks in part to the sentiment scars from the Q4 stock market decline). It looks like 1.5% at the moment.  That would be the slowest growth since Q1 2016.

Are the calls for a cut from the White House coming because they don’t think a China deal will happen?  Possibly.  More likely, the Trump administration wants the spigot open, to fuel economic momentum into the 2020 election.  Why not press the accelerator, given the continued tame inflation environment and softness in Europe and China?

Join me here to get my curated portfolio of 20 stocks that I think can do multiples of what broader stocks do, through the end of the year.

March 28, 5:00 pm EST

Earlier this month, we talked about the big IPO agenda this year.

We have some big Silicon Valley “disrupters” set to go public this year, including Lyft, Uber, WeWork and Airbnb.

Lyft will IPO tomorrow.  The expectations is for a $20+ billion valuation.

The company has raised $4.9 billion in the private market since launching in 2012.   A little more than a year ago, it raised money at an $11 billion valuation.  If you were the investor at that stage, you’re looking at a double when it goes public (just 15-months later).

Now, if you are joe-average investor, as a buyer of Lyft shares, you’re about to pay these early private market investors at a $22 billion valuation.  This is a company that did about $2 billion in revenue last year, and lost about a billion dollars.

Remember, while the founders of these companies will become celebrated billionaires, the investors that buy these shares in the public market don’t tend to get rewarded very well.  Of course, there are exceptions, but remember, the IPOs this year are coming into a far less friendly regulatory environment than their “disrupter” predecessors of the past decade.

The reality:  The hyper-growth valuations are unlikely to get hyper-growth, as the regulatory advantages Silicon Valley has enjoyed over the past decade are now being scrutinized by Washington.

Here’s how the big “disrupters” of the past two years have fared, after much anticipated IPOs.

Dropbox:  Dropbox was priced at $21 per share.  It started trading at over $28.  Today it trades at $22.

Spotify:  Priced at $165.90 per share.  It started trading at $164.  It currently trades at $137.

Snap: Priced at $17 per share.  It started trading at $22.  Today it trades at $10.80.

After Lyft, Uber is on deck.  Uber last raised venture capital at a $68 billion valuation.  They are expected to go public at a $120 billion valuation.

Join me here to get my curated portfolio of 20 stocks that I think can do multiples of what broader stocks do, through the end of the year.

March 27, 5:00 pm EST

We’ve talked this week about the yield curve inversion.

In response, the market is now pricing in a better than 70% chance of a rate cut in June.  And Trump’s new pick to join the Fed, Stephen Moore, has said the Fed should cut by 50 basis points immediately.We’ve talked about the comparisons between 2019 and 1995.  In 1994 the Fed aggressively tightened into a low inflation, recovering economy (as they did in 2018).  By the middle of 1995, they were cutting.  Stocks finished the year up 36%.

Given the contrast of where the Fed has positioned themselves now, compared to just three months ago, they have effectively eased — and we can see it clearly manifested in the interest rate market.  The 10-year U.S. government bond yield has gone from 3.25% to under 2.5% since just November.  I would argue we already have a repeat of 1995.

Here’s a look, in the chart on the left, at what stocks did in 1994-1995, when the Fed transitioned from overtightening (into a low inflation, recovering economy) to easing.  And, on the right, this is how things look now, with similar context. 


Within a few quarters of the ’95 rate cut, U.S. growth was printing above 4% and did so for 18 consecutive quarters.  Stocks tripled over that period.

Join me here to get my curated portfolio of 20 stocks that I think can do multiples of what broader stocks do, through the end of the year.

March 26, 5:00 pm EST

Yesterday we talked about the yield curve inversion.

It was driven by the Fed walking up the fed funds rate (i.e. “normalizing rates”) over the course of the past three years.  As we discussed yesterday, with global central banks pinning down the long-end of the yield curve through QE (now led by the BOJ), there were few things better telegraphed than the U.S. yield curve inversion.

The market is now pricing in a 66% chance of a rate cut by the end of the year.  The market is arguing that the rate hike the Fed made in December, was a mistake.

When have we seen this script before?  1995.  As we discussed coming into the year, 2018 was the first year since 1994 that cash was the best producing major asset class (among stocks, real estate, bonds, gold).  And the culprit was an overly aggressive Fed tightening cycle in a low inflation recovering economy.

The Fed ended up cutting rates in 1995 and spurring a huge run up in stocks (up 36%).  That’s the bet people are making again.  But I suspect we’ve already seen the equivalent of a cut through the Fed’s dovish posturing since early January.  Remember, they went on a media blitz the first several days of January, dialing down expectations that there would be any more tightening.

Join me here to get my curated portfolio of 20 stocks that I think can do multiples of what broader stocks do, through the end of the year.

March 25, 5:00 pm EST

There was a big technical break in the interest rate market on Friday.   And the yield curve inverted.

What does it mean, and should we be concerned?

First, when people talk about the yield curve, they are typically talking about the yield on the 3-month Treasury bill versus the yield on the 10-year government bond.  The latter should pay more, with the idea that money will cost more in the future (compensating for inflation and an “uncertainty about the future” premium).

When the 10-year is paying you less than you could earn holding a short term T-bill, the yield curve is said to be inverted.  And this dynamic has predicted the past seven recessions.  Why?  Because it typically will be driven by a tighter credit environment, namely banks become less enthused about borrowing in the form of short term loans, to lend that money out in longer term loans.  Money dries up. Unemployment goes up. Demand dries up. Economy dips.

With this in mind, today the 3-month treasury bill pays 2.44%. And the 10-year government bond pays 2.41%.  The spread is negative which makes for an inverted yield curve.

Now, while an inverted yield curve has preceded recessions with a good record, we’ve also had inverted yield curves and no recession has followed.

What isn’t talked about much, is why the yield curve is inverting this time.  It sort of spoils the drama to talk about the “why”.  Unlike any other time in history, we have an interest market that has been explicitly manipulated by global central banks for the past decade (via global QE).  And we have one major central bank (the Bank of Japan) remaining as a buyer of unlimited global assets (that includes U.S. 10 years, which pushes the 10-year yield lower).

Remember, the Bank of Japan’s policy of targeting their 10-year government bond yield at zero, means they will be a buyer of unlimited bonds to push JGB yields back toward zero (price goes up, yields go down).  And when the tide of global rates is rising, pulling UP their yields, they will be a buyer of whatever they need to, to push things back down (and they’ve done just that).

What does that mean?  It means, as the Fed has been walking its short-term benchmark rate higher, the “long-end” of the interest rate market (the 10-year yield) has been anchored by central bank buying – buying by all major central banks for the better part of a decade, and now led by the BOJ.  That has kept a lid on the U.S. 10-year government bond yield, and global government bond yields in general.

With this at work, there have been few things better telegraphed than a U.S. yield curve inversion, as the Fed has told us for years that they will march their short-term rate beyond the anchored 10-year yield.
It’s often dangerous to say “this time is different”, but I think it’s fair to say that the past yield curve inversion/recession analyses don’t compare, when you have both components (the front-end and the long-end) completely controlled by global central banks for more than a decade.  Join me here to get my curated portfolio of 20 stocks that I think can do multiples of what broader stocks do, through the end of the year.