March 22, 5:00 pm EST

Stocks have swung around this week and will finish down just around three-quarters of one percent since last Friday.

The media loves to make a big deal out of a daily decline in stocks, which they did this morning.

But let’s look at some charts and some perspective.

We’ve talked about the Fed’s actions this week.  As I’ve said, with solid growth, low unemployment, subdued inflation and the risks outstanding that Brexit and/or a U.S.-China trade deal could go bad, they are in the position where they can telegraph flexibility in policy, which could even include a cut or more QE.  Again, a lesson learned from the Fed’s mistakes of the past 10 years — set the expectations bar too low, not too high.

With the Fed’s clear pivot over the past three months, we’re getting this technical breakdown in U.S. yields… 

This is now over 75 basis points lower than the peak in market rates in November. That’s a big adjustment. This means we’ve had nine quarter-point rate hikes by the Fed since 2015, for a total of 2.25 percentage points.  Yet, if we look at the post-crisis low in market interest rates, which was just prior to the 2016 election (1.32% in July of 2016), this morning the market was only adjusting for about half of those Fed hikes.

So, in November of last year, the interest rate market was pricing in nearly all of the Fed’s normalization in rates.  Now, the market is pricing in just half of it.  What does that mean?

Again, as I said on Wednesday, I would say this is a market pricing in theworst-case scenario – a no deal with China.  And I would say, at this stage, that’s an extreme view.

What about German yields? 

Today, the German government bond yields slipped back into negative territory for the first time since 2016.  Isn’t this, and the global QE-induced status of the U.S. yield curve, signaling recession ahead?

There was indeed some softer data out of Europe today, but the real driver of negative German yields is simply U.S. yields.  The spread between German and U.S. 10-year yields, peaked last November at a record 278 basis points when the Fed was going one way, and the ECB was going the other.  With the Fed and the ECB now facing virtually the same direction on monetary policy, that spread is narrowing.  Bottom line, U.S. yields go down, German yields go down – especially given that the worst-case scenarios for both central banks (Fed and the ECB) are global growth oriented (namely, China).

Does the interest rate market, which is reflecting  a combination of pro-active central banks and market speculation on a worst-case scenario outcome, mean stocks should be going down?

If we look back at the last time the Fed pivoted from hiking, to sitting on their hands … and the last time German yields were negative, stocks went UP.  That was 2016.  If you bought the S&P when German yields went negative and sold them when German yields returned to positive territory, you made about 4%.

With this in mind, stocks run into this big trendline today and hold.  This will be a key technical spot to watch.

Bottom line:  I suspect the bond move is way overdone, and stocks are a buy on the dip.  Still, the swings in stocks and the recent memory of December, should have the Trump team inclined to get a trade deal done.
Join me here to get my curated portfolio of 20 stocks that I think can do multiples of what broader stocks do, through the end of the year.

March 20, 5:00 pm EST

The Fed met today and confirmed the signaling we’ve seen since early January.

With the luxury of solid growth, low unemployment and subdued inflation, they have been signaling to markets, since January, that they will do nothing to rock the boat.  That move has restored confidence and stock prices (a reinforcing loop).

So, the Fed has gone from mechanically raising rates (as recently as December) to sitting on their hands.  And today they are forecasting no further rate hikes this year, and they are ending the unwind of their balance sheet in September (ending quantitative tightening).

This all looks like a move to neutral, but given the rate path they had been telegraphing up until the end of last year, this pivot is effectively easing — especially since these moves look like pre-emptive strikes against the potential of Brexit and U.S./China trade negotiations going bad.

With that, we have a big technical break in the bond market today.  The U.S. 10-year government bond yield (chart below) broke this important trendline today.


This trendline represents the “normalization” of market rates following the Trump election.  Following the election, with the optimism surrounding Trumponomics, the market started pricing OUT the slow post-recession economic growth rut, and pricing IN the chance that we could see a return to sustained trend growth.

So, what is it pricing in now?  I would say its pricing in the worst-case scenario – a no deal with China.

Join me here to get my curated portfolio of 20 stocks that I think can do multiples of what broader stocks do, coming out of this market correction environment.

March 19, 5:00 pm EST

We’ve seen the verbal and Twitter shots taken by Trump at the tech giants since he’s been in office.  And the threats have slowly been materializing as policy.

We get this today …


With this in mind, we’ve talked quite a bit about the domestic leveling of the playing field. The tech giants (Facebook, Amazon, Netflix, Google, Twitter …) are on the regulatory path to being held to a similar standard that their “old economy” competitors are held to.  They may have to pay for real estate (i.e. bandwidth). They may be scrutinized more heavily for anti-competitive practices.  And they may be liable for content on their site, regardless of who created it.

The latter was the subject of the Trump tweet today.  And he was asked about it in a press conference.  He said we “have to do something about it.”  He called the discrimination and bias “collusion” from the tech giants.

The regulation is coming. And depending on the degree, at best, it changes the business models of these “disrupters.” At worse, it could destroy them.  Imagine, Facebook and Twitter being held liable for things their customers are saying on their platforms.  That’s endless compliance to ward of business killing liabilities.

As compliance costs go UP for these companies.  The cost goes UP for consumers. The model is changed.

On a related note, remember, last September the S&P 500 reshuffled the big tech giants.  Among the changes, they moved Facebook, Google and Twitter out of the tech sector and in to the telecom sector (re-named the “Communications” sector”).

Here’s what that sector ETF looks like since …

Join me here to get my curated portfolio of 20 stocks that I think can do multiples of what broader stocks do, coming out of this market correction environment.

March 18, 5:00 pm EST

Stocks open the week in breakout mode.

We’ve now taken out the December highs, the levels that preceded the sharp 20% plunge.

So, now we have this chart as we enter a week with a Fed meeting on the agenda.


This leaves us up 13% on the year, and with another 4% climb to regain the October all-time highs.

The Fed meets this week.  With a relatively light data and news week, the Fed will get plenty of attention.  But remember, we know exactly where they stand.  They want to maintain confidence in the economy.  And they know the stock market is an important contributor (and can be a dangerous detractor) to confidence.  They need stocks higher.

That’s why on January 4th, the Fed responded to the plunging stock market by marching out the current and past two leaders of the Fed to tell us the “normalization phase” on interest rates was over (i.e. no more rate hikes).

And that’s why on March 10th (just a week ago), in response to a 4% one-day plunge in Chinese stocks and some loss of momentum in the U.S. stock market rebound, Powell followed the script of his predecessor Ben Bernanke, and spoke directly to the public through an exclusive 60 Minutes interview, to reassure the public that the economy was in good shape, and that the Fed was there to ensure stability.  If you bought stocks after both interviews, you felt no pain and have been rewarded handsomely.

With the above chart in mind, below is the chart we looked at to start the year, as we discussed the potential for a V-shaped recovery following the Fed’s January 4th strategic pivot.

From my January 4th Pro Perspectives note:
“We entered the year with the idea that the Fed would need to walk back on its rate hiking path this year (possibly even cutting, if the stock market environment persisted).  And today, just days into the new year, we get the Fed Chair Powell, former Fed Chairs Yellen and Bernanke telling us that the Fed is essentially done of the year, unless things improve … [as for stocks] We broke a big level today on the way up in the S&P 500 (2520) and it looks like a V-shaped recovery is underway, to take us back to where stocks broke down on December 3rd.  That would be 12% from current levels.” So, far so good. The Fed has stabilized confidence.  The question now is, do we get a deal with China soon?  If not, we may find a rate cut, in the near future for the Fed.  The former Minneapolis Fed president, and former voting FOMC member, is calling for a cut, as a pre-emptive strike to a slowdown.Remember, 2018 was the first since 1994 that cash was the best producing major asset class (among stocks, real estate, bonds, gold).  The culprit was an overly aggressive Fed tightening cycle in a low inflation recovering economy.  The Fed ended up cutting rates in 1995 and spurring a huge run up in stocks (up 36%).

Join me here to get my curated portfolio of 20 stocks that I think can do multiples of what broader stocks do, coming out of this market correction environment.

March 15, 5:00 pm EST

As we end the week, let’s take a look at what China is doing to stimulate the economy.

If the world has been worried about global growth, because of the toll that trade reform is taking on China, then the actions China has been taking, and has discussed overnight, should be THE focus for markets — in addition to the status of a U.S./China trade deal.

Remember, by the end of last year, much of the economic data in China was running at or worse than 2009 levels (the depths of the global economic crisis).  It’s clear that the era of double-digit growth in China is over (at the expense of the rest of the world).  The question is, how low can it go, without threatening an uprising against the regime.  They seem to be willing to do ‘whatever it takes’ to defend the 6% growth number.

With that, as we’ve discussed, for a sustained recovery in global growth, expect others to follow the lead of the U.S. with big fiscal stimulus and structural reform (i.e. Europe, Japan …. and China).  With the news overnight from Chinese Premier Li (who has been the pointman for U.S./China trade negotiations), China is preparing an assault on the growth slowdown.  He’s promising an aggressive mix of monetary and fiscal stimulus.

They are looking to do large-scale tax cuts. They’ve promised billions of dollars infrastructure spending.  They’ve already cut the reserve requirement for banks five times in the past year – and they are looking to do more to motivate bank lending.  And they are targeting to create 13 million jobs this year in the manufacturing sector and in small business.

As we’ve discussed, Chinese stocks are reflecting optimism that a bottom is in for the trade war and for Chinese economic fragility.


Join me here to get my curated portfolio of 20 stocks that I think can do multiples of what broader stocks do, coming out of this market correction environment.

March 11, 5:00 pm EST

We ended last week with a 4.4% plunge in Chinese stocks.  What followed, Friday morning (EST time), was an announcement that the Fed Chair (Jerome Powell) would be appearing on an exclusive 60 Minutes sit down interview Sunday night.

This is a rare occurrence, that the Fed Chair does a mainstream media interview/Q&A.  These Q&A’s are typically done in Congressional hearings, following Fed meetings or at select economic conferences.  The common theme:  He speaks economics and policy to economic and policy practitioners.

With that, this interview with 60 Minutes was clearly a desire to speak to the broader public.  In part, it was a response to the growing risks of a confidence shock (given the December stock market decline, Brexit drama and China/U.S. trade uncertainty).  It was an opportunity to tell the public that the economy is doing well, despite the media’s doom and gloom stories.

Also, in part, it was an opportunity to tell the public that the Fed is there to defend against shocks and panics, and that they won’t be swayed by politics.

Powell was also specifically asked about a few of the cherry picked data points the financial media has been parading around in recent days.  As we discussed Friday, without context, some of the data can sound ominous.  He added context, including for the  dip in retail sales from December.  Of course the retail sales hit was the result in the knee-jerk swing in confidence that comes with the December plunge in the stock market.  He said they would be watching the January number closely.  The January number today, indeed, was strong.

That (the interview and the confirmation of the retail sales data) was a catalyst for a big bounceback in stocks today.

Powell is following the script of the Ben Bernanke.  When Bernanke was directing the Fed through the storm of the financial crisis, he (and the Fed) were being killed in the media.  And the media set the tone for global leaders to take shots at the Fed too.  So, Bernanke took to 60 minutes to speak directly to the people – to set the record straight.  That interview set the bottom in the stock market — and it turned the tide in global sentiment.

Join me here to get my curated portfolio of 20 stocks that I think can do multiples of what broader stocks do, coming out of this market correction environment.

March 8, 5:00 pm EST

Overnight, China reported a 20% plunge in its February exports.  That was the driver for a big down day for Chinese stocks — down 4.4%.  For context, this comes after a 27% run UP in the Chinese stock market since January 4th.

The export plunge was the worst reading since February of 2016.  What was happening in February of 2016?  Global stocks put in a bottom in February of 2016, after a quick and ugly 14% correction.  And the bottom was set by some central bank intervention (first the BOJ in the currency markets, then China stoking bank lending, then the Fed and the ECB followed with stimulative policies).  This time around, we are coming out of a deep slide in global stocks too, and we’ve had a similar formula of central bank support to fuel the recovery.

If anything, this Chinese export plunge is even more reason to believe that China has to make a deal, soon (i.e. a deal is getting closer).  Trump and Larry Kudlow (National Economic Advisor) both used the opportunity this morning to make that point.

Still, as I said yesterday, when stocks go down, the media is quick to revive the doom and gloom narrative.

For example, Reuters ran a story today citing some research from Bank of America.  Here’s the headline:  Worst start to the year for equity flows since 2008.

That sounds scary – the 2008 reference.  Let’s take a closer look.

Bank of America says $60 billion has been “yanked” out of equities since the start of the year.  That’s a big number, until you add some context.

Let’s take a look at this historical chart of the total market capitalization of listed domestic companies in the U.S.


The size of the U.S. stock market was just shy of $20 trillion going into the financial crisis back in 2007.  Today it’s worth $32 trillion. So the stock market is more than 50% bigger, which on a relative basis, makes the amount of money that has moved OUT of stocks this year closer to half as large as the retreat in 2007-2008.

While we are on the topic of shocking headlines, another major financial news company ran this headline and touted it on their TV coverage:  U.S. households see biggest decline in net worth since the financial crisis.

There was a drop of $3.73 trillion in the fourth quarter, compared to the third quarter.  Another scary headline.

But as you can see, household net worth is up almost $40 trillion since the pre-financial crisis peak or 58% bigger.  That makes a $3.7 trillion contraction a small blip on the chart.  And, of course, the driver of the losses was solely a stock market rout in December (which has now been largely recovered).

Join me here to get my curated portfolio of 20 stocks that I think can do multiples of what broader stocks do, coming out of this market correction environment.

March 4, 5:00 pm EST

Stocks sold off sharply this morning, before bouncing nicely from the lows.   The range on the day was the third largest of the year.

The question:  Was the selling today technically-driven or was there a catalyst that introduced new risk into the market (i.e. something bigger)?

Let’s take a look at the chart …

With this sharp V-shaped recovery of the past two months, we have stocks testing these highs, and failing today.

But the failure of this level (for the moment) shouldn’t be too surprising.  Following a runup of 20%, for some this is a reasonable technical area to sell some/ to take profit.

But is there more to the sell-off this morning?

We did get an announcement that the Congressional Judiciary Committee has launched an investigation into the Trump administration.  It includes document requests from 80 people/entities tied to the administration.  They will be looking at obstruction of justice, public corruption and abuse of power (the latter of which, might be the most subjective and, therefore, threatening).

After all of the allegations and political mudslinging surrounding Trump, could this pose the biggest risk to the Trump administration and policymaking yet?  Possibly.

Congress has a unchallengeable investigatory and subpoena power.  They can dig as deeply and broadly as the want, and create as much havoc as they want, which means this may dominate what happens on Capitol Hill until the 2020 election.

Now, with all of this said, if we look at the market reaction today, as a proxy for how the market is digesting this — we did not see across the board selling.  That’s good.  If we look inside the U.S. stock market, most active stocks were a mix of up and down on the day (including up days Apple, Facebook, Baba and Amazon).  That’s good.  And foreign stocks were less impacted by the early swing in U.S. stocks.  That’s good. The emerging market futures index MXEF actually finished at the New York close UP from Friday’s close.

Join me here to get my curated portfolio of 20 stocks that I think can do multiples of what broader stocks do, coming out of this market correction environment.

.

February 6, 5:00 pm EST

Trump’s State of the Union address last night telegraphed the next priority in his economic plan:  Infrastructure.

Just two years in, this has become one of the final pillars of his Trumponomics plan, yet to be executed on.

Remember, when Trump took office he quickly went to work on reversing regulations that were stifling industries.  By the end of 2017, we got big tax cuts, which included incentives for companies to repatriate trillions of dollars of money held offshore.  And, of course, the fight for “fair trade” is ongoing, and maybe close to a resolution.

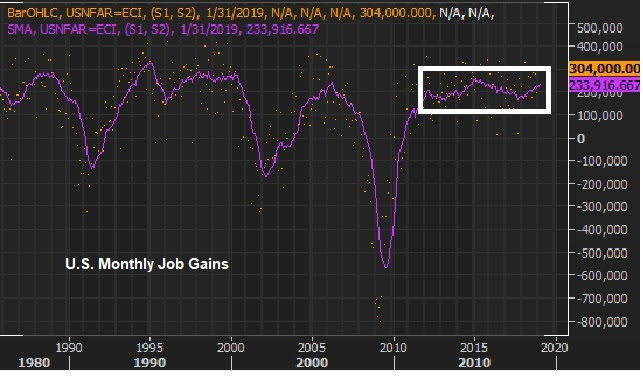
With these pro-growth policies, we have an economy that has finally escaped the decade-long rut of sub-2% growth.  We’ve returned to long-term trend growth (3%+).

So things look good, but we’ve yet to get the big kicker of an infrastructure spend. This is where we could see a real economic boom kick in.

And a split Congress is thought to be supportive of an infrastructure plan.  We’ve heard the Trump plan, which is $1.5 trillion funded through a private/public partnership.  After the Democrats won the house they said infrastructure would be high on the party’s agenda.  Back in March, the Democratic Senators proposed a $1 trillion plan.

If we get it, a big infrastructure spend could finally give us the big bounce back we typically see after a recession (i.e. some very big numbers).

Remember, the recovery of the past decade was manufactured by central banks.  The monetary stimulus and central bank intervention was good enough to keep the patient alive, but not to restore the global economy back to sustained, trend-growth. So we needed fiscal stimulus.  And we’ve gotten it.  But we’ve yet to see the type of big bounce back in growth typical of a post-recession recovery.

For context, in the left column of the table below, you can see the GDP numbers following the Great Depression.  And on the right, you can see the growth of the post-Great Recession (pre-Trump).

FBP_122717.jpg


Join me here to get my curated portfolio of 20 stocks that I think can do multiples of what broader stocks do, coming out of this market correction environment.

February 1, 5:00 pm EST

We had a big rebound for global markets (and economic sentiment) in January.  Today we had the jobs report and some manufacturing data from the past month.

The data continues to show an economy that is in the sweet spot for the Fed.  Economic activity is solid.  And inflation is tame.

The jobs report has been good for a long time now.  Just because stocks collapsed in December, it would make little sense to dial down expectations for the important January jobs numbers.  After all, we’ve seen the chart of roughly 200k new jobs added every month (on average) for the past eight years or so. And that includes some very turbulent times, over that period. 


But Wall Street tends to quickly get sucked into emotional ebb and flow. In the case of the past couple of months, they’ve been adjusting down the bar for earnings and the economy, and we get positive surprises, which are good for stocks.  Today’s number was a big positive surprise — 304k added jobs.

Maybe a more interesting number was the manufacturing number.

The economic activity in the manufacturing sector continued to expand in January, and came in hotter than expected.  In a month of January, where all we heard was the story of slowdown, the nation’s supply executives broadly reported the manufacturing sector to be growing, and a faster clip.

Meanwhile, the inflation component came in softer.  And as you can see in the chart below, it has been on the slide.

Again, this is the sweet spot for the Fed.  The economy doing well, without inflation pressures.  That means they sit and watch (i.e. rates in a holding pattern for the foreseeable future).
Join me here to get my curated portfolio of 20 stocks that I think can do multiples of what broader stocks do, coming out of this market correction environment.