We talked this week about the way markets are set up for a significant positive perception shift. It’s been led by oil, which had its third consecutive close above $40 today. Yields are another key brick in the foundation that may be laid tomorrow.
As oil prices have been a threat to the global economic and stability outlook over the past few months, yields have also been sending a negative signal to markets. The yield on the German 10-year got very close to the all-time lows this week, inching closer to the zero line (and negative territory). And U.S. 10-year yields, following the Fed’s last meeting, have fallen back from 2% down to as low as 1.68% — just 30 basis points above the all-time low of July 2012, when Europe was on the edge of a sovereign debt blow-up. And remember, this is AFTER the Fed has raised rates for the first time in nine years.
So yields have been signaling an uglier path forward, if not deflation forever in places like Japan and Europe. Of course, the move by Japan to negative interest rates in January was a strong contributor to the perception swoon about the global economy. But a key component in Japan’s move, and in the coordinated actions by central banks over the past two months, has been the threat from the oil price bust. And that is now on the mend. Oil is up 58% from its February low.
Still, global yields are hanging around at the lows.
Tomorrow we get euro zone and U.S. inflation data. As we’ve said, when expectations and perception has been ratcheted down so dramatically, we can get an asymmetric outcome. Earnings expectations are in the gutter. Economic growth expectations are in the gutter. Same can be said for expectations on the outlook for inflation data. In a normal world, hotter than expected inflation is a bad signal for the risk-taking environment. In our current world, hotter than expected inflation would not be a good signal, it would be a very good signal. It would show the economy has a pulse.
Yields in the two key government bond markets are set up nicely for a bottom on some hotter inflation data.
Tuesday, German yields touched 7.5 basis points. Remember, earlier in the month we talked about what happened the last time German yields were this low.
Bond kings Bill Gross and Jeffrey Gundlach said it was crazy. Bill Gross called the German bund the “short of a lifetime” (short bonds, which equates to a bet that yields go higher). He compared it to the opportunity when George Soros broke the Bank of England and made billions shorting the British pound. Gundlach said it was a trade with almost no upside and unlimited downside.
They were both right. In the chart below you can see the explosive move in German rates (in blue) away from the zero line. In the chart below, you can see the 10-year German bond yields moved from 5 basis points to 106 basis points in less than two months — a 20x move. U.S. 10 year yields (the purple line) moved from 1.72% to 2.49% almost in lock-step.
On the move down on Tuesday, the yield on the German bund reversed sharply and put in a bullish outside day (a key reversal signal). Could it have been the bottom into tomorrow’s inflation data?
Coincidentally, the U.S. 10-year looks like a bottom may be in as well.
U.S. yields have a chance to break this downtrend tomorrow on a hotter inflation number.
As we said yesterday, in addition to oil, these are very important charts for financial markets and for the global economic outlook. A bottom in these yields, as well as the continued recovery in oil will be important for restoring confidence in the global economic outlook.
This is the perfect time to join us in our Billionaire’s Portfolio. We have just added the billionaire’s macro trade of the year to our Billionaire’s Portfolio — a portfolio of deep value stocks owned by the best billionaire investors in the world. You can join us here.
As we said yesterday, oil on the mend is the key proxy right now for global economic stability. With that, after closing above $40 yesterday, oil continued its surge today, up 4%. And global stocks had a good day, up 1% in the U.S.
Remember, we get key inflation data over the next couple of days, namely from Europe and the U.S. A hotter inflation number in the U.S. would further support the signal that oil is giving to markets (a positive one).
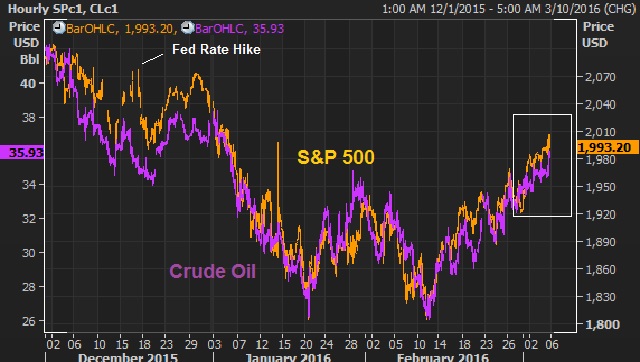
Today we want to look at a few of very key charts. This first chart is an update on the crude oil/stock market relationship. We’ve looked at this a few times over the past few months. The last time we revisited this chart, oil and stocks had started to diverge from stocks with its recent move back into the mid 30s.
So oil is sustaining above $40 for the first time since November. We know three of the top oil traders in the world are betting on $70-$80 oil by next year. We know central banks have stepped in (in coordination) since the low in oil on February 11 and the result has been a 50%+ bounce in oil. Now, technically, oil looks like a technical breakout is here.
In the above chart, you can see oil breaking above the high of March 22 (which was 41.90). In fact, we get a close above that level – technically bullish. And we also now have a technically bullish pattern (an impulsive C-wave of an Elliott Wave structure) that projects a move to $51.50, which happens to be right about where this big trendline comes in.
Now, with the inflation data in the pipeline for the week, we’ve talked about the negative signal that ultra-weak yields are sending to markets. And German yields have been leading the way on that front. But guess what? German yields reversed sharply off of the lows yesterday, and continued higher today, putting in a long term bullish reversal signal (an outside day – technical jargon, but can be very predictive of tops and bottoms). And that coincides with the U.S. 10-year yield, which is on the verge of breaking the recent downtrend and projecting a move back to 2.15%. We’ll take a look at these very important charts for financial markets and for the global economic outlook tomorrow.
These key markets are signaling what could be the beginning of a big shift in sentiment and the beginning of positive surprises in markets and economies, which tends to happen when expectations have been ratcheted down so dramatically, as we discussed yesterday with the sour earnings outlook and pessimistic economic backdrop.
This is the perfect time to join us in our Billionaire’s Portfolio. We have just added the billionaire’s macro trade of the year to our Billionaire’s Portfolio — a portfolio of deep value stocks owned by the best billionaire investors in the world. You can join us here.
Central bank posturing has put a bottom in oil and stocks in the past month. Rising stocks and oil, in this environment, have a way of restoring sentiment and the stability of global financial markets. Those efforts were underpinned by more aggressive stimulus from the European Central Bank last week.
And the Fed furthered that effort today.
Just three months ago, the Fed projected that they would hike rates an additional full percentage point this year. Today they backed off and cut that projection down to just 1/2 percent (50 basis points) by year end.
That’s a big shift. In the convoluted post-QE, post-ZIRP world, that’s almost like easing.
What’s happened in the interim? Janet Yellen was asked that today and said it was: Slowing growth in China … A negative fourth quarter GDP number in Japan … Europe has had weaker growth … and Emerging markets have been weighed down by declines in oil prices.
Aside from the negative GDP print in Japan, none of these were new developments (even Japan was no shocker). Meanwhile, during the period from the Fed’s December meeting to its meeting today, oil did a round trip from $37 to $26 and back to $37.
So what happened? It appears that the Fed completely underestimated the threat of weak oil prices to the global economy and financial system. We’ve talked extensively about the danger of persistently weak oil prices, which, at sub $30 was pushing the world very close to the edge of disaster. That threat became very clear in late January/early February, culminating when the one of the biggest oil and natural gas companies in the world, Chesapeake, was rumored to be pursuing the path of bankruptcy (which was of course denied by the company). It was that moment, it appears, that policymakers woke up to the risk that the oil bust could lead to another global financial crisis — with a cascade of defaults in the energy sector, leading to defaults in weak oil exporting countries, spilling over to banks and another financial crisis.
Today’s move by the Fed, while confusing at best, led to higher stocks and higher oil prices. The market has been pricing in a much more accommodative path for the Fed for the better part of the past three months, and today the Fed dialed down to those expectations (i.e. they have now followed the ECB’s bold easing with some easier policy/guidance of their own), which should provide more fuel for the stabilization of financial markets and recovery of key markets (i.e. the continued bottoming of key industrial commodities, more stable and rising stocks and aggressive recovery in oil).
Were they just that wrong, or are they doing their part in coordinating stimulus from last month’s G20 meeting?
Bryan Rich is a macro trader and co-founder of Billionaire’s Portfolio. If you’re looking for great ideas that have been vetted and bought by the world’s most influential and richest investors, join us at Billionaire’s Portfolio.
The Fed has manufactured a recovery by promoting stability. And they’ve relied on two key asset prices to do it: stocks and housing. Today we want to look at a few charts that show how important the stock and housing market recoveries have been.
While QE and the Fed’s ultra easy policy stance couldn’t directly create demand in a world of deleveraging, it did (and has) indirectly created demand by promoting stability, which restored confidence. Without the confidence that the world will be stable, people don’t spend, borrow, lend or hire, and the economy goes into a deflationary vortex.
But by promising that they stand ready to act against any futures shocks to the economy (and financial markets), investors feel comfortable investing again (stocks go higher). When stocks go higher and the environment proves stable, employers feel more confident to hire. This all fuels demand and recovery. And, of course, the Fed has pinned down mortgage rates at record lows, which promotes a housing recovery, and gives underwater homeowners (at one point, more than a quarter of all homeowners with mortgages) a since that paper losses will at some point be overcome, and that gives them the confidence to spend money again, rather sit on it.
Along the path of the economic recovery, the Fed (and other key central banks) has been very sensitive to declines in stocks. Why? Because declining stocks has the ability to undo what they’ve done. And if confidence breaks again, it will be far harder to restore it.
The first chart here is the S&P 500. Stocks bottomed in March of 2009, when the Fed announced a $1 trillion QE program.
Stocks surpassed the pre-crisis highs in 2013 after six years in the hole. But even after the dramatic rise you can see in the chart the damage from the crisis is far from restored. If we applied the long term annual rate of growth of the S&P 500 (8%) to the pre-crisis highs, the S&P 500 should be closer to 3,150 (over 60% higher).
How does housing look? Of course, bursting of the housing bubble was the pin that pricked the global credit bubble. Housing prices in the U.S. have been in recovery mode since 2012. Still, housing has a ways to go. This is a very important component for the Fed, for sustainable recovery.
While bloated government debt continues to be a big structural problem for the U.S and the rest of the world, growth goes a long way toward fixing that problem.
And growth, low interest rates, higher stocks and higher housing prices goes a long way toward restoring household net worth. As you can see in the chart below, we have well recovered and surpassed pre-crisis levels in household net worth…
Source: Billionaire’s Portfolio
What is the key long-term driver of economic growth overtime? Credit creation. In the next chart, you can see the sharp recovery in consumer credit since the depths of the economic crisis (in orange). This excludes mortgages. And you can see how closely GDP (economic output) tracks credit growth (the purple line).
Source: Reuters, Forbes Billionaire’s Portfolio
What about deleveraging? It took 10 years to build the global credit bubble that erupted in 2007. Based on historical credit bubbles, it typically takes about as long to de-lever. So 10-years of deleveraging would put us at year 2017. With that, it’s fair to think we could be very near the end of that period, where paying down debt has weighed on economic growth.
You can see in the chart below, the average annual growth rate of consumer credit over the past 55 years is 7.9%. And over the past five years, despite the deleveraging, consumer credit growth has been solid, just under the long term average. And importantly, FICO scores in the U.S. have reached an all-time high.
With the recent correction in stocks, there has been increased scrutiny on the economy. Some are predicting another recession ahead. Others are waving the red flag anywhere they find soft economic data. Consumption makes up more than 2/3 of the U.S. economy. And you can see from the charts above, the consumer is in a solid position. But stocks and housing remain key drivers of the recovery. The Fed is well aware of that. With that, don’t expect the Fed, in the current economic environment, to do anything to alter the health of the housing and stock markets.
This week, in our BillionairesPortfolio.com, we followed one of the best billion dollar (plus) activist hedge funds into a stock where they own 12.5%, have three board seats, and are in the process of replacing the CEO. These are are three key ingredients in the success of activist campaigns: 1) a big concentrated position (12.5% stake), 2) control (board seats), and 3) change (a new CEO). This activist fund has won on 82% of its campaigns since 2002 and has a price target on this stock that’s more than 150% higher than the current share price. To join us you can subscribe to our Billionaire’s Portfolio (here).
The word China is often thrown around to explain why markets are in turmoil. China doing well was a threat to western civilization. China doing poorly is now a threat to Western civilization.
Which one is true?
First, a bit of background. Over the past twenty years, China’s economy has grown more than fourteen-fold! … to $10 trillion. It’s now the second largest economy in the world.
During the same period, the U.S. economy has grown 2.5x in size.
So how did China achieve such an ascent and position in the global economy? One word: Currency.
To follow the stock picks of the world’s best billionaire investors, subscribe at Billionaire’s Portfolio.
For a decade, China maintained a fixed exchange rate policy — the yuan was pegged against the dollar. One U.S. dollar bought 8.27 yuan. This allowed China to undercut the rest of the world, churning out cheap commoditized goods, competing on one thing: Price.
But in 2005, China changed its currency policy. It abandoned the peg.
After political tensions rose between China and its key trading partners, namely the U.S., China adopted a “managed float.” Under this policy China agreed to let the yuan trade in a defined daily trading band, while gradually allowing it to appreciate. This was China’s way of pacifying its trading partners while maintaining complete control over its currency.
Over the next three years the Chinese yuan climbed 17 percent against the dollar, enough to ease a politically sensitive issue, but far less than the relative economic growth would warrant. In fact, China’s economy grew by 43 percent while the U.S. economy grew only 10 percent.
That timeline leads us up to the bursting of the global credit bubble. What caused it? The housing bubble can be credited to a key decision made by the government sponsored credit agencies (Fitch, Standard and Poors, Moody’s), all of which stamped AAA ratings on the mortgage bond securities that Wall Street was churning out.
With a AAA rating, massive pension funds couldn’t resist (if they wanted to keep their jobs) loading up on the superior yields these AAA securities were offering. That’s where the money came from. That’s the money that was ultimately creating the demand to give anyone with a pulse a mortgage. That mortgage was then thrown into a mix of other mortgages and the ratings agencies stamped them AAA. They rinsed and they repeated.
But where did all of the credit come from in the first place, to fuel the U.S. (and global) consumption, the stock market, jobs, investment, government spending … a lot of the drivers of the capital that contributed to the pin the pricked the global credit bubble (i.e. the U.S. housing bust)? It came from China.
China sells us goods. We give them dollars. They take our dollars and buy U.S. Treasuries, which suppresses U.S. interest rates, incentives borrowing, which fuels consumption. And the cycle continues. Here’s how it looked (and still looks):
The result: China collects and stockpiles dollars and perpetuates a cycle of booms and busts for the world.
That’s the structural imbalance in the world that led to the crisis, and that problem has yet to be solved. And the outlook, longer term, for a solution looks grim because it requires China to move to develop a more robust, and consumer led economy. That structural shift could take decades. And going from double digit growth to low single digit growth in the process is a recipe for social uprising of its billion plus people.
In the near term, the likelihood that China will fight economic weakness with a weaker currency is high. We’ve seen glimpses of it since August. And the hedge fund community is ramping up bets that it’s just starting, not ending.
Above is a look at the dollar vs the yuan chart (the line going lower represents yuan appreciation, dollar depreciation). Longer term, China’s weak currency policy is a threat to economic stability and geopolitical stability. But short term, it could be a shot in the arm for their economy and for the global economy.
To get our best of the best portfolio of billionaire owned stocks at our new Billionaire’s Portfolio, subscribe today.
The goal of the Billionaire’s Portfolio is simple: to provide retail investors with the same plain-vanilla stock investments that the world’s greatest billionaire investors and hedge funds own. And our subscribers can invest alongside these billionaires without the typical $5 million minimum investments and paying big hedge fund management and performance fees. Instead, they get access to our best of the best portfolio of billionaire owned stocks for just $297 a quarter.
It’s unimaginable that governments and central banks that have coordinated and committed trillions of dollars in guarantees, backstops, commitments and outright bailouts will stand by and let weak oil prices (rigged by OPEC) undo everything they’ve done over the past seven years to create stability and manufacture a global economic recovery.
Oil represents a systemic threat to the global economy. Just as housing created a cascade of trouble, through the global financial system, then through countries, the oil price crash can do the same.
When you see forecasts of $20 oil or lower, and some of it is coming from Wall Street, these people should also follow by telling you to buy guns and build a bunker, because that’s what you would need if oil went there and stayed there.
Not to mention, if they believe in that forecast, they should be formulating a plan for what they will do to make a living going forward, because their employers will likely go bust in that scenario.
The persistence of lower oil, especially less than or equal to $20 oil, would financially ruin the U.S. energy sector. Oil producing countries would be next, starting with Russia (and ultimately reaching the big OPEC nations). A default in Russia would create tremors in countries that hold Russia sovereign debt and rely on trade with Russia. Remember the fallout from the Asian Crisis? A default in Russia was the catalyst. Oil driven sovereign defaults would create a massive flight of global capital to safety and global credit/liquidity would dry up, again. All of this would put the world’s banks back on the brink of failure, just as we experienced in 2008. The only problem is, this time around, the global economy cannot absorb another 2008. Governments and central banks have fired their bullets and have nothing left to fend off another near global economic apocalypse.
With that, we have to believe that this crash in oil prices will not persist, especially when it’s being rigged by OPEC. Intervention now (or soon) is easy (relatively speaking) and returns the world to the recovery path. Intervention too late will require more resources than are available.
What’s the solution? An OPEC cut in production has a way of swinging oil in the other direction dramatically. Back in 1986, just a hint of an OPEC cut swung oil by 50% in just 24 hours. This assumes that the pressure builds on OPEC and they realize that the game of chicken that they are playing with U.S. producers has put themselves, also, precariously close to an endpoint.
Alternatively, we made the case last week that either China, the Bank of Japan or the European Central Bank could step in and outright buy commodities as a policy response to their ailing economies. Both the ECB and the BOJ in the past two weeks have said that there are “no limits” to what they can buy as part of their respective QE programs. That would immediately put a floor under crude, and likely global stocks, commodities and put in a top in sovereign bonds. Remember, when China stepped in, bought up and hoarded dirt cheap commodities in 2009, oil went from $32 to above $100 again.
So what’s the latest on oil?
Chart
This morning, the threat intensified. Oil dropped 5%, trading below the very key level of $30 per barrel. It was driven by an earnings report from the huge oil and gas company, BP. It reported a $6.5 billion loss. The company followed with an announcement of 7,000 job cuts by the end of 2017. Shares of BP stock are now trading back to 2010 levels, when the company was facing the prospects of bankruptcy after the fall–out from its gulf oil spill. This is one of the largest oil and gas companies in the world trading at levels last seen when people were speculating on its demise.
With the move in oil this morning, global stocks took another hit. Commodities were hit and sovereign debt yields were hit (with U.S. 10–year yields falling below 1.9%).
While there is a lot of talk about China and concerns there, clearly oil is what is dictating markets right now.
Take a look at this chart of oil vs. the S&P 500…
You can see the significant correlation historically in the price of oil and stocks. And you can see where oil and stocks came unhinged back in July 2014. The dramatic disconnect started in November 2014 (Thanksgiving Day) when an OPEC meeting concluded. The poorer members of OPEC called for production cuts. Saudi Arabia blocked the requests. That set off the plunge in oil prices.
You can see clearly in this chart where the price of oil is projecting the S&P. And stocks at those levels suggest the scenario we described above (global apocalypse round 2).
Again, a capitulation from OPEC is probably less likely. More likely, a central bank steps in to become an outright buyer of commodities (especially cheap oil). For those that have been shorting oil (and remain heavily short), either scenario would put them out of business quickly.
At this stage, OPEC is not just in a price war with U.S. shale producers, but it’s playing a game of chicken with the global economy. We’ve had plenty of events over the past seven years that have shaken confidence and have given markets a shakeup – European sovereign debt, Greece potentially leaving the euro, among them. In Europe, we clearly saw the solution. It was intervention. Oil prices are creating every bit as big a threat as Europe was; it’s reasonable to expect intervention will be the solution this time as well.


