
As we said yesterday, oil on the mend is the key proxy right now for global economic stability. With that, after closing above $40 yesterday, oil continued its surge today, up 4%. And global stocks had a good day, up 1% in the U.S.
Remember, we get key inflation data over the next couple of days, namely from Europe and the U.S. A hotter inflation number in the U.S. would further support the signal that oil is giving to markets (a positive one).
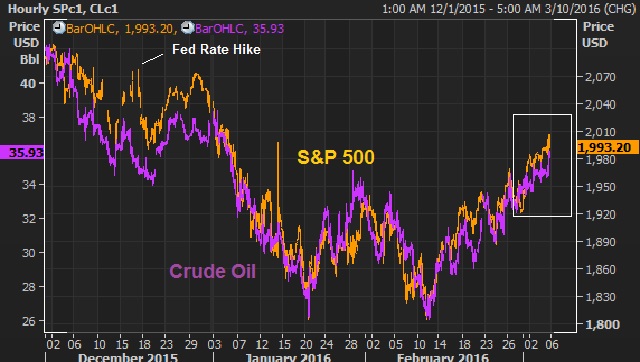
Today we want to look at a few of very key charts. This first chart is an update on the crude oil/stock market relationship. We’ve looked at this a few times over the past few months. The last time we revisited this chart, oil and stocks had started to diverge from stocks with its recent move back into the mid 30s.
Here’s the chart we looked at on April 1.

Source: Billionaire’s Portfolio, Reuters
About this above chart, we said….
“The question: Is this an opportunity to buy oil or sell stocks?
Given the significance of the oil bust threat to the global economy, we would argue the former.”
Indeed, that was the trade. Here’s a look at the relationship since oil’s aggressive bounce back above $40.

Source: Billionaire’s Portfolio, Reuters
So oil is sustaining above $40 for the first time since November. We know three of the top oil traders in the world are betting on $70-$80 oil by next year. We know central banks have stepped in (in coordination) since the low in oil on February 11 and the result has been a 50%+ bounce in oil. Now, technically, oil looks like a technical breakout is here.
 Source: Billionaire’s Portfolio, Reuters
In the above chart, you can see oil breaking above the high of March 22 (which was 41.90). In fact, we get a close above that level – technically bullish. And we also now have a technically bullish pattern (an impulsive C-wave of an Elliott Wave structure) that projects a move to $51.50, which happens to be right about where this big trendline comes in.
Now, with the inflation data in the pipeline for the week, we’ve talked about the negative signal that ultra-weak yields are sending to markets. And German yields have been leading the way on that front. But guess what? German yields reversed sharply off of the lows yesterday, and continued higher today, putting in a long term bullish reversal signal (an outside day – technical jargon, but can be very predictive of tops and bottoms). And that coincides with the U.S. 10-year yield, which is on the verge of breaking the recent downtrend and projecting a move back to 2.15%. We’ll take a look at these very important charts for financial markets and for the global economic outlook tomorrow.
These key markets are signaling what could be the beginning of a big shift in sentiment and the beginning of positive surprises in markets and economies, which tends to happen when expectations have been ratcheted down so dramatically, as we discussed yesterday with the sour earnings outlook and pessimistic economic backdrop.
This is the perfect time to join us in our Billionaire’s Portfolio. We have just added the billionaire’s macro trade of the year to our Billionaire’s Portfolio — a portfolio of deep value stocks owned by the best billionaire investors in the world. You can join us here.