Stocks reversed after a hot opening today. With a quiet data week ahead, the focus is on the prospects of a government shutdown.
If this sounds familiar to you, it should. Government debt is the, often played, go-to political football.
It was only last month that we were facing a similar threat. But with some policy-making tailwinds on one side of the aisle, the fight was politically less palatable in December. With that, Congress passed a temporary funding bill to kick the can to this month.
And just three months prior to that, in September, we had the same showdown, same result. The “government shutdown” card was being played aggressively until the hurricanes rolled through. From that point, politicians had major political risk in trying to fight hurricane aid. They kicked the can to December to approve that funding.
Now, the Democrats feel like they have some leverage, and their using the threat of a government shutdown to make gains on their policy agenda. So, how concerned should we be about a government shutdown (which could come on Friday)? Would it derail stocks?
If you recall, there was a lot of fuss and draconian warnings about an impending government shutdown back in 2013. The government was shutdown for 16 days. Stocks went up about 2%. Before that was 1995-1996 (stocks were flat), and 1990 (stocks were flat).
For help building a high potential portfolio, follow me in our Billionaire’s Portfolio subscription service, where you look over my shoulder as I follow the world’s best investors into their best stocks. Our portfolio of highest conviction, billionaire-owned stocks is up close to 50% over the past two years. You can join me here and get positioned for a big 2018.
Stocks have now opened the year up 4%. Global interest rates are on the move, with the U.S. 2-year Treasury trading above 2% for the first time since 2008. Oil is trading in the mid $60s. And base metals are trading toward the highest levels of the young, two-year bull market in commodities.
This all looks like a market that’s beginning to confirm a real, sustainable economic recovery – anticipating much better growth than what we’ve experienced over the past decade.
If that’s the case, we should expect a big adjustment coming in inflation readings. And with that, we should expect a big adjustment coming for global interest rates. We’ll likely have a 10-year yield with a “3” in front of it before long. And that will have a meaningful impact on key consumer borrowing rates (especially mortgages).
On the inflation note, we’ve talked this week about the impact of higher oil prices on inflation and the impact it may have on the path of central bank policies (most importantly, the speed at which QE may be coming to an end in Europe and Japan).
You can see in this chart, the very tight relationship of oil prices and inflation expectations.
Now remember, one of the best research-driven commodities investors (Leigh Goehring) thinks we may see triple-digit oil prices — this year! This has been a very contrarian viewpoint, but beginning to look more and more likely. He predicted a surge in global oil demand (which has happened) and a drawdown on supplies (which has been happening at “the fastest rate ever experienced”). He says, with the OPEC production cuts (from November 2016), we’re “traveling down the same road” as 2006, which drove oil prices to $147 barrel by 2008.
Bottom line, this is an inflationary tale. If we had to search for a market that might be telling us this story (i.e. inflation is finally leaving the station), the first place people might look is the price of gold. What has gold been doing? It has been on a tear. Gold is up 8.3% over the past month.
For help building a high potential portfolio, follow me in our Billionaire’s Portfolio subscription service, where you look over my shoulder as I follow the world’s best investors into their best stocks. Our portfolio of highest conviction, billionaire-owned stocks is up close to 50% over the past two years. You can join me here and get positioned for a big 2018.
After some broad selling across markets yesterday, stocks bounced back today. With that, you might expect interest rates to push up and commodities to be rising too. That was not the case, which continues the trend of the past week (or so) of odd market behavior.
About a tenth of the strength in the S&P 500 can be attributed to Wal-Mart. Wal-Mart had a big earnings beat today with the best sales growth since before the financial crisis.
With that, let’s take a look at how Amazon’s war on traditional retail has affected Wal-Mart.
It wasn’t long ago that Wal-Mart was the biggest company in the world. It topped the Fortune 500 list from 2002 through 2005, and then again in 2007 (with a more than $300 billion market cap). At that time, Amazon was a $25 billion company. And then the financial crisis hit. Wal Mart was almost put out of business because of the global credit freeze. And then we had massive intervention to get credit moving again and to save the economy. With that intervention came a massive fiscal stimulus package. A huge chunk of it flooded into Silicon Valley (pension money followed it).
And, since then, although Amazon was a decade old company at the time, Amazon has had a trajectory similar to the other big tech giants of today. It’s more than 20 times as big today.
For perspective, in 2006, Wal-Mart was a $315 billion company. Today, the U.S. economy is 34% bigger than it was in 2006 (about $5 trillion bigger). And Wal-Mart is 15% smaller than it was in 2006 (at a market cap of $268 billion).
But Wal-Mart has finally started fighting for its life.
They bought a controlling stake in JD.com in the middle of last year to access the growing middle class in China. JD.com is the number two e-commerce site in China, but is rapidly closing the gap between itself and Alibaba (number 1). And JD has competitive advantages over Alibaba, in that, like Amazon, it owns its distribution centers and has control over quality (unlike an ebay and Alibaba). They’ve since upped the stake to 20% and may ultimately buy all of it. And Wal-Mart bought the startup Jet.com in the U.S. in August of last year. If they continue to win share in China through JD.com, this gap between Amazon and Wal-Mart may begin to start closing.
Join our Billionaire’s Portfolio today to get your portfolio in line with the most influential investors in the world, and hear more of my actionable political, economic and market analysis. Click here to learn more.
This trajectory for stocks was not an outcome that Wall Street was looking for.
I looked back at an article on market forecasts published by Fortune in December of last year. Here’s how they saw it…
So the group with access to the best information didn’t do a good job of interpreting that information. And you can see in the forecasts, they were pretty much in agreement. They were looking for just better than 2,300 for the year. They saw a +3.7% year for the S&P 500. They undershot by 12.2 percentage points thus far.
They should have listened to billionaire Larry Robbins. Remember, he did a study on the influence of low interest rates, Fed policy and oil on markets. He says every time ONE of these (following) conditions has existed, the market has produced positive returns.
When the 30-year bond yield begins the year below 4%, stocks go up 22.1%.
When investment grade bonds yield below 4%, stocks go up 16%.
When high-yield bonds yield below 8%, stocks go up 11.6%.
When cash as a percent of asset for non-financials is above 10%, stocks go up 17.6%.
When the Fed tightens 0-75 basis points in the year, stocks go up 22%.
When oil falls more than 20%, stocks go up 27.5%.
All of these conditions have been met this year. And stocks are up 16% with about seven weeks remaining in the year.
Add to this, the idea that a regime shift was underway, moving from a QE-driven economy, to an economy to be driven by structural reform and fiscal stimulus (under the incoming Trump administration this year), should have bumped up even the most conservative of forecasts on stocks for the year. With the economy still performing under potential, yet with the momentum of low interest rates, cheap gas, low unemployment and solid balance sheets, the pieces have been in place for a pop in growth. The idea of feeding fiscal stimulus into that mix should have had Wall Street forecasting the rise of all asset prices. They didn’t see it coming.
Join our Billionaire’s Portfolio subscription service today to get your portfolio in line with the most influential investors in the world, and hear more of my actionable political, economic and market analysis. Click here to learn more.
All eyes continue to be on U.S. stocks. But the bigger opportunities are elsewhere.
Japanese stocks were up another 1.3% today. The Nikkei is up 20% since September 8th. Oil is up 26% over just about the same period.
We’ve talked about the case for oil to continue its run. And with oil at 2 1/2 year highs and closing in on $60 a barrel, I’ve said we should expect the inflation chatter to start picking up. For those that have been looking for a catalyst to get bonds finally moving (and continuing) lower, this could be it. The Fed will find it very hard to ignore the impact of higher oil prices.
Here’s a look at that oil/ rates relationship we looked at a few weeks ago. At 2.30% on the 10 year yield, we sit 100 basis points off of the all-time lows (of last year). And coincidentally, we have 100 basis points of post-QE tightening in the market. With the strength in oil of the past two weeks, the divergence should be narrowing. But it has widened.
But we have another 25 basis points of tightening coming next month. This, along with this chart above, would argue we should be on the way up to 2.65ish in the 10-year yield (i.e. rates higher, bond prices lower).
With the oil story in mind, here’s another interesting chart: natural gas.
Natural gas is closing on this big four-year trendline. This momentum needs to continue, to close the sector performance gap in stocks (in the graphic below).
The energy sector has made up about three percentage points of ground since we looked at this chart last month.
Join our Billionaire’s Portfolio subscription service today to get your portfolio in line with the most influential investors in the world, and hear more of my actionable political, economic and market analysis. Click here to learn more.
Over the past two weeks we’ve talked about the two big central bank events. The first was the ECB’s decision last week. As expected, they signaled they will be exiting QE. The second was the anticipated announcement of a new Fed chair. This is a high consequence decision.
I thought early on that the President would show Yellen the door, given that the rate hiking campaign she has been leading at the Fed poses a threat to choke off the impact of the big fiscal stimulus efforts that have been the hallmark of the Trump Presidency.
She stayed longer than I expected. But today we get her replacement: the current voting Fed governor Jerome Powell. Powell has voted with Yellen, along the way. So, it doesn’t appear to be a philosophical change and it doesn’t appear to be a person Trump can influence – but he offers the President party alignment.
I thought Neel Kashkari had postured perfectly to get the job. He has experience at the Treasury overseeing the TARP program through the ugliest period of the financial crisis. And he’s a newbie Fed governor, but one that has dissented on rate hikes and argued to wait for inflation to take hold before moving on rates (to ensure sustainability of the recovery). That view aligns much friendlier with the Trump administrations economic plan.
The Fed chair role was, arguably (unquestionably, to me), the most important role in the world under the Bernanke reign. Bernanke was the right guy, in the right place, at the right time. As a student of the Great Depression he led the Fed through decisions that pulled the world back from the edge of total collapse. At stages through the crisis, the Fed and Bernanke took a lot of heat – and a lot of it came from world leaders, and even global central banks. But had the Fed not swiftly acted to help foreign banks early on (that were frozen from the lack of access of U.S. dollars), the global financial system would have imploded.
Other central banks then underestimated the scale of the crisis and started hiking rates too early, in 2010 and 2011, which ultimately put them back in to recession (most notably, Europe). The Fed stayed put.
Over time, Bernanke’s Fed (and his aggressive QE) proved to be right, and ultimately provided the playbook for major central banks to follow.
Under the Yellen regime, the track record has been spotty, nearly killing the recovery last year, by continually telegraphing a much tighter credit environment ahead. But the policy course was bailed out by the election of a new President and administration that is hell-bent on pumping up the economy.
Now Powell takes over at a more critical juncture. The execution on fiscal stimulus is beginning to materialize, and we’ll get to see how he navigates it. Hopefully, he’ll let the economy run a little hot (chase inflation from behind), and not allow rates (or the perception of tighter credit) to kill the animal spirits that can accompany big tax cuts and government spending programs.
Join our Billionaire’s Portfolio subscription service today to get your portfolio in line with the most influential investors in the world, and hear more of my actionable political, economic and market analysis. Click here to learn more.
As I said on Friday, people continue to look for what could bust the economy from here, and are missing out on what looks like the early stages of a boom.
We constantly hear about how the fundamentals don’t support the move in stocks. Yet, we’ve looked at plenty of fundamental reasons to believe that view (the gloom view) just doesn’t match the facts.
Remember, the two primary sources that carry the megahorn to feed the public’s appetite for market information both live in economic depression, relative to the pre-crisis days. That’s 1) traditional media, and 2) Wall Street.
As we know, the traditional media business, has been made more and more obsolete. And both the media, and Wall Street, continue to suffer from what I call “bubble bias.” Not the bubble of excess, but the bubble surrounding them that prevents them from understanding the real world and the real economy.
As I’ve said before, the Wall Street bubble for a very long time was a fat and happy one. But the for the past ten years, they came to the realization that Wall Street cash cow wasn’t going to return to the glory days. And their buddies weren’t getting their jobs back. And they’ve had market and economic crash goggles on ever since. Every data point they look at, every news item they see, every chart they study, seems to be viewed through the lens of “crash goggles.” Their bubble has been and continues to be dark.
Also, when we hear all of the messaging, we have to remember that many of the “veterans” on the trading and the news desks have no career or real-world experience prior to the great recession. Those in the low to mid 30s onlyknow the horrors of the financial crisis and the global central bank sponsored economic world that we continue to live in today. What is viewed as a black swan event for the average person, is viewed as a high probability event for them. And why shouldn’t it? They’ve seen the near collapse of the global economy and all of the calamity that has followed. Everything else looks quite possible!
Still, as I’ve said, if you awoke today from a decade-long slumber, and I told you that unemployment was under 5%, inflation was ultra-low, gas was $2.60, mortgage rates were under 4%, you could finance a new car for 2% and the stock market was at record highs, you would probably say, 1) that makes sense (for stocks), and 2) things must be going really well! Add to that, what we discussed on Friday: household net worth is at record highs, credit growth is at record highs and credit worthiness is at record highs.
We had nearly all of the same conditions a year ago. And I wrote precisely the same thing in one of my August Pro Perspective pieces. Stocks are up 17% since.
And now we can add to this mix: We have fiscal stimulus, which I think (for the reasons we’ve discussed over past weeks) is coming closer to fruition.
Join our Billionaire’s Portfolio today to get your portfolio in line with the most influential investors in the world, and hear more of my actionable political, economic and market analysis. Click here to learn more.
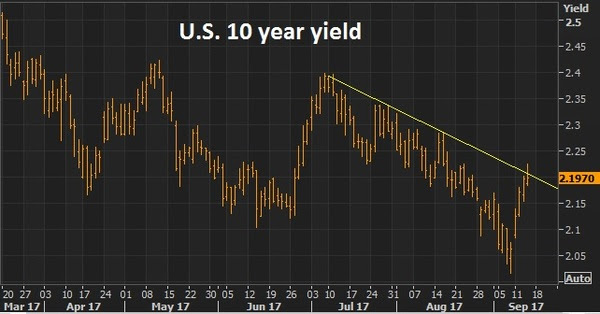
Yesterday we looked at the charts on oil and the U.S. 10 year yield. Both were looking poised to breakout of a technical downtrend. And both did so today.
Here’s an updated look at oil today.
And here’s a look at yields.
We talked yesterday about the improving prospects that we will get some policy execution on the Trumponomics front (i.e. fiscal stimulus), which would lift the economy and start driving some wage pressure and ultimately inflation (something unlimited global QE has been unable to do).
No surprise, the two most disconnected markets in recent months (oil and interest rates) have been the early movers in recent days, making up ground on the divergence that has developed with other asset classes.
Now, oil will be the big one to watch. Yields have a lot to do, right now, with where oil goes.
Though the central banks like to say they look at inflation excluding food and energy, they’re behavior doesn’t support it. Oil does indeed play a big role in the inflation outlook – because it plays a huge role in financial stability, the credit markets and the health of the banking system. Remember, in the oil price bust last year the Fed had to reverse course on its tightening plan and other major central banks coordinated to come to the rescue with easing measures to fend off the threat of cheap oil (which was quickly creating risk of another financial crisis as an entire shale industry was lining up for defaults, as were oil producing countries with heavy oil dependencies).
So, if oil can sustain above the $50 level, watch for the inflation chatter to begin picking up. And the rate hike chatter to begin picking up (not just with the Fed, but with the BOE and ECB). Higher oil prices will only increase this divergence in the chart below, making the interest rate market a strong candidate for a big move.
Join our Billionaire’s Portfolio today to get your portfolio in line with the most influential investors in the world, and hear more of my actionable political, economic and market analysis. Click here to learn more.
Stocks finished the week on record highs. We talked earlier in the week about Trump’s meeting with Japan’s Prime Minister and his economic and finance advisors.
I suspect that Trump will come away, after a weekend in Palm Beach with Abe, learning that Abenomics is good for the U.S., and good global growth and stability (in the current global economic environment).
And one of the keys to success in Abenomics is a weaker yen, which translates to a stronger dollar. As I’ve said, the weak yen has been pulled into the fray with Trump’s tough talk on trade imbalances, but his beef on currency advantage is really directed toward China – not Japan, not Mexico, not even Europe.
With that, and with the assumption that the yen may be pardoned for a while, the dollar bouncing against the yen as we head into the weekend. And it looks like we may see a technical breakout and an even higher dollar, lower yen in our future.
And Japanese stocks look set to break out too, to catch up to the strength of U.S. stocks. The Nikkei is 8% off of the 2015 highs, while U.S. stocks are on record highs, and 8% ABOVE its 2015 highs.
Another catch up trade: German stocks. Despite the growing attention given to the French nationalist candidate, Le Pen, who has been anti-euro and anti-European Union, right or wrong the bond market isn’t showing any new interest in disaster insurance in Europe, nor is the euro.
With that, German stocks look very good, still about 8% from the 2015 highs, and the technical correction clearly ended last summer.
Lastly, let’s take a look at another big sleeper stock market, China…
You can see how Copper is on a big run (up 10% ytd). That typically correlates well with expectations of global growth. Global growth is typically good for China. Of course, China is in the crosshairs of Trump’s fair trade movement, but if you think there’s a chance that more fair trade terms can be a win for the U.S. and a win for China, then Chinese stocks are a bargain here.
Have a great weekend!
For help building a high potential portfolio for 2017, follow me in our Billionaire’s Portfolio, where you look over my shoulder as I follow the world’s best investors into their best stocks. Our portfolio more than doubled the return of the S&P 500 in 2016. You can join me here and get positioned for a big 2017.
President Trump officially took office today. From the close of business on November 8th, as people across the country were still voting, the S&P 500 has climbed 6% – from election night through today. The dollar index has risen 2.8. The broad commodities index is up 6%. The 10 year Treasury note is down 4% — which means the yield is UP from 1.80% to about 2.50%.
His policy agenda has clearly been a game changer.
But if you recall, the broad sentiment going into the election was that a Trump Presidency would cause a stock market crash. These were people that weren’t calibrating the meaningful shift in sentiment that came from projecting pro-growth policies in a world that has been starved for growth. That event (the election) alone did more to cure the global deflation risk than the trillions of dollars that central banks have been pouring into the global economy.
But many still aren’t buying it. I don’t often read financial news. I’d rather look at the primary sources (the data or hear from the actors themselves/ the horse’s mouth) and interpret for myself. But today, I had a look across the web. Four of the five top headlines on a major financial news site, on inauguration day, ranged from negative to doom-and-gloom — all laying blame on the dangers of Trump.
Because Trump has talked tough on trade, the common threat most refer to is a potential trade war. But remember, Trump has also talked tough on U.S. companies moving jobs overseas. Thus far, he hasn’t created enemies, he’s gotten concessions and has created allies. He’s used leverage, and he’s negotiated win-wins. Expect him to do the same with trade partners. With pro-growth policies coming down the pike and a meaningful pop in U.S. economic growth coming, no country, especially in the current state of the global economy, will want to be locked out of trade with the United States.
For help building a high potential portfolio, follow me in our Billionaire’s Portfolio, where you look over my shoulder as I follow the world’s best investors into their best stocks. Our portfolio more than doubled the return of the S&P 500 in 2016. You can join me here and get positioned for a big 2017.


 After some broad selling across markets yesterday, stocks bounced back today. With that, you might expect interest rates to push up and commodities to be rising too. That was not the case, which continues the trend of the past week (or so) of odd market behavior.

 All eyes continue to be on U.S. stocks. But the bigger opportunities are elsewhere.


 As I said
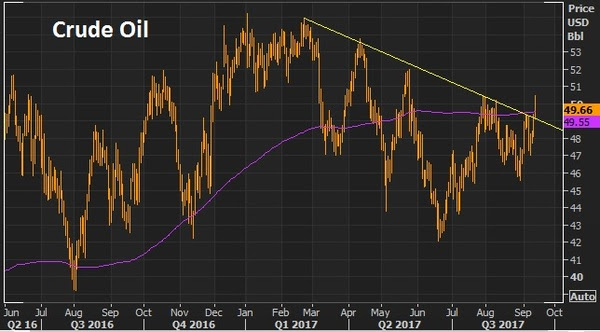

 Stocks finished the week on record highs. We talked earlier in the week about Trump’s meeting with Japan’s Prime Minister and his economic and finance advisors.


