April 17, 5:00 pm EST

Last month we talked about Chinese stocks has a key spot to watch for: 1) are they doing enough to stimulate the struggling economy, and 2) (more importantly) are they taking serious steps to get to an agreement on trade with the U.S.?

The signal has been good.  Chinese stocks are up 34% since January 4th.

As I said back in March, Chinese stocks are reflecting optimism that a bottom is in for the trade war and for Chinese economic fragility.  That’s a big signal for the global (and U.S.) economy.

Fast forward a month, and we’re starting to see it (the bottoming) in the Chinese data.  Overnight, we had a better than expected GDP report.  And industrial output in China climbed at the hottest rate since 2014.

For those that question the integrity of the Chinese GDP data, many will look at industrial output and retail sales.  Retail sales had a better than expected number too overnight.  And the chart (too) looks like a bottom is in. 

Remember, by the end of last year, much of the economic data in China was running at or worse than 2009 levels (the depths of the global economic crisis).

The signal in stocks turned on the day that the Fed put an end to its rate hiking path AND when the U.S. and China re-opened trade talks (both on January 4th).

April 9, 5:00 pm EST

A key piece in the continuation of the global economic recovery will be a weaker dollar.  It will drive a more balanced U.S. and global economy, and it will reflect strength in emerging markets (i.e. capital flows to emerging markets).

To this point, as we’ve discussed, higher U.S. rates have meant a stronger dollar.  With global central banks moving in opposite directions in recent years, capital has flowed to the United States.  But the emerging markets have suffered under this dynamic.  As money has moved OUT of emerging market economies, their economies have weakened, their currencies have weakened, and their foreign currency denominated debt has increased.

But now we have a retrenchment from the Fed.  And we have coordinated global monetary policy (facing in the same direction).

This sets up to solidify a long-term bear market for the dollar.

Let’s take a look at a couple of charts that argue the long-term trend is already lower, and the next leg will be much lower.

First, here’s a revisit of the long-term dollar cycles, which we’ve looked at quite a bit in this daily note.

Since the failure of the Bretton-Woods system, the dollar has traded in six distinct cycles – spanning 7.6 years on average.  Based on the performance and duration of past cycles, the bull cycle is over, and the bear cycle is more than two years in.

With this in mind, if we look within this current bear cycle, technically the dollar is trading into a major resistance area – a 61.8% retracement.  The next leg should be lower, and for a long period of time. 

Trump wants a weaker dollar, and I suspect he’s going to get it.

Sign up to my Billionaire’s Portfolio and get my market beating Billionaires Portfolio … Live Portfolio Review conference calls … Weekly notes with updates and specific recommendations on following the best billionaire investors …  Access to my member’s only area on the Billionaire’s Portfolio.  Plus, my blog — full of information that will set you apart from other average investors.

Join now and get your risk free access by signing up here.

February 13, 5:00 pm EST

Over the past couple of days we’ve looked at some key technical levels for stocks, as we continue this V-shaped recovery from the deep decline of December.

We now sit just a percent and a half off of the December 3rd highs. And today, we get a break and a close above the 200-day moving average in the S&P 500.

So, with all of the doom and gloom scenarios we heard as we entered 2019, a month later and we’ve nearly fully recovered the losses of December.  And with expectations on earnings  and growth all ratcheted down now for the year, we have a lot of fuel for much higher stocks.

As U.S. stocks go, so do global stocks.  We looked at the chart on Japanese stocks yesterday.  We did indeed get a big technical break overnight of the correction downtrend that started in October of last year.

So, today we have this chart … 

With much of the concern on global growth directed squarely in China, this chart of Chinese stocks is signaling that perhaps Chinese growth is bottoming, and maybe because a U.S./China deal is coming.  

In this chart above, you can see this bear market in Chinese stocks last year was started in January.  That was when Trump rhetoric on a China trade war turned into action.  He slapped tariffs on washing machines and solar panels (a signal of bark and bite).  Now we have a bottom, as of last month, and a big technical break of the downtrend, arguably leading the patterns we’re seeing in U.S. and Japanese stocks.  For how you can play it:  Here are some ETFs that track Chinese stocks.

Join me here to get my curated portfolio of 20 stocks that I think can do multiples of what broader stocks do, coming out of this market correction environment.

January 31, 5:00 pm EST

With the Fed officially on hold, asset prices continue to lift-off.  But with U.S./China talks concluding today, there was the potential for a spoiler.

Trump quickly stepped in front of that risk this morning, saying that no final deal would be made until he and President Xi meet “in the very near future.”

So the expectations of a final “yea or nay” on a China deal today were managed down. And with that, the recovery in global markets finished the month of January on a strong note.

What a difference a month makes.  In December, people were beginning to worry that collapsing global financial markets would kill the global economic recovery — and maybe fuel another financial crisis.  A month later, and the S&P 500 sits just 2% lower than the close of November (before the December rout).  And in January, almost every market is in the green (from stocks to bonds to commodities to currencies).


Remember, if we compare this to last year, cash was the best performing major asset class (returning just less than 2% in dollar terms).

On Friday, we talked about the set up for a big run in commodities this year.  Commodities continue to lead the way.  Crude is up close to 20%on the month.  Copper is up 6% for January (the commodity known to be a early indicator of turning points in the economy), and gold is up 3.5% just in the past week.

We also end the month with another very solid opening to earnings season.  Despite all of the pessimism of the past quarter. The Q4 earnings continue to beat expectations.  Importantly, the widely held tech giants have posted good reports: Facebook, Apple and Amazon.

Importantly, with the expectations bar set low coming into 2019 (for earnings, the economy and a China deal), I’d say we finish the first month of the year in position to exceed expectations on those fronts – thanks, in no small part, to the pivot by the Fed.
Join me here to get my curated portfolio of 20 stocks that I think can do multiples of what broader stocks do, coming out of this market correction environment.

September 26, 5:00 pm EST

The Fed moved again today on rates, as the market expected. This is the eighth quarter point hike in this post-QE normalization on rates. And this now puts the Fed Funds rate at the range of 2%-2.25%.

Now, the markets will pick apart the statement and endlessly parse the Fed Chair’s words in the press conference. But let’s step back and take a look at the impact of these Fed hikes thus far.

We know the economy is running at the best pace since before the financial crisis. We know that the jobless rate is near record lows. We know that consumer credit worthiness is at record levels. This has all happened, despite the Fed’s rate hikes.

What about debt service coverage? As rates are moving higher, are consumers showing signs of getting squeezed?

If we look back at the height of the credit bubble in 2008 (just prior to its burst), 13.22% of household income was going to service debt–within that number, 7.2% of household income was going to service mortgage debt. What about now? Debt service is now 10.2% of household income. And the mortgage piece is down to just 4.4%. This is the result of six years of zero interest rates, a massive QE program (which included the Fed’s purchase of mortgage bonds), and a government program that subsidized banks to refi high interest rate mortgages.

So the big question is, how has the Fed’s exit of QE effected the consumers ability to service debt? Are higher rates hurting?

Well, they started hiking rates in the fourth quarter of 2015. Total debt service at that time was 10.1%. That’s virtually unchanged from today. And the mortgage piece was 4.5%. That’s actually a touch higher than today.

Bottom line: The Fed’s normalization on rates has not damaged the consumer, nor has it killed the housing market.

But that’s only because the yield curve has been flattening. That is, longer term market interest rates have been steady. That means the benchmark rate from which consumer and mortgage rates have been set, has been steady. And those longer term rates have been steady, in large part, because Europe and Japan have remained in QE mode (buying global assets, which includes our Treasurys).

With that, while most have been watching the Fed closely for how it’s delicately handling the exit of QE, the more important spot to watch will be how Europe and Japan manage their exits. Hopefully, the U.S. economy is hot enough, at that point, to withstand the move in longer term U.S. rates that will come with the end of global QE.

If you haven’t joined the Billionaire’s Portfolio, where you can look over my shoulder and follow my hand selected 20-stock portfolio of the best billionaire owned and influenced stocks, you can join me here.

September 18, 5:00 pm EST

Yesterday Trump made good on his promise by announcing another $200 billion in tariffs on China.

To the surprise of many, stocks went up. Why?

Perhaps it’s because reforming the way the world deals with China is a good thing.  Remember, China’s currency manipulation over the past two decades led to the credit bubble, which ultimately led to the financial crisis. And as long as the rest of the world continues to allow China to maintain a trade advantage (dictated by their currency manipulation): 1) they will manufacture hot economic growth through exports, 2) the global cycle of booms and bust will continue, and 3) the wealth transfer from the rest of the world to China will continue.

With this in mind, as I’ve said, the trade dispute is all about China – everything else Trump has taken on (Canada, Mexico, Europe) has been to gain leverage on getting movement in China.

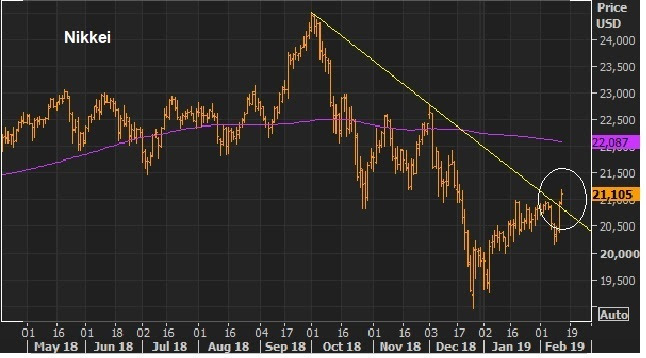
With Trump now making it very clear that he won’t back down until major structural change takes place in China, it’s no surprise that one of the biggest winners of the day (following the further economic sanctions on China) was Japan!

The Nikkei was up big today.  And it was Japanese stocks that set the tone for global markets on the day.  As a signal that China’s days of cornering the world’s export markets may be coming to an end, Japan is in position to be a big winner.

Remember, while much of the world has returned to new record highs following the global financial crisis, Japan remains 40% away from the record highs set nearly 30 years ago.

If you haven’t joined the Billionaire’s Portfolio, where you can look over my shoulder and follow my hand selected 20-stock portfolio of the best billionaire owned and influenced stocks, you can join me here.

August 16, 5:00 pm EST

On Tuesday, we looked at the similarities between the recent currency collapse in Turkey, and the 2014 collapse of the Russian ruble.

And we looked at this chart of how the S&P 500 behaved back in 2014.

The S&P 500 is the proxy on global market stability.  And stocks were shaken on Russia back in 2014.  When the ruble collapsed, U.S. stocks lost 5% of its value in just 7 days.

But the decline was fully recovered in just 3 days.

Given the similarities of these two currency crises (a currency attack on a bad behaving leader), I thought we might see the same behavior in stocks this time.  And that’s what we appear to be getting – a shallower decline but a swift recovery.

So, why the quick recovery?

As we also discussed on Tuesday, while the Turkish lira has been the center of attention in the financial media, the real reason global markets were shaking had more to do with China.

If a currency crisis that started in Turkey ended in China, there would be big geopolitical fallout.

As we’ve discussed over the past month, the biggest risk from China is a big one-off devaluation. That would stir up a response from other big trading partners (i.e. Europe and Japan), where they would likely coordinate to block trade from China all together. That’s where things would get very ugly and likely (ultimately) culminate in a military war.

But the probability of that outcome was reduced yesterday.  We had news that a China delegation would travel to the U.S. to re-open trade negotiations.  They’re coming back to the table.

So we should expect concessions from China. That’s good news for the globlal economy and for global stability.  And that news drove the big bounce in stocks yesterday, which continued today.   I suspect this will be the catalyst to get stocks back on the path toward a double-digit gains by year-end.

If you haven’t joined the Billionaire’s Portfolio, where you can look over my shoulder and follow my hand selected 20-stock portfolio of the best billionaire owned and influenced stocks, you can join me here.

August 14, 5:00 pm EST

We talked yesterday about the sharp currency devaluation in Turkey over the past few days. The Lira bounced aggressively today, which soothes some fears in global markets.

As I said, many have made comparisons to the Asian currency crisis of the late 90s, and have speculated on the potential for the events in Turkey to ultimately destabilize global markets.  But as we discussed yesterday, this looks more like the 2014 currency attack on the Russian ruble — a geopolitically-driven crippling of an economy with bad behaving leadership.

With that in mind, here’s what happened to U.S. stocks back in 2014, when the ruble lost 5% of its value (vs the dollar) in just 7 days.  But the decline was fully recovered in just 3 days.

U.S. stocks have been the proxy for global market stability throughout the past decade (the crisis and post-crisis era).  So, for perspective on just how shaky the Turkey influence is being perceived, the S&P 500 sits just one percent off of all-time highs at today’s close.

Remember, the ECB stands ready to plug any holes necessary in European bank exposure to Turkish debt.  That euro-denominated debt has been the risk people immediately homed in on.

The real question is, will this (currency crisis) ultimately end in China, with a revaluation of the yuan, or perhaps a free-floating yuan?  

If you haven’t joined the Billionaire’s Portfolio, where you can look over my shoulder and follow my hand selected 20-stock portfolio of the best billionaire owned and influenced stocks, you can join me here.

August 13, 5:00 pm EST

We have a currency devaluation in Turkey that is shaking up markets.  Let’s talk about what’s happening and why (if at all) it matters for the big picture outlook.

First, here’s a look at the Turkish lira chart (orange line moving up means a stronger U.S. dollar, weaker lira)…


Now, the problems in Turkey aren’t new.  The country is economically fragile.  But the collapse in the currency probably has more to do with its leadership – and the erosion of democracy in Turkey.

There are a lot of people comparing Turkey’s currency crisis to the Thai Baht devaluation in 1997 — which ultimately ignited a currency crisis in Asia, which culminated in a sovereign default in Russia.  That’s the fear: a currency crisis turning into a contagion of sovereign debt defaults.

But Thailand was about economic policy – specifically, the Thai currency policy.  Speculators attacked to close the valuation gap between the central bank managed currency and its economy.

This Turkey issue looks more like the collapse in the Russian Ruble in late 2014.  That was geopolitically driven.  Back in 2014, Putin was forcing his way into Ukraine – an affront to the Western world.  This was viewed as a proxy war against the West. That led to capital flight out of Russia and speculative attack on the currency.

With this chart on the Ruble (the orange line going up means a stronger dollar and weaker ruble), Russia was quickly made vulnerable and on a sovereign debt default watch.

But like Turkey, the contagion risk was driven by Russia’s foreign currency denominated debt (primarily euro denominated debt owed to European banks).

With that said, the world wasn’t “normal” in 2014, nor is it now.  Remember, the European Central Bank remains in quantitative easing mode.  That means, we should expect central bank (or policy) intervention (if needed) to quell any shock risks that could come from European bank exposure to Turkish debt.  So the ECB’s “ready to act” commitment of the post-financial crisis era should calm fears of contagion.

As for Turkey, the crippling effects of the currency attack should put pressure on the freshly re-elected Ergodan (i.e. should make him vulnerable to an uprising).

If you haven’t joined the Billionaire’s Portfolio, where you can look over my shoulder and follow my hand selected 20-stock portfolio of the best billionaire owned and influenced stocks, you can join me here.

January 25, 7:00 pm EST

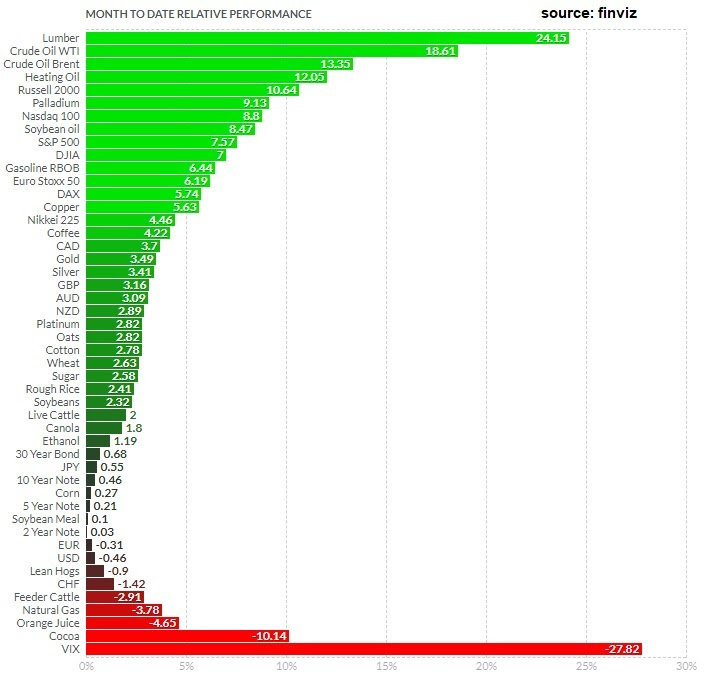
Yesterday we talked about the commodities bull market and the move underway in natural gas.

That all continued today, thanks in part to a comment by the U.S. Treasury Secretary, saying “obviously a weaker dollar is good for us.”  When the dollar goes down, commodities prices tend to go up, since they are largely priced in dollars.  As such, commodities were the top performers of the day – beginning to gain more momentum at multi-year highs.

But as we’ve seen from this chart, this recovery in commodities, which has dramatically lagged in the reflation trade, has a long way to go.

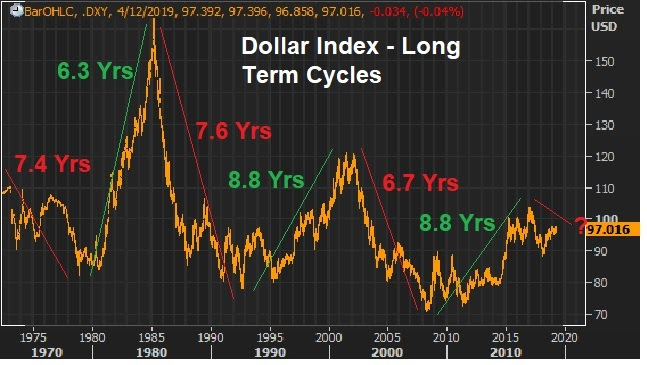
While the markets reacted as if Mnuchin, the Treasury Secretary, was talking down the dollar, the dollar is already in a long-term bear market cycle.

Remember, we looked at this chart (below) of the long-term dollar cycles back in June…

And I said, “if we mark the top of the most recent cycle in early January, this bull cycle has matched the longest cycle in duration (at 8.8 years) and comes in just shy of the long-term average performance of the five complete cycles.  The most recent bull cycle added 47%. The average change over a long-term cycle has been 56%.  This all argues that the dollar bull cycle is over.  And a weaker dollar is ahead.  That should go over very well with the Trump administration.”

The dollar is down about 8% since then and is breaking down technically now.

The dollar index is now down 14% in this new bear cycle. And these are the early innings.  Based on the dollar cycle, it has a long way to go, and should last for another 5 to 7 years.

So, this dollar outlook is further support for the case for a big run in commodities we’ve been discussing.  And as we observed yesterday, in the case of Chesapeake Energy (CHK), the second largest producer of natural gas in the country, the commodities stocks are still extremely underpriced if this scenario for commodities plays out.

For help building a high potential portfolio, follow me in our Billionaire’s Portfolio subscription service, where you look over my shoulder as I follow the world’s best investors into their best stocks.  Our portfolio of highest conviction, billionaire-owned stocks is up close to 50% over the past two years.  You can join me here and get positioned for a big 2018.