Since the election, almost a year ago, we’ve talked about the great passing of the torch, from a monetary policy-driven global economic recovery (which proved dangerously weak and shallow) to a fiscal stimulus-driven recovery (which finally gives us a chance to return to trend growth).
Now, almost a year in, policy execution on the fiscal stimulus front is moving. The Fed has hiked rates three times. In the past week, the ECB has signaled the end of QE in Europe is coming. And this Thursday the Bank of England is expected to raise rates for the first time in a decade.
Again, if you can block out the day-to-day noise, this is all confirming the exit of the post-crisis deleveraging era of the past decade – it’s all playing out fairly close to script.
With that, I want to revisit my note from early January of this year, which argues the case for this “passing of the torch” and emphasizes the value of having some bigger picture perspective…
From my Market Perspectives piece: JANUARY 18, 2017
“Two weeks ago, in my daily Market Perspectives note, I talked about the five reasons, even at Dow 20,000, that stocks look extraordinarily cheap as we head into 2017.
Today I want to talk a bit more about the idea that the timing is right for a pop in economic growth.
For the past ten years, we’ve heard experts pontificate about ‘what inning we’re in,’ during the crisis era. I think there are good reasons to believe the game is over, and it was ended on election night–that was the catalyst.The policy responses and regime shift have more to do with the evolution of the global financial crisis and human psychology, than it does with the character behind it all.
I want to focus on a study from Carmen Reinhart and Kenneth Rogoff – the two economists that laid out the script, back in 2008, for precisely what the world has experienced over the past ten years. Fortunately, Bernanke was a believer in it. That’s why the Fed kept its foot on the gas, even in the face of a lot of scrutiny from people that blamed the Fed on extending the crisis.
Reinhart and Rogoff studied eight centuries of financial crises and they found striking commonalities in the aftermath. They found that financial crises tend to lead to sovereign debt crises. And sovereign debt crises tend to be contagious. Clearly, we’ve seen it.
Reinhart went on to look at the 15 severe financial crises since World War II and found that they were typically driven by credit bubbles. Check.
Importantly, they found that the credit bubble typically took as long to unwind (or de-lever) as it took to build. And the deleveraging period tends to mean ultra-slow economic activity as consumers, businesses and governments are paying down debt, not spending. And because of this, the research suggested that throughout this ten-year deleveraging period we should expect: 1) economic growth will trend at lower levels than pre-crisis growth, 2) housing prices will remain anywhere from 20% to 50% below peak levels and 3) unemployment will hover around 5% higher than pre-crisis levels. Check, check and check.
In the current case, Reinhart and Rogoff said the credit bubble was built over about a decade. That means we all should all have expected a decade long deleveraging period.
Now, with that, you can mark the top in the bubble as the 2006 housing top, or in 2007 when we the first big mortgage company and Bear Stearns hedge fund failed, or 2008, when consumer credit peaked. We’re somewhere in the middle of this window now and major turning points in markets tend to come with significant events. It’s a fair argument to make that the Trump election was a significant event for the world. With that, we may find that the crisis period officially ended with the election, when the history books look back on this current period of time.’
So that was my take back in January. It’s not easy to watch the process play out. It can be slow and ugly. But we’re seeing the reaction in stocks to this thesis – now at 23k in the DJIA. And we’re getting some momentum building on the policy making side that further supports this structural turning point is here (or has been here).
Join our Billionaire’s Portfolio subscription service today to get your portfolio in line with the most influential investors in the world, and hear more of my actionable political, economic and market analysis. Click here to learn more.
After a week away, I return to markets that look very similar to where we left off 10 days ago. Stocks lower. Yields lower. The dollar lower. But commodities higher!
Now, this takes into account, another week of political volatility in Washington. It takes into account another week of uncertainty surrounding North Korea.
What’s important here, is distinguishing between a price correction and a real thematic change. If we’re not making new record highs in stocks every day, and stocks actually retrace 5% or so, does that represent the derailing of the slow but steady economic recovery and, as important, the dismissal of potential policy fuel that could finally lift us out of the post-crisis stall speed growth regime?
The narrative in the media would have you believe the answer is yes.
But the reality is, the economic recovery is stable and continuing. The policy stimulus has been a tough road, but continues to offer positive influence on the economy. And there are strong technical reasons to believe we’re seeing the early stages of a price driven correction in stocks.
Remember, we looked at the big technical reversal signal (the “outside day”) back on August 8th. That was the technical signal, and it was about as good a signal as it gets. The Dow had been plowing to new highs for eleven consecutive days — culminating in another new record high before. And the last good ‘outside day’ in the S&P 500 was into the rally that stalled December 2, 2015 and it resulted in a 14% correction.
Here’s another look at that chart, plus the first significant trend line that we discussed in my last note, August 11th.
I thought this line would give way, which it has today, and that we would see a real retracement, which should be a gift to buy stocks. If you’re not a highly leveraged hedge fund, a 5%-10% retracement in broader stocks is a gift to buy. Remember, the slope of the S&P 500 index over time is UP.
Prior to the reversal signal in stocks, we had already addressed the influence of the FAANG stocks. And I suggested the miss in Amazon earnings was a good enough excuse to cue the profit taking in what had been a very lucrative trade in the institutional investment community. Amazon is now down 12% from the highs of just 18 days ago.
What should give you confidence that the economic outlook isn’t souring? Commodities!
The base metals, as we’ve discussed in recent weeks, continue to move higher and continue to look like early stages of a bull market cycle — which would support the idea that the global economic recovery is not only on track, but maybe better than the consensus market view (which seems to be still unconvinced that better times are ahead).
The leader of the commodities run is copper. We looked at this chart in my last note (Aug 11). I said, “this big six-year trend line in copper (below) will be one to watch closely. If it breaks, it should lead the commodities trend higher.”
Here’s an updated chart of Copper. This trend line was broken today.
Join me in our Billionaire’s Portfolio and get my recommendation on a commodities stock with potential to be a six-fold winner in the commodities recovery. Click here to learn more.
Yesterday we talked about the Draghi remarks (head of the European Central Bank) that were intended to set expectations that the ECB might be moving toward the exit doors on QE and zero interest rate policy. That bottomed out global rates — which popped U.S. rates further today. The Bank of England piled on today, talking about rate normalization soon.
We’ve gone from 2.12% in the U.S. ten year yield to 2.25% in about 24 hours. These are big swings in the interest rate market – a big bounce and, as I’ve said, the bottom appears to be in for rates.
As importantly, this prepared speech by Draghi could very well cement the top in the dollar. It begins to tighten a very wide interest rate spread between the U.S. and global rates. We entered the year with the Fed going one way (tightening) while the rest of the world was going the other way (easing). That’s a recipe for capital to storm into U.S. assets — into the dollar. And now that may be over.
I’ve been researching long-term cycles in the dollar for a very long time and throughout the global financial crisis period, it these cycles in the world’s reserve currency have been my guidepost for drawing a lot of conclusions on markets and the outlook for capital flows over the past several years.
Despite the choppiness in the dollar for much of the crisis, if we look back at the cycles following the failure of the Bretton Woods system, we were able, very early on, to determine the dollar was in a bull cycle.
This view came in the face of all of the negative global sentiment toward the dollar in 2010. Foreign leaders were taking shots at the Fed, accusing the Fed of trying to destroy the dollar. People were calling for the end of the dollar as the world’s reserve currency. All the while, the dollar held firm and ultimately made an aggressive climb.
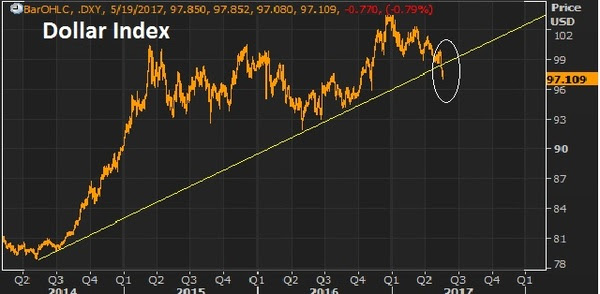
Take a look below at my chart on the long term dollar cycles…
I’ve watched this chart for quite some time, defining the five complete dollar cycles over the past nearly 40 years, and the most recent bull cycle.
If we mark the top of the most recent cycle in early January, this bull cycle has matched the longest cycle in duration (at 8.8 years) and comes in just shy of the long-term average performance of the five complete cycles. The most recent bull cycle added 47%. The average change over a long term cycle has been 56%. This all argues that the dollar bull cycle is over. And a weaker dollar is ahead. That should go over very well with the Trump administration.
Join the Billionaire’s Portfolioto hear more of my big picture analysis and get my hand-selected, diverse stock portfolio following the lead of the best activist investors in the world.
The past few days we’ve looked at the run up in bitcoin. Remember, I said: “If you own it, be careful. The last time the price of bitcoin ran wild, was 2013. It took about 11 days to triple, and about 18 days to give it all back. This time around, it’s taken two months to triple (as of today). ”
It looks to be fueled by speculation, and likely Chinese money finding its way out of China (beating capital controls). And yesterday we talked about the potential disruption to global markets that could come with a crash in bitcoin prices.
I suspect that’s why gold is finally beginning to move today, up almost 1%, and among the biggest movers of the day as we head into the long holiday weekend (an indication of some money moving to gold to hedge some shock risk).
Remember yesterday we looked at the chart on Chinese stocks back in 2015 and compared it to bitcoin. The speculative stock market frenzy back thin was pricked when the PBOC devalued the yuan later in the summer.
Probably no coincidence that bitcoin’s recent acceleration happened as Moody’s downgraded China’s credit rating this week for the first time since 1989 (an event to take note of). Yesterday, the PBOC was thought to be in buying Chinese stocks (another event to take note of). And this morning, the PBOC stepped in with another currency move! Historically, major turning points in markets tend to come with some form of intervention. Will a currency move be the catalyst to end the bitcoin run, as it did the runup in Chinese stocks two years ago?
Let’s take a look at what the currency move overnight means …
Keep in mind, the currency is China’s go-to tool for fixing problems. And they have problems. The economy is crawling around recession like territory. The debt was just downgraded. And they’ve had a tough time managing capital flight. As an easy indicator: Global stocks are soaring. Chinese stocks are dead (flat on the year).
Remember, their rapid economic ascent in the world came through exports (via a weak currency). The move overnight is a move back toward tying its currency more closely to the dollar. Which, if this next chart plays out, will also weaken the yuan compared to other big exporting competitors in the world.
That should help the Chinese economic outlook, which may help stem the capital flight (which has likely been a significant contributor to bitcoin’s rise).
We talked yesterday about run up in bitcoin. The price of bitcoin jumped another 14% today before falling back.
As I said yesterday, it looks like Chinese money is finding it’s way out of China (despite the capital controls) and finding a home in bitcoin (among other global assets). If you own it, be careful. The last time the price of bitcoin ran wild, was 2013. It took about 11 days to triple, and about 18 days to give it all back. This time around, it’s taken two months to triple (as of today).
If you’re looking for a warning signal on why it might not be sustainable (this bitcoin move), just look at the behavior across global markets. It’s not exactly an environment that would inspire confidence.
Gold is flat. Interest rates are soft. Stocks are constantly climbing. Commodities are quiet, except for oil — which fell back below $50 today on news that OPEC did indeed agree to extend its production cuts out to March of next year (bullish, though oil went south).
When the story is confusing, conviction levels go down, and cash levels go up (i.e. people de-risk). And maybe for good reason.
In looking at the bitcoin chart today, I thought back to the run up in Chinese stocks in early 2015. Here’s a look at the two charts side by side, possibly influenced by a lot of the same money.
The crash in Chinese stocks took global markets with it. It’s often hard to predict that catalyst that might prick a bubble and even harder to see the links that might lead to broader market instability. In this case, though, there are plenty of signs across markets that things are a little weird.
Invitation to my daily readers: Join my premium service members atBillionaire’s Portfolio to hear more of my big picture analysis and get my hand-selected, diverse stock portfolio where I follow the lead of the best activist investors in the world. Our goal is to do multiples of what broader stocks do. Our portfolio was up 27% in 2016. Join me today, risk-free. If for any reason you find it doesn’t suit you, just email me within 30-days.
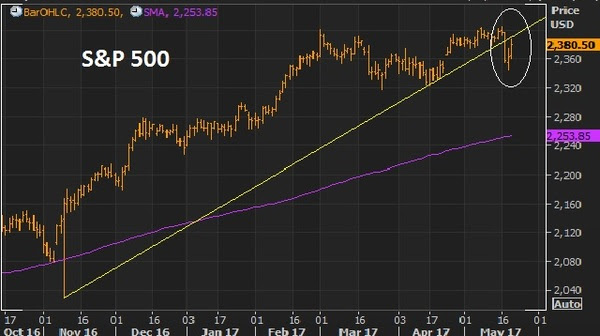
Stocks continue to bounce back today. But the technical breakdown of the Trump Trend on Wednesday
still looks intact. As I said on Wednesday, this looks like a technical correction in stocks (even considering today’s bounce), not a fundamental crisis-driven sell-off.
With that in mind, let’s take a look at the charts on key markets as we head into the weekend.
Here’s a look at the S&P 500 chart….
For technicians, this is a classic “break-comeback” … where the previous trendline support becomes resistance. That means today’s highs were a great spot to sell against, as it bumped up against this trendline.
Very much like the chart above, the dollar had a big trend break on Wednesday, and then aggressively reversed Thursday, only to follow through on the trend break to end the week, closing on the lows.
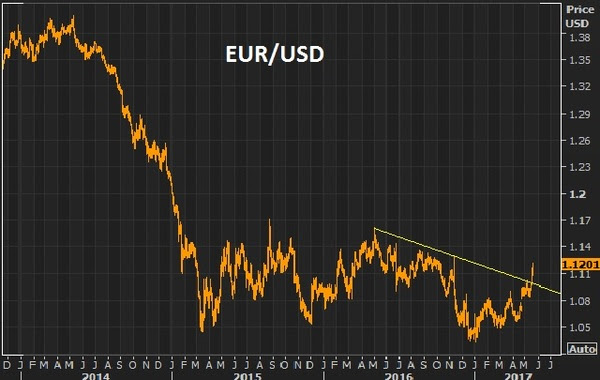
On that note, the biggest contributor to the weakness in the dollar index, is the strength in the euro (next chart).
The euro had everything including the kitchen sink thrown at it and it still could muster a run toward parity. If it can’t go lower with an onslaught of events that kept threatening the existence of the euro, then any sign of that clearing, it will go higher. With the French elections past, and optimism that U.S. growth initiatives will spur global growth (namely recovery in Europe), then the European Central Bank’s next move will likely be toward exit of QE and extraordinary monetary policies, not going deeper. With that, the euro looks like it can go much higher. That means a lower dollar. And it means, European stocks look like, maybe, the best buy in global stocks.
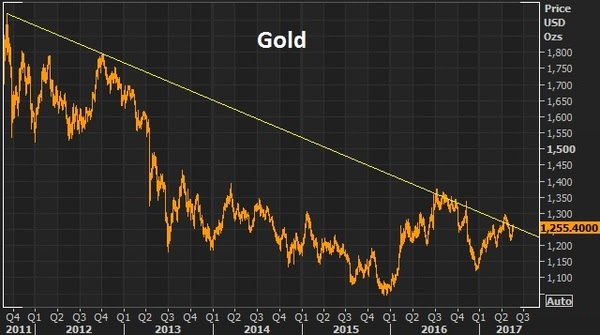
A lower dollar should be good for gold. As I’ve said, if Trump policies come to fruition, inflation could get a pop. And that’s bullish for gold. If Trump policies don’t come to fruition, the U.S. and global growth looks grim, as does the post-financial crisis recovery in general. That’s bullish for gold.
This big trendline in gold continues to look like a break is coming and higher gold prices are coming.
With all of the above, the most important chart of the week is probably this one …
The 10 year yield has come all the way back to 2.20%. The best reason to wish for a technical correction in stocks, is not to buy the dip (which is a good one), but so that the pressure comes out of the interest rate market (and off of the Fed). The run in the stock market has clearly had an effect on Fed policy. And the Fed has been walking rates up to a point that could choke off the existing economic recovery momentum and, worse, neutralize the impact of any fiscal stimulus to come. Stable, low rates are key to get the full punch out of pro-growth policies, given the 10 year economic malaise we’re coming out of.Invitation to my daily readers: Join my premium service members at Billionaire’s Portfolio to hear more of my big picture analysis and get my hand-selected, diverse portfolio of the most high potential stocks.
With the Fed’s third rate hike this week in the post-financial crisis era, let’s take a look at how market rates have reponded.
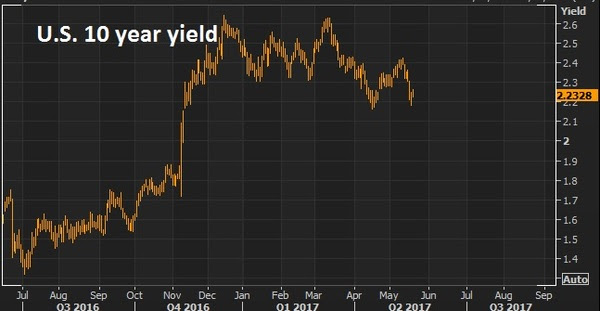
Here’s a chart of the U.S. 10 year government bond yield.
On December 16, 2015, the Fed moved for the first time. The 10-year traded up to 2.33% that day and didn’t see that level again for 11-months. Despite the fact that the Fed forecasted four hikes over the next twelve months, the bond market wasn’t buying it. A month later, the fall in oil prices turned into a crash. And the 10 year yield printed a new record low at 1.32%, just under the crisis lows.
On December 14, 2016, the Fed made the second move. This was after they had spent the better part of the last nine months walking back on what they thought would be their 2016 hiking campaign. The difference? Trump was elected the new President and he was already fueling confidence from talk of big, bold fiscal stimulus. The Fed’s big hiking campaign was placed back on the table. The high in yields the day the Fed made hike #2 was 2.58%. The next day it put in a top at 2.64% that we have not seen since.
And, of course, this past week, we’ve had hike #3. The 10 year yield traded up to 2.60% that day (Wednesday) and we haven’t seen it since, despite the fact that the Fed has continued to tell us another couple of hikes this year, and that the economy is doing well, expect about three hikes a year through 2018. Yields go out at 2.50% today.
So why aren’t market rates screaming? The 10 year yield should be 3.5%+ by now. And consumer rates should be surging. Is it the Bank of Japan, the European Central Bank and China buying our Treasuries, keeping a cap on yields? Is it that the market doesn’t believe it and thus the yield curve is flattening (which would project recession)? Probably a bit of both. The important point is that the Fed absolutely cannot do what they are doing if they think they will push the 10 year yield up to 3.5%+, and fast.
In our Billionaire’s Portfolio, we’re positioned in a portfolio of deep value stocks that all have the potential to do multiples of what broader stocks do — all stocks owned and influenced by the world’s smartest and most powerful billionaire investors. Join us today and we’ll send you our recently recorded portfolio review that steps through every stock in our portfolio, and the opportunities in each.
Following the Fed yesterday, we heard from the Bank of Japan overnight, and the Bank of England this morning. As for Europe, we heard from the ECB last week.
Coming into this week we’ve had this ongoing dynamic, for quite some time, of the Fed going one way on rates (up) and everyone else going the other way (cutting rates, QE, etc.).
That’s been good for the dollar, as global capital tends to flow toward areas with rising interest rates and better growth prospects. That combination tends to mean a rising currency and rising investment values. What really determines those flows though, is the perception of how that policy spread, between countries, may change. Most recently, that perceived change in the spread has been in favor of it growing, i.e. Fed policy tighter or at least stable, while other spots of the world considering even easier on monetary policy.
That divergence in policy has been bad for currencies like the euro, the pound and the yen. But that hit to the currency is part of the recipe. It promotes higher asset prices, better exports and growth. And as Bernanke says, QE tends to make stocks go up, which helps.
Still, those stocks have lagged the strength in U.S. stocks. With that, over the past six months or so, I’ve talked about the opportunities in European and Japanese stocks for a catch up trade.
While U.S. stocks have continued to set new record highs, stocks in Europe and Japan have yet to regain the highs of 2015 — when the global economy was knocked off course, first by slowing China and a surprise currency devaluation, and later by a crash in oil prices.
With that, if you think Trumponomics marked the end of the decade long deleveraging period (post-financial crisis), and that the Fed is signaling that by ending emergency level monetary policy, then the rest of the world should follow. That means the next move in Europe, Japan, the UK will be toward normalization, not toward more emergency policies.
That means the expectations on the policy gap narrows. With that, we may have seen the bottom in the euro. If negative interest rates and an election cycle that has parties that are outright promising to destroy the euro can’t push it to parity, what can? If it can’t go lower, it will go higher.
And if the euro has bottomed and the next move for the central bank in Europe is tapering, the first step toward ending emergency policies, then this stock market in Europe looks the most intriguing for a big catch up trade – still about 20% off of the 2015 highs and well below the pre-crisis all time highs.
In our Billionaire’s Portfolio, we’re positioned in a portfolio of deep value stocks that all have the potential to do multiples of what broader stocks do — all stocks owned and influenced by the world’s smartest and most powerful billionaire investors. Join us today and we’ll send you our recently recorded portfolio review that steps through every stock in our portfolio, and the opportunities in each.
This week will be a huge week for markets. Stocks continue to hover around record highs. Rates (the 10 year yield) sit at the highest level in three years.
This snapshot alone suggests a world that continues to believe that pro-growth policies “trump” all of the risks ahead. At the very least, it’s pricing in a world without disruptions. But disruptions look likely.
Here’s a look at stocks as we enter the week. Still in a 45 degree uptrend since the election.
But if we take a longer term look, this trendline looks pretty vulnerable to any surprise.
Let’s take a look at the disruptions risks:
There was a chance that the official execution of Brexit may have come as soon as tomorrow — the UK leaving the European Union by triggering Article 50 of the Treaty of Lisbon. That looks unlikely now, but could come in the coming weeks. To this point the Bank of England has done a good job of responding and promoting stability which has led to financial markets pricing in an optimistic outcome.
We have the Fed on Wednesday. They will hike for the third time in the post-financial crisis era. We don’t know at what point higher interest rates, in this environment, might choke off growth that is coming from the fiscal side.
This next chart looks like rates might run to 3% on the 10-year. That would do a number on housing, IF tax reform and an infrastructure spend out of the White House come later than originally anticipated (which is the way it looks).
We also have the Bank of Japan and Bank of England meeting on rates this week. Let’s hope they have a very boring, staying the path, message. That would mean extremely stimulative policies for the foreseeable future 1) in the case of Japan, to continue to promote global liquidity and anchor global yields, and 2) in the case of the UK, to continue to promote stability in the face of uncertainty surrounding Brexit.
Keep this in mind: The Bank of Japan’s big QE launch in 2013 is a huge reason the Fed was able to end QE in the first place, and start its path of normalization. The BOJ launched in April of 2013. Bernanke telegraphed “tapering” a month later. The Fed officially ended tapering on October 29, 2014. Stocks fell 10% into that official ending of Fed QE. On October 31, 2014 (two days later), the BOJ surprised the world with bigger, bolder QE (a QE2). Stocks rallied.
Finally, to end the week, we have a G-20 finance ministers meeting. This is where all of the trade and dollar rhetoric from the new administration will be front and center. So the news/event outlook looks like some waves should be ahead. But any dip in stocks would be a great buying opportunity.
In our Billionaire’s Portfolio, we’re positioned in a portfolio of deep value stocks that all have the potential to do multiples of what broader stocks do — all stocks owned and influenced by the world’s smartest and most powerful billionaire investors. Join us today and we’ll send you our recently recorded portfolio review that steps through every stock in our portfolio, and the opportunities in each.
Markets are quiet as we head into President Trump’s address to Congress tonight. As we’ve discussed over the past week or so, the markets seem to have run the course on the outlook of fiscal stimulus and regulatory reform within an environment of a gradual rise in interest rates.
That “expectation” backdrop seems to be pretty well priced in. Now, it’s a matter of detail and timing, and that puts the new President squarely in focus for tonight.
We’ve already heard from his Treasury Secretary last week that tax reform wouldn’t be coming until August-ish. And he said we shouldn’t expect that big growth bump from Trumponomics until 2018. That’s been the first real downward management of the expectations that have been set over the past three months.
What hasn’t been discussed much is the big infrastructure spend, which is really at the core of the pro-growth policies of the Trump administration. For years, the Fed has been begging Congress for help in stabilizing the economy and stimulating growth in it — from the FISCAL side.
Given the wounds of the debt crisis, it was politically unpalatable for Congress. They ignored the calls. And as a result, just six months ago we (and the rest of the world) were dangerously close to slipping back into crisis. Only this time, the central banks would not have had the ammunition to fight it.
So now we have Congress with the will and position to act. It’s a matter of detailing a plan and getting it moving. Of the many positive things that could come from tonight’s speech by President Trump, details and timeline on fiscal stimulus would be the biggest and most meaningful.
The bickering about deficits and debt will continue, but a big stimulus package will happen — it has to happen. A government spending led growth pop is, at this stage, the only chance we have of returning to a sustainable path of growth and ultimately reducing the debt load down the line, which now is about 100% of GDP. A move back to 80% of GDP would make the U.S. debt load, relative to the rest of the world, a non-issue.
Follow The Lead Of Great Investors Like Warren Buffett In Our Billionaire’s Portfolio
In our Billionaire’s Portfolio, we’re positioned in a portfolio of deep value stocks that all have the potential to do multiples of what broader stocks do — all stocks owned and influenced by the world’s smartest and most powerful billionaire investors. Join us today and follow the world’s best investors into their best stocks. Our portfolio was up over 27% in 2016. Click here to subscribe.

 Since the election, almost a year ago, we’ve talked about the great passing of the torch, from a monetary policy-driven global economic recovery (which proved dangerously weak and shallow) to a fiscal stimulus-driven recovery (which finally gives us a chance to return to trend growth).