Yesterday we looked at the charts on oil and the U.S. 10 year yield. Both were looking poised to breakout of a technical downtrend. And both did so today.
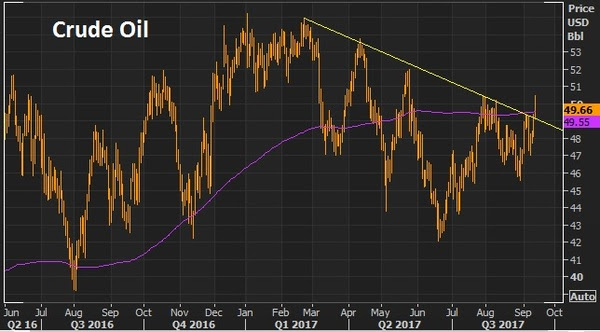
Here’s an updated look at oil today.
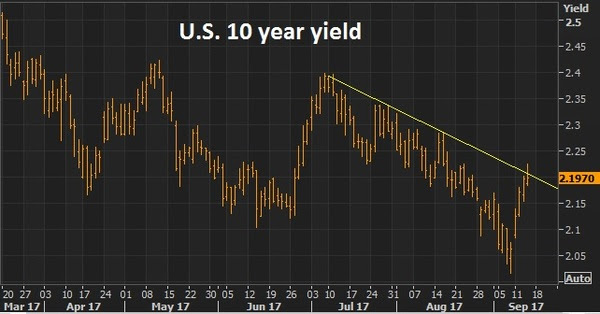
And here’s a look at yields.
We talked yesterday about the improving prospects that we will get some policy execution on the Trumponomics front (i.e. fiscal stimulus), which would lift the economy and start driving some wage pressure and ultimately inflation (something unlimited global QE has been unable to do).
No surprise, the two most disconnected markets in recent months (oil and interest rates) have been the early movers in recent days, making up ground on the divergence that has developed with other asset classes.
Now, oil will be the big one to watch. Yields have a lot to do, right now, with where oil goes.
Though the central banks like to say they look at inflation excluding food and energy, they’re behavior doesn’t support it. Oil does indeed play a big role in the inflation outlook – because it plays a huge role in financial stability, the credit markets and the health of the banking system. Remember, in the oil price bust last year the Fed had to reverse course on its tightening plan and other major central banks coordinated to come to the rescue with easing measures to fend off the threat of cheap oil (which was quickly creating risk of another financial crisis as an entire shale industry was lining up for defaults, as were oil producing countries with heavy oil dependencies).
So, if oil can sustain above the $50 level, watch for the inflation chatter to begin picking up. And the rate hike chatter to begin picking up (not just with the Fed, but with the BOE and ECB). Higher oil prices will only increase this divergence in the chart below, making the interest rate market a strong candidate for a big move.
Join our Billionaire’s Portfolio today to get your portfolio in line with the most influential investors in the world, and hear more of my actionable political, economic and market analysis. Click here to learn more.
Yesterday we talked about the ECB’s projection on how the Brexit will impact on euro area GDP. And we looked at charts of Spanish and Italian sovereign debt. Both suggested that the market reaction, to the downside risk from Brexit, might be over-exaggerated.
Some markets have already fully recovered the Brexit-induced declines. But some key safe-haven assets continue to show healthy capital flows.
Let’s look at some charts.
Source: Reuters, Billionaire’s Portfolio
The chart above is a look at UK stocks. These are blue chip companies listed on the London Stock Exchange. You can see the 9% has been completely erased in just three trading days.
What about commodities? This is Goldman’s commodity index. It’s completed recovered declines, in large part to the reversal in oil and the continued surge in natural gas. Remember we talked about natural gas earlier in the month as it looks like it’s on a path to $4. It nearly hit $3 today.
Source: Reuters, Billionaire’s Portfolio
So we have some traditional “risk-on” assets sharply recovering losses.
But, the “risk-off” trade continues to hold in the traditional safe-haven assets. Bonds are being bought aggressively. You can see the U.S. 10-year yield is nearing levels of the peak of the European Debt Crisis, when Spain and Italy were on the precipice of blow-up.
Source: Reuters, Billionaire’s Portfolio
Interestingly, the 30-year yield is sliding too. This flattens the yield curve, which suggests bets on recession. But this extreme level is historically has been a bottom throughout the crisis period (2008-present).
Source: Reuters, Billionaire’s Portfolio
The dollar continues to hold post-Brexit gains — another sign of safe-haven flows.
Source: Reuters, Billionaire’s Portfolio
And next, the safe-haven flows continue to hold up in gold. But it’s not the runaway market gold bugs would hope for in a time of global stress.
Source: Reuters, Billionaire’s Portfolio
One could argue that the safe haven flows could be coming from core Europe, as Germany is most at risk in the Brexit for the ultimate bad outcome scenario (as we discussed yesterday, where the Brexit could create a spill over into European Monetary Union countries looking for the exit door). But as we reviewed yesterday, the sovereign debt markets in the vulnerable spots in Europe (Italy and Spain) aren’t giving that “bad outcome” signal.
Source: Reuters, Billionaire’s Portfolio
What about Japan? Japanese stocks have bounced sharply, but were among the worst hit given the sharp rise in the yen (a traditional safe-haven).
Source: Reuters, Billionaire’s Portfolio
And finally, U.S. stocks have come back aggressively, but haven’t fully recovered the decline.
Source: Reuters, Billionaire’s Portfolio
What do we make of it? If we consider that the biggest risk associated with Brexit is a destruction of global confidence, rising/recovering stocks go a long way toward defending against that risk. Since the central banks are in the business of defending stability and confidence in this environment, and they are clearly on patrol, they may have a little something to do with stock market recoveries (if not directly, than indirectly).
To follow our big picture views and our hand selected portfolio of the best stocks owned by the best billionaire investors in the world, join us in our Billionaire’s Portfolio.
After a shaky few days for markets, we head into the weekend with some relative calm today. Next week the UK vote on leaving or staying in the European Union will dominate the market focus.
The pressure in markets had been building in recent days on the pick-up in momentum for the Brexit vote in the UK. A log on the fire for that pressure was the inaction from the four central banks that met this week (Fed, BOJ, SNB and BOE). Yields in German 10-years slid below zero. U.S. yields (10 years) hit four year lows. Stocks were sliding, globally. The upward momentum for gold started to kick in. And then we had the tragic murder of a member of British Parliament (widely considered to be politically driven, as she was a ‘stay’ advocate).
So leveraged positions across markets that were leaning in the direction of the momentum unwound, to an extent, on the news.
Today we want to step back and take a look at some key charts as we head into next week.
First, the odds of a Brexit from the bookmakers…
As we’ve said, along the way, despite the coin flip projections coming out of the many polls in the UK, this estimation has been clearly favoring the ‘stay’ camp by about 70/30. Though in recent days the probability of an exit had risen to 44%. Following the tragic news yesterday, that number is now back to 36%.
Next is a chart of gold. This is the safe haven trade, though it hasn’t much allure in quite some time. Still, gold found some legs in the past 10 days.
But as you can see in the chart above, after a $35 higher yesterday, it reversed sharply to close on the lows. In the process it put in a very nice technical reversal pattern (an outside day – where the day’s range engulfs the prior day’s range, caused by low conviction ‘longs’ reversing course near the highs and hitting the exit doors, exacerbating the slide into the close). That price action would argue for lower gold, and in general, the end of this recent flurry of doubt surrounding the UK vote (and uptick in broad market volatility).
As we know, the sustainability of the crude oil recovery is a huge factor in global financial market stability. After trading above $50, it had six consecutive days of lower lows, but it bounced back aggressively today, also posting a key reversal signal (bullish outside day – again, good for the global stability outlook).
Finally, a look at the chart of the S&P 500 …
Despite all of the negative messaging across the media and uncertainty from the investment community, as we head into the weekend stocks sit just 3% off of the all-time highs.
To follow our big picture views and our hand selected portfolio of the best stocks owned by the best billionaire investors in the world, join us in our Billionaire’s Portfolio.
Last week we talked a lot about the German bund yield, the most important market in the world right now. Today we want to talk about how to trade it.
The best investors in the world love asymmetric bets (limited downside and virtually, if not literally, unlimited upside). That’s the true recipe to building huge wealth. And there is no better asymmetric bet in the world right now than the German 10-year bund.
With that in mind, in recent weeks, we’ve revisited Bill Gross’ statement last year, when the 10-year government bond yields in Germany were flirting with zero the first time. He called it the “short of a lifetime” to be short the price of German bunds – looking for yields to bounce back. It happened. And it happened aggressively. Within two months the German 10 year yield rocketed from 6 basis points to over 100 basis points (over 1%). But even Gross himself wasn’t on board to the extent he wanted to be. The bounce was so fast, it left a lot of the visionaries of this trade behind.
But over the past year, it’s all come back.
Is it a second chance? German yields are hovering just a touch above zero — threatening to break into negative yield territory for one of the world’s most important government bond markets.
As we said on Friday, the zero line on the German 10-year government bond yield is huge psychological marker for perceived value and credibility of the ECB’s QE efforts. And that has huge consequences, not just for Europe, but for the global economy.
Given the importance of this level (regarding ECB credibility), it’s no surprise that the zero line isn’t giving way easily. This is precisely why Bill Gross called it the “short of a lifetime.” With that, let’s take a look at the incredible risk/reward this represents, and a simple way that one might trade it.
There is a euro bund future (symbol GBL) that tracks the price of the German 10-year bund. Right now, you can trade 1 contract of the German bund future at a value of 164,770 euros by putting up margin of 3,800 euros (the overnight margin at a leading retail broker). If you went short the bund future, here are some potential scenarios:
If you break the zero line in yield, the euro bund future would trade up to about 165.50 (it currently trade 164.77). If you stopped out on a break of zero in yield, you lose 730 euros (about $820 per contract). If the zero line doesn’t breach, and yields do indeed bounce from here, you make about 1,500 euros for every 10 basis point move higher in the German 10-year bund yield.
For example, on a bounce back to 32 basis points, where we stood on March 15th, the profit on your short position would be about 4,600 euros (or about $5,200). If German bund yields don’t breach zero and bounce back to 1%, where it traded just a year ago, you would make about 15,000 euros ($16,900) per contract on your initial risk of $820 – a 20 to 1 winner. Of course, there are margin costs to consider, given the holding period of the trade, but in a zero rate world, it’s relatively small.
If you’re wrong, and the German 10-year yield breaches zero, you’ll know it soon.
To follow our big picture views and our hand selected portfolio of the best stocks owned by the best billionaire investors in the world, join us in our Billionaire’s Portfolio.
On Tuesday we talked about the quiet bull market in commodities. Today we want to talk about one specific commodity that has been lagging the sharp rebound in oil, but is starting to make a big-time move. It’s natural gas. And this is an area with some beaten up stocks that have the potential for huge bounce backs.
Natural gas today was up almost 6% to a six month high. The U.S. Energy Information Administration said in its weekly report that natural gas storage rose less than what analysts had forecast. But that was just an extra kick for a market that has been moving aggressively higher in the past NINE days (up 37% in nine days).
Now, we should note, nat gas is a market that has some incredible swings. Over the past three years it has traded as high as $6.50 and as low as $1.64.
For perspective on the wild swings, take a look at this long term chart.
You can see we’re coming off of a very low base. And the moves in this commodity can be dramatic.
Three months ago natural gas was continuing to slide, even as oil was staging a big bounce. But natural gas has now bounced 58% after sniffing around near the all-time lows. Meanwhile, oil has doubled.
Based on the backdrop for oil, broader commodities, the economy we’ve been discussing, and the acknowledging the history of natural gas prices, we could be looking at early stages of a big run in nat gas prices.
Summer is one of the most volatile periods for natural gas with the combination of heat waves, hurricanes and potential weather pattern shifts such as La Nina. During the summer months, a 50% move in the price of natural gas is not uncommon. Another 50% rise by the end of the summer would put it around $4. And four bucks is near the midpoint of the $6.50 – $1.65 range of the past three years.
Billionaires investor David Einhorn has also perked up to the bull scenario in nat gas. In his most recent investor letter his big macro trade this year is long natural gas. Here’s what he had to say: “Natural gas prices are not high enough to justify drilling in all but the very best locations. The industry has responded by dramatically reducing drilling activity. As existing wells deplete, supplies should fall. The high cost of liquefying and transporting natural gas limits competition to North American sources. Current inventories are high following a period of over-drilling and a record warm winter. However, the excess inventory is only a couple percent of annual production, which has already begun to decline. Normal weather combined with lower production could lead to a shortage within a year.”
This all contributes to the bullish action we’re seeing across commodities, led by the bounceback in oil. The surviving companies of the energy price bust have been staging big comebacks, but could have a lot further to go on a run up in nat gas prices.
In our Billionaires Portfolio, we have an ETF that has 100% exposure to oil and natural gas – one we think will double by next year. Join us today and get our full recommendation on this ETF, and get your portfolio in line with our Billionaire’s Portfolio.
We’ve talked about the bullish technical break occurring in stocks. That’s continuing again today.
Remember, a week from this past Friday we talked about the G7 (G8) effect on stocks. We stepped back through every annual meeting of world leaders since 2009. And the results were clear. If the communiqué from the meetings focused on concerns about the global economy, stocks went higher. It’s that simple.
Why? In the post Great Recession world, stocks are the key barometer of global confidence. Higher stocks can help promote economic recovery (better confidence, higher wealth effect). Lower stocks can derail it, and threaten a bigger downturn, if not fatal blow to the global economy.
Policymakers can and do influence stocks. And thus, when we’ve seen clear messaging from these meetings about global economic concerns, stocks have done well (in most cases, very well).
With all of this said, on May 27th, from the meeting in Japan, the G7 issued their communiqué and it started with global growth concerns. They said, “Global growth is our urgent priority.” The S&P 500 closed at 2099. Today it’s trading 2116 and is closing in on the all-time highs set in May of last year (less than 1% away).
Now, we talked in past months about the importance of Europe. The Fed’s best friend (and the global economy’s best friend) is an improving economy in Europe. We’ve seen some positive surprises in the data out of Europe, but the actions taken this morning by the ECB could be the real catalyst to get the ball rolling — to mark the bottom, to get Europe out of the slow-to-no growth, deflation funk.
They ECB started implementing a new piece to its QE program today. Of course, they promised bigger and bolder QE back in March (mostly as a response to the cheap oil threat). Today they started buying corporate bonds as part of that ramped-up QE plan.
With that, this is a very important observation to keep in mind. Over the history of the Fed’s three rounds of QE, when the Fed telegraphed QE, rates went lower. When they began the actual execution of QE (actually buying bonds), rates went HIGHER, not lower (contrary to popular expectations). Why? Because the market began pricing in a better economic outlook, given the Fed’s actions. We think we could see this play out in Europe as well.
Take a look at this chart of German yields. This is probably the most important chart in the world to watch over the next several days.
The German 10-year yield traded as low as 3 basis points (that’s earning 30 euros a year for every 100,000 euros you loan the German government, for 10 years). Of course, the most important visual in this chart is how close the German 10-year yield is to zero (the white line), and then negative rates.
Remember, we’ve said before that Draghi and the ECB have made it clear that they won’t cut their benchmark rate below zero. And “that should keep the 10–year yield ABOVE zero.” Were we right? We’ll find out very soon. If so, and if German yields put in a low today on the “actual execution” of the ECB’s new corporate bond buying program, then U.S. yields would be at bottom a here too.
You can see in the above chart, it’s a make or break level for the U.S. 10 year yield as well (as it is tracking German yields at this stage). While lower yields from here in these two key markets might sound great to some, it comes with a lot of problems, not the least of which is a negative message about the outlook for the global economy and thus damage to global confidence. Keep an eye on German yields, the most important market to watch in the coming days.
This Stock Could Triple This Month
In our Billionaire’s Portfolio we followed the number one performing hedge fund on the planet into a stock that has the potential to triple by the end of the month.
This fund returned an incredible 52% last year, while the S&P 500 was flat. And since 1999, they’ve done 40% a year. And they’ve done it without one losing year. For perspective, that takes every $100,000 to $30 million.
We want you on board. To find out the name of this hedge fund, the stock we followed them into, and the catalyst that could cause the stock to triple by the end of the month, click here and join us in our Billionaire’s Portfolio.
We make investing easy. We follow the guys with the power and the influence to control their own destiny – and a record of unmatchable success. And you come along for the ride.
Yesterday we talked about the bullish technical breakout shaping up in stocks. Today we want to talk about a very quiet bull market going on that supports the story for stocks. It’s commodities.
Within the course of the past four short months, commodities have gone being the leading threat for global stocks, to being a leading indicator of an emerging bull cycle for stocks.
Oil, of course, was the key culprit earlier in the year. At $26 oil the world was a scary place. The dominoes were lining up for widespread bankruptcies, starting in the energy complex and spreading to financials, sovereigns, etc.
If you recall, back in early February we said in our daily notes, “OPEC is not just in a price war with U.S. shale producers, but it’s playing a game of chicken with the global economy. We’ve had plenty of events over the past seven years that have shaken confidence and have given markets a shakeup – European sovereign debt, Greece potentially leaving the euro, among them. In Europe, we clearly saw the solution. It was intervention. Oil prices are creating every bit as big a threat as Europe was, we expect intervention to be the solution this time as well.”
Indeed, central banks stepped in and removed the risk with a slew of intervention tactics ranging from more QE from Europe, currency intervention from Japan, relaxing reserve requirements in China, to the Fed removing the prospects of two (of what was projected to be four) rate hikes this year.
That was the dead bottom in oil (which started with BOJ action in USDJPY). And it kicked broader commodities into gear, many of which had already bottomed weeks prior. No surprise, commodity stocks have been among the best performing stocks in the world for the past four months.
Now we have oil closing above $50 today, for the first time since July of last year. And remember, two of the best oil traders of all time have been calling for oil to trade between $80 and $100 by next year (both Pierre Andurand and Andy Hall).
We looked at this chart in our April 12th piece and said: “technically, oil looks like a technical breakout is here. In the above chart, you can see oil breaking above the high of March 22 (which was $41.90). In fact, we get a close above that level — technically bullish. And we also now have a technically bullish pattern (an impulsive C–wave of an Elliott Wave structure) that projects a move to $51.50, which happens to be right about where this big trendline comes in.”
You can see we’ve not only hit this trendline and gotten very close to that projection from April, but (not as easy to see in this chart) we have a clear break of this downtrend now. That line now comes in at $49.39. Oil last traded $50.49.
Next is a look at broader commodities. But first, we want to revisit the clues we were getting from commodities back in early March. Here’s what we said in our March 3rd note: “There are other very compelling signs that the global economy is not only backing away from the edge but maybe turning the corner.
It’s all being led by metals prices. Copper is often an early indicator of economic cycles. People love to say copper has ‘has a Ph.D. in economics’ because it tends to top early at economic peaks and bottom early at economic troughs. Copper bottomed on January 15 and is up 13% since.
The value of iron ore, another key industrial metal, has been destroyed in the past five years – down 80%. That metal bottomed quietly in December and is up 32% since.”
The Goldman Sachs commodity index is now up 44% from the bottom, though it’s heavily weighted energy. The more diversified CRB index is up 24%. Both would fall into the bull market category for those that like to define bull and bear markets. But bottom line, when you look at the above chart you can see how deeply depressed commodities have been. The trend is broken, and the model signals for big trend followers are flashing all over the place to be long. And as we said yesterday, in early stages of cyclical bull trends in stocks, energy does the best by far. With that, although the energy sector weathered a life threatening storm, the upside remains very big for the survivors.
This Stock Could Triple This Month
In our Billionaire’s Portfolio we followed the number one performing hedge fund on the planet into a stock that has the potential to triple by the end of the month.
This fund returned an incredible 52% last year, while the S&P 500 was flat. And since 1999, they’ve done 40% a year. And they’ve done it without one losing year. For perspective, that takes every $100,000 to $30 million.
We want you on board. To find out the name of this hedge fund, the stock we followed them into, and the catalyst that could cause the stock to triple by the end of the month, click here and join us in our Billionaire’s Portfolio.
We make investing easy. We follow the guys with the power and the influence to control their own destiny – and a record of unmatchable success. And you come along for the ride.
As we head into the Memorial Day weekend, we want to talk today about the G7 meeting that took place this week Japan, and how these meetings tend to effect financial markets (namely the key barometer for global markets in this environment, U.S. stocks). It’s a big effect.
If we look back at the past seven annual meetings of world leaders, there is clearly a direct correlation between their messaging and the resulting performance of stocks.
For context, we’re talking about a period, from 2009-present, that has been driven by intervention and careful confidence massaging by global policymakers. So it shouldn’t be surprising that coming out of these meetings, post-Lehman, things happen.
Let’s take a look at the chart of the S&P 500 and highlight the spots where a G7 meeting wrapped up (note: this was actually the G8 prior to 2014, when Russia was ousted from the group).
If you bought stocks following the meeting in Italy, in 2009, you’ve made a lot of money. The next year, in Canada, same result. Of course, the world was in very bad shape at the time, and the messaging from both meetings was unambiguously focused on the economy, restoring stability and growth.
By May of 2011, the message was that the recovery was becoming “self sustaining” (a positive tone). Stocks didn’t push higher, and then fell back later in the year when the European debt crisis spread to Italy, Spain and France.
In 2012, the meeting was hosted in the Washington D.C. The European debt crisis was at peak crisis. Greece exiting the euro was on the table and it was stoking fear that Italy and Spain were next to crumble and destroy the European Monetary Union. The first line of the communiqué was about Europe and the need for economic stimulus. Stocks went higher and two months later, ECB head Mario Draghi further fueled stocks by stepping in and averting disaster in Europe by saying they would do “whatever it takes” to save the euro.
In 2013, G7 leaders, plus Russia met in the UK. The second statement in the 33 page communiqué focused on economic uncertainty and promoting growth and jobs. Stocks went higher.
In 2014, the meeting was hosted by the European Union. Russia had been ousted earlier in the year from the G8 for break of international law for its actions in Ukraine. The primary focus was on Russia and promoting freedom and democracy. The tone on the economy was somewhat upbeat. Stocks went up for a few weeks and then ultimately fell back later in the year in a sharp correction/then sharp recovery.
In 2015, Germany hosted. The communiqué led with a focus on the refugee crisis. Stocks followed a similar path to 2014.
Finally, today the 2016 meetings concluded in Japan. The focus was on the economy. “Global growth remains moderate and below potential, while risks of weak growth persist.” And they discuss rising geo-political conflicts as a further burden on the global economy.
So if we look back at these meetings, clearly there is a G7 (G8) effect. If the headline focus is the economy, it tends to be very good for stocks.
Don’t Miss Out On This Stock
In our Billionaire’s Portfolio we followed the number one performing hedge fund on the planet into a stock that has the potential to triple by the end of next month.
This fund returned an incredible 52% last year, while the S&P 500 was flat. And since 1999, they’ve done 40% a year. And they’ve done it without one losing year. For perspective, that takes every $100,000 to $30 million.
We want you on board. To find out the name of this hedge fund, the stock we followed them into, and the catalyst that could cause the stock to triple by the end of the month, click here and join us in our Billionaire’s Portfolio.
We make investing easy. We follow the guys with the power and the influence to control their own destiny – and a record of unmatchable success. And you come along for the ride.
Bill Ackman, in his most recent quarterly letter to his investors, just divulged a secret we have been telling our subscribers for almost three years now: If you want to get rich, piggybacking the trades of the world’s best billionaire investors and hedge funds could help you attain this goal.
Ackman stated the following in his most recent quarterly letter to his investors: “In 26 out of 30 of our activist commitments, the day-after price was still a bargain versus the ultimate price achieved from our involvement with the company.”
This means if you bought every stock Bill Ackman bought the day after it was announced, you would have made money on 26 out of 30 stocks (87%). More important, you would have made 21 times your money. That turns $100,000 into $2.1 million, or $50,000 into more than $1 million.
Over the past week, I received hundreds of emails concerning Carl Icahn’s announcement that he took an 8% position in Hertz (HTZ). We know Icahn has already publicly stated he wants to actively engage with Hertz management and its CEO, but there has been no word about Icahn pushing Hertz to merge or sell itself.
Here is why: First, regulators would never approve a Hertz-Avis merger. The two entities represent too large a share of the industry. It would essentially be a monopoly. So a merger with Avis isn’t happening — at least in my opinion.
Though, given the quick 25% run up in Family Dollar (FDO) last month after Icahn forced a merger with Dollar Tree (DLTR), it’s easy to see why investors are hoping for a similar result. Clearly, people don’t want to miss out on the next FDO. On that note, you can read some great analysis of the Family Dollar deal, where my partner and I predicted the merger and picked the bottom in Family Dollar stock (read that here).
But again, this is not going to happen with Hertz. Icahn and numerous other investors are long Hertz. Hertz is actually one of the most popular stocks owned by top billionaire hedge fund managers, because it’s a pure play on the improving economy, and rental car companies have lagged airlines in terms of raising their prices.
So many hedge funds are betting on Hertz increasing its prices, like the airlines did last year, and they are betting that demand will continue to improve with the recovery in the economy. It’s that simple.
Also, this is not a classic Icahn play. He typically comes into a deeply depressed stock selling near its 52-week low or multi-year lows. Icahn purchased Hertz near the stock’s all-time high.
But what Icahn is doing is playing his “change” card. He has recently laid out his evidence, based on his history as an activist investor, of how replacing a CEO is a powerful catalyst for producing shareholder wealth creation. And one of his fellow shareholders in Hertz is already at work on that strategy: Fir Tree Partners is pressuring the board to oust the CEO.