As we end the week, let’s take a look at a few charts ….
We had the first look at Q2 GDP today. Here’s an updated look at the chart of the average four-quarter annualized growth rate we looked at
yesterday ….
This number will be formally revised two more times, but the “advance” number came in at 4.1%. Yesterday we talked about the prospects for the highest four-quarter annualized growth rate since 2006. We just missed it, in this first reading. But the Q1 number was revised UP to 2.2%, so adding in today’s Q2 number, and we get 3.1% four-quarter average annualized growth. Only for a moment, in 2010, was it better (at 3.15%).
I suspect we will see a bigger number in the coming Q2 revisions. And if sentiment on trade indeed bottomed out on Wednesday, with the EU concessions, we will likely have a big Q3 growth number coming.
That steadily rising trend, since the election, in the four-quarter average growth rate is a big deal. With that, I would call the above chart, the most important chart of the week…
Let’s look at the second most important chart of the week ….
I’ve been making the case that the massive Nasdaq outperformance, relative to the Dow, would begin correcting. In the chart above, you can see that it’s starting (Dow moving up, Nasdaq moving down). And it’s being led by strength in the blue chips following strong Q2 earnings, and weakness in two of the big tech giants (Netflix and Facebook) following big misses. With that, Facebook has quickly revisited levels of early May (which should give us all perspective on how aggressive this run in the tech giants has been over the past two months).
The question: Is it “peak Zuck?”
If you haven’t joined the Billionaire’s Portfolio, where you can look over my shoulder and follow my hand selected 20-stock portfolio of the best billionaire owned and influenced stocks, you can join me here.
Tomorrow we get the second quarter GDP number. We’ve gone from a consensus view that didn’t believe in the economic momentum, or in the value of fiscal stimulus, to a consensus view that is now looking for more than 4% annualized growth for the second quarter. The switch has flipped in just the past few months.
As a goal for the economy, we hear the 3% growth number thrown around quite a bit. That’s right around long-term trend growth (trend growth is a little higher). But the GDP report that gets the most attention is a quarterly annualized number, which is more of a reflection of what the economy would look like if we moved forward over the next few quarters with similar economic activity. That can be a very volatile number. And we can see big numbers, in good economies and in bad economies. This is where the politicians like to find ambiguity to argue over. The pro-Trumpers will say we’re growing at 3%, something Obama never achieved. And the Obama defenders will point to several 3%+ annualized quarters in the Obama era.
What’s more informative is the average annualized growth over the past four quarters. That’s where you can see smoother trends and considerable improvements in the Trumponomics world.
On that note, we may finally hit that 3% number tomorrow. If the GDP number comes in tomorrow at the Atlanta Fed’s expectations (4.5%), we will have the hottest growth since June 2006.
A 4.5% second quarter number would put the four-quarter average annualized growth at 3.175%–the highest since the pre-financial crisis days. You can also see in the chart, the steady improvement in growth since the election, first driven by the optimism of pro-growth policies, and now driven by policy execution, as deregulation and tax cuts are working through the system.
If you haven’t joined the Billionaire’s Portfolio, where you can look over my shoulder and follow my hand selected 20-stock portfolio of the best billionaire owned and influenced stocks, you can join me here.
Last week Larry Kudlow, the White House Chief Economic Advisor, hinted that Jean-Claude Juncker (head of European Commission) would be coming to Washington with some concessions on trade.
As I write, we’ve yet to hear the results of the Trump/Juncker meeting today, but this could be a major turning point in the perception of the U.S. trade offensive. Movement equals success. And in that case, concessions out of Europe may pave the way to more concessions globally. That signal could trigger a big rally in global markets.
One particular market to watch is copper. Copper is the first place you should look if you think the world is escaping the slugglish post-crisis growth period, and possibly entering an economic boom period. It has been sensitive to the global trade disputes. A clearing of that, would resume what should be a multi-year bull market in copper.
If you haven’t joined the Billionaire’s Portfolio, where you can look over my shoulder and follow my hand selected 20-stock portfolio of the best billionaire owned and influenced stocks, you can join me here.
As we’ve discussed, tech and small-caps (the Nasdaq and the Russell 2000) have been big outperformers on the year, compared to blue-chip stocks. But today seemed like an exhaustive move in that divergence.
There was a clear rotation out of the small-caps (which finished down on the day) and into the blue chips (the Dow finished up nicely on the day). And the red-hot Nasdaq reversed from new record highs to finish flat.
Trump tweeted this morning that tariffs are bringing trade parters to the negotiating table. He seems to be confident that his meeting with EU Chief Jean-Claude Juncker tomorrow will result in concessions from Europe. And there seems to be movement on a new NAFTA deal too. Add this to more good earnings hitting from second quarter earnings season, and it’s enough to get big investment managers moving back into the blue-chip multinationals.
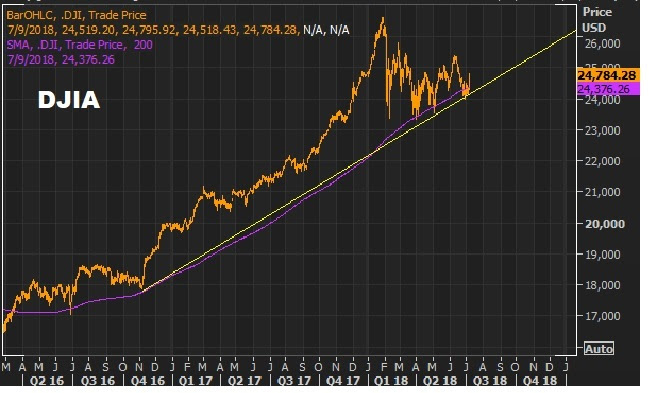
Remember, we’ve been watching this chart. The Dow still has a long way to go, to recover the record highs of earlier this year. But the technical breakout of this corrective downtrend has broken.
If you haven’t joined the Billionaire’s Portfolio, where you can look over my shoulder and follow my hand selected 20-stock portfolio of the best billionaire owned and influenced stocks, you can join me here.
We have a big earnings week. The tech giants report, along with about a third of the S&P 500. And we get our first look at Q2 GDP.
As we’ve stepped through the year, we’ve had a price correction in stocks, following nearly a decade of central bank policies that propped up stocks. This correction made sense, considering central banks were finally able to make the hand-off to a U.S. led administration that had the will and appetite (and alignment in Congress) to relax fiscal constraints and force the structural reform necessary to promote an economic boom.
From there, for stocks, it became a “prove-it to me” market. Let’s see evidence of this “hand-off” is working — evidence the fiscal stimulus is working. That came in the form of first quarter earnings. This showed us clear benefits of the corporate tax cut. The earnings were hot, and stocks began a recovery.
The next steps, as fiscal stimulus works through the economy, we’ve needed to see that the uptick in sentiment (from the pro-growth policies) is translating into better demand and economic activity. So, with Q2 earnings we should start seeing better revenue growth, companies investing and hiring. And we should see positive surprises beginning to show up in the economic data.
We’re getting it. Almost nine out of ten companies reporting thus far have beat (lofty) earnings expectations. And about eight out of ten have beat on revenues. This week will be important, to solidify that picture. And though many of the economists all along the way of the past year didn’t see big economic growth coming, it has been steadily building since Trump was elected, and the Q2 number should push us to over 3% annual growth (averaging that past four quarters).
Now, let’s talk about the big mover of the day: interest rates. The 10-year yield traded to 2.96% today, closing in on 3% again.
We’ve discussed, many times, the role that Japan continues to play in our interest rate market. Despite 7 hikes by the Fed from the zero-interest-rate-era, our 10 year yield has barely budged. That’s, in large part, thanks to the Bank of Japan.
As I’ve said in the past, “Japan’s policy on pegging its 10-year yield at zero has been the anchor on global interest rates. Forcing their benchmark government bond yield back to zero, in a world where there has been upward pressure on interest rates, has meant that they can, and will, buy unlimited amounts of JGBs to get the job done. That equates to unlimited QE. When they finally signal a change to that policy, that’s when rates will finally move.”
With that in mind, there were reports over the weekend that the Bank of Japan may indeed signal a change in that “yield curve control” policy at their meeting next week. And global rates have been moving!
If you haven’t joined the Billionaire’s Portfolio, where you can look over my shoulder and follow my hand selected 20-stock portfolio of the best billionaire owned and influenced stocks, you can join me here.
We’ve been watching the Chinese currency very closely, as the Chinese central bank has been steadily marking down the value of its currency by the day, in efforts to offset U.S. trade tariffs.
Remember, in China, they control the value of their currency. And they’ve now devalued by 8% against the dollar since March. They moved it last night by the biggest amount in two years. That reduces the burden of the 25% tariff on $34 billion of Chinese goods that went into effect earlier this month.
But Trump is now officially on currency watch. Yesterday in a CNBC interview he said the Chinese currency is “dropping like a rock.” And he took the opportunity to talk down the dollar.
The Treasury Secretary is typically from whom you hear commentary about the dollar. And historically, the Treasury’s position has been “a strong dollar” is in the countries best interest. But Trump clearly doesn’t play by the Washington rule book. So he promoted his view on the dollar (at least his view for the moment)–and it may indeed swing market sentiment.
The dollar was broadly lower today. We’ll see if that continues. If so, it may neutralize the moves of China in the near term. Nonetheless, the U.S./China spat is reaching a fever pitch. Someone will have to blink soon. Trump has already threatened to tax all Chinese imports. The biggest risk from China would be a big surprise one-off devaluation. As we discussed yesterday, that would stir up a response from other big trading partners (i.e. Europe and Japan). And they may coordinate, in that scenario, a threat to block trade from China all together.
If you haven’t joined the Billionaire’s Portfolio, where you can look over my shoulder and follow my hand selected 20-stock portfolio of the best billionaire owned and influenced stocks, you can join me here.
Yesterday CNBC hosted their Delivering Alpha conference. This conference is primarily an opportunity for investors to hear views and ideas from some of Wall Street’s best.
However, the bigger picture geopolitical environment is far more important for the market at the moment, than what a big hedge fund manager thinks about valuation (for example).
On that note, there were some interesting takeaways from yesterday’s event. As we discussed yesterday, we heard from Larry Kudlow, the White House Chief Economic Advisor. And we also heard from Steve Bannon, the former White House Chief Strategist.
Bannon has been given plenty of unappealing labels by the media in recent years, but his perspective on the White House game plan and how it’s executing is invaluable. I think everyone would agree that the communication on the economy and foreign policy could be handled better by the White House.
And Bannon articulates the issues in the Trump plan, maybe better than anyone. It’s an interview everyone should watch (here’s a link).
As we’ve discussed here in my ProPerspectives piece since I started writing this nearly three years ago, the trade war is nothing new. And it’s all about China. As Bannon said, China has been waging an economic and cyber war with the U.S. for the better part of the past 25 years. Now they’ve run into a wrecking ball in Trump: someone with the leverage and the credibility to act on threats to end the gutting of global economies (including the U.S. and other major developed market economies). Bannonsays we’re in the early stages of a “reorientation of the supply-chain around freedom loving countries.”
As we’ve discussed, the best reflection of China’s strategic response to Trump’s pressure is their currency. What are they doing with it? They continue to walk it lower every day. This is a signal that they have no options–playing by the rules and getting slower economic growth isn’t an option for the ruling regime in China. They can only fight back by offsetting tariffs with a weaker currency. And that may ultimately lead to blocking China trade completely.
If you haven’t joined the Billionaire’s Portfolio, where you can look over my shoulder and follow my hand selected 20-stock portfolio of the best billionaire owned and influenced stocks, you can join me here.
We’ve talked about the glaring lag in the performance of blue chip stocks coming out of this recent stock market correction. This is creating a huge opportunity to buy the Dow, now.
With all of the complexities you can make of investing, this one is simple. The blue-chip Dow Jones Industrials Index is down on the year (as of this morning). The Nasdaq is up 13% on the year. Small caps (the Russell 2000) is up 11%.
And we’re in an economy that’s running at better than 3% growth, with low inflation, ultra-low rates, and corporate earnings growing at 20% year-over-year. With this formula, and yet a tame P/E multiple on stocks, we’ll probably see stocks up doubledigits before the year is over. Meanwhile, we are already in July, and the DJIA — the most important benchmark stock index for global markets – is starting from near zero.
You may be thinking the boring “industrials” average is out-dated, and flat for a reason. But as far as the makeup of the indices is concerned: The index curators will shuffle the constituents to ensure that the biggest, best performing companies are in it. Bad stocks get kicked out. Good stocks get added. And, to be sure, your retirement money will be methodically plowed into it (the benchmark indices) every month by Wall Street investment professionals.
Bottom line: The DJIA is presenting a gift here to invest, at a discount, in an economy that’s heating up. And you get this chart, which we’ve been watching in recent weeks. This big trend line has held, and so has the 200-day moving average.
How do you buy it? Your financial advisor will put you into mutual funds with big sales loads and fees in attempt to track the Dow. But you can buy an ETF that tracks the Dow for as little as 17 basis points (example: symbol DIA, the SPDR DJIA ETF). This Dow looks like low hanging fruit.
If you haven’t joined the Billionaire’s Portfolio, where you can look over my shoulder and follow my hand selected 20-stock portfolio of the best billionaire owned and influenced stocks, you can join me here.
The jobs report this morning continued to show an improving economy, operating with the luxury of low inflation.
I say improving because as the unemployment rate ticked higher, it represents people coming back into the work force. Those people that have been discouraged along the way, through the economic crisis and recovery, and have dropped out of the work force, are coming back, looking for work.
Remember, the missing piece of the recovery puzzle over the past decade has been wage growth. That has been the telltale sign of the job market, despite the low headline number. With little leverage in the job market to maximize potential, much less command higher wages, consumers tend not to chase prices in goods and services higher–and they tend not to take much risk. This tells you something about robustness of the economy. And that’s precisely why we’ve needed fiscal stimulus and structural reform. And it’s just in the early stages of feeding through the economy.
The other big news of the day was trade. The U.S. started implementing duties on $34 billion of Chinese imports today. On that note, the media has been focused on one specific sentence in the Fed’s minutes yesterday. After weeding through the long conversation on how well the economy was doing, they picked out this sentence to build stories around “contacts in some Districts indicated that plans for capital spending had been scaled back or postponed as a result of uncertainty over trade policy.” Plucking this one out and using it to support their scenarios of trade wars and economic implosion has to be good for reeling in readers.
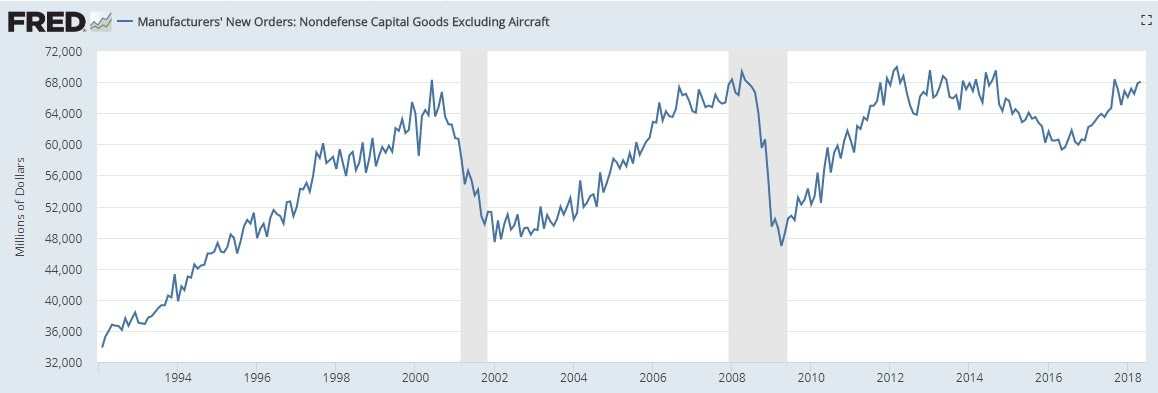
But keep in mind capital goods orders (the chart below) are nearing record highs again.
Add to this: An ISM survey back in December showed that businesses were forecasting just 2.7% growth in capitalspending for 2018. But when they were asked again in May, they had revised that number UP to 10.1% growth.
If you haven’t joined the Billionaire’s Portfolio, where you can look over my shoulder and follow my hand selected 20-stock portfolio of the best billionaire owned and influenced stocks, you can join me here.
I hope everyone had a great Fourth of July yesterday. Today, the markets continue to be thinly traded as we head into the jobs report tomorrow.
We did get minutes from the recent Fed meeting today. This is a closer look into the views of the Fed from their June meeting. Of course, we already had a lot of information from that June meeting: the Fed hiked rates for the second time this year, they telegraphed an additional hike for the year in their projections, plus the June meeting was also accompanied by a press conference from Fed chair Jay Powell. And his explicit “main takeaway” was … “the economy is doing very well.”
With this in mind, as we head into tomorrow’s jobs numbers, the 10-year yield is probably the most important chart to watch. While inflation isn’t near reflecting an economy that’s running hot, the interest rate market is even more disconnected.
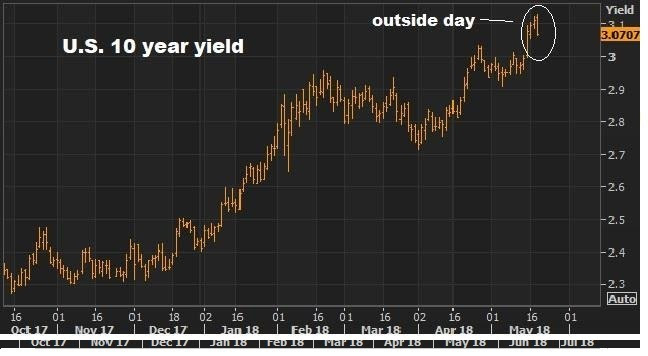
Remember, back on May 18, in my ProPerspectives note, we discussed this chart …
As the world was becoming concerned with the speed and level of market interest rates, we had this big technical reversal signal hit for the key 10-year government bond yield.
We focused on this in my May 18th piece, where I said “this technical phenomenon, when closing near the lows, is a very good predictor of tops and bottoms in markets, especially with long sustained trends.” And I said, “I suspect we may have seen some global central bank buyers of our Treasuries today (which puts downward pressure on yields) to take a bite out of the momentum.”
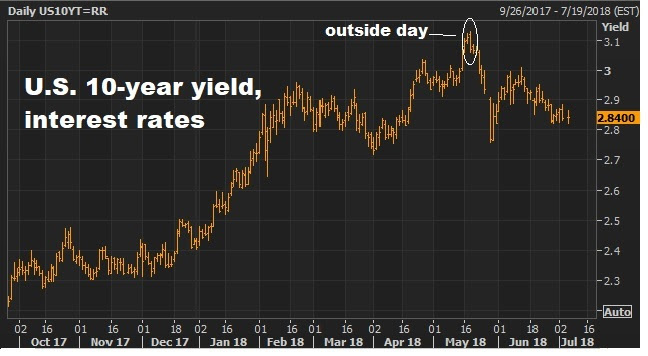
Today the chart looks like this …
So, that outside day did indeed predict a reversal. And we head into tomorrow’s job report with the benchmark 10-year yield at just 2.84%. That’s in a world where the economy is running at 3% growth and unemployment is under 4%.
But this disconnect may be changing tomorrow. The key data point tomorrow will be wages (Average Earning), not jobs. A hot number there will likely turn this around, and bring higher rates back into the picture.
If you haven’t joined the Billionaire’s Portfolio, where you can look over my shoulder and follow my hand selected 20-stock portfolio of the best billionaire owned and influenced stocks, you can join me here.