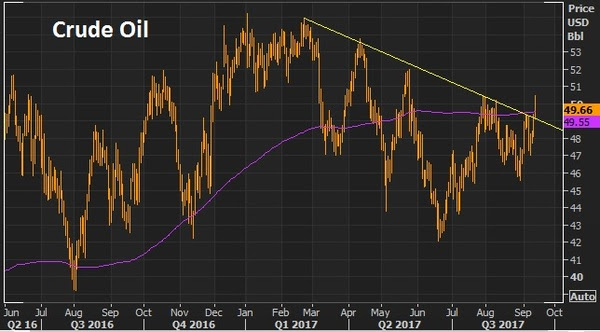
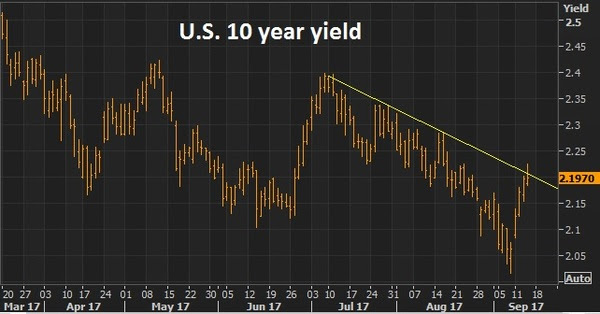
Yesterday we looked at the charts on oil and the U.S. 10 year yield. Both were looking poised to breakout of a technical downtrend. And both did so today.
Here’s an updated look at oil today.
And here’s a look at yields.
We talked yesterday about the improving prospects that we will get some policy execution on the Trumponomics front (i.e. fiscal stimulus), which would lift the economy and start driving some wage pressure and ultimately inflation (something unlimited global QE has been unable to do).
No surprise, the two most disconnected markets in recent months (oil and interest rates) have been the early movers in recent days, making up ground on the divergence that has developed with other asset classes.
Now, oil will be the big one to watch. Yields have a lot to do, right now, with where oil goes.
Though the central banks like to say they look at inflation excluding food and energy, they’re behavior doesn’t support it. Oil does indeed play a big role in the inflation outlook – because it plays a huge role in financial stability, the credit markets and the health of the banking system. Remember, in the oil price bust last year the Fed had to reverse course on its tightening plan and other major central banks coordinated to come to the rescue with easing measures to fend off the threat of cheap oil (which was quickly creating risk of another financial crisis as an entire shale industry was lining up for defaults, as were oil producing countries with heavy oil dependencies).
So, if oil can sustain above the $50 level, watch for the inflation chatter to begin picking up. And the rate hike chatter to begin picking up (not just with the Fed, but with the BOE and ECB). Higher oil prices will only increase this divergence in the chart below, making the interest rate market a strong candidate for a big move.
Join our Billionaire’s Portfolio today to get your portfolio in line with the most influential investors in the world, and hear more of my actionable political, economic and market analysis. Click here to learn more.
Today I want to take a look back at my March 7th Pro Perspectives piece. And then I want to talk about why a power shift in the economy may be underway (again).
Big Picture .. Market Perspectives March 7, 2017
“A big component to the rise of Internet 2.0 was the election of Barack Obama. With a change in administration as a catalyst, the question is: Is this chapter of the boom in Silicon Valley over? And is Snap the first sign?
Without question, the Obama administration was very friendly to the new emerging technology industry. One of the cofounders of Facebook became the manager of Obama’s online campaign in early 2007, before Obama announced his run for president, and just as Facebook was taking off after moving to and raising money in Silicon Valley (with ten million users). Facebook was an app for college students and had just been opened up to high school students in the months prior to Obama’s run and the hiring of the former Facebook cofounder. There was already a more successful version of Facebook at the time called MySpace. But clearly the election catapulted Facebook over MySpace with a very influential Facebook insider at work. And Facebook continued to get heavy endorsements throughout the administration’s eight years.
In 2008, the DNC convention in Denver gave birth to Airbnb. There was nothing new about advertising rentals online. But four years later, after the 2008 Obama win, Airbnb was a company with a $1 billion private market valuation, through funding from Silicon Valley venture capitalists. CNN called it the billion dollar startup born out of the DNC.
Where did the money come from that flowed so heavily into Silicon Valley? By 2009, the nearly $800 billion stimulus package included $100 billion worth of funding and grants for the “the discovery, development and implementation of various technologies.” In June 2009, the government loaned Tesla $465 million to build the model S.
When institutional investors see that kind of money flowing somewhere, they chase it. And valuations start exploding from there as there becomes insatiable demand for these new ‘could be’ unicorns (i.e. billion dollar startups).
Who would throw money at a startup business that was intended to take down the deeply entrenched, highly regulated and defended taxi business? You only invest when you know you have an administration behind it. That’s the only way you put cars on the street in NYC to compete with the cab mafia and expect to win when the fight breaks out. And they did. In 2014, Uber hired David Plouffe, a senior advisor to President Obama and his former campaign manager to fight regulation. Uber is valued at $60 billion. That’s more thanthree times the size of Avis, Hertz and Enterprise combined.
Will money keep chasing these companies without the wind any longer at their backs?”
Now, this was back in March. And that was the question — will it keep going under Trump? Can they continue to thrive/ if not survive without policy favors. Most importantly for the billion dollar startup world, will the private equity capital dry up. This is what it’s really all about. Will the money that chased the subsidies from D.C. to Silicon Valley for eight years (i.e. the trillion dollar pension funds) stop flowing? And will it begin chasing the new favored industries and policies under the Trump administration?
It seems to be the latter. And it seems to be happening in the form of a return to the public markets — specifically, the stock market.
And it may be amplified because of the huge disparity in what is being favored. In Silicon Valley, innovation is favored. Profitability? Remember, the 90s tech bubble. The measure of success for those companies was “eyeballs.” How much traffic were they getting to their websites? Today, when you hear a startup founder talk about the success benchmarks, it rarely has anything to do with with revenue or profit. It’s all about headcount (how many people they’ve hired) and money raised (which enables them to hire people). They are validated by convincing investors to fund them (mostly with our pension money).
Now, the other side of this coin: Trumponomics. Remember, among the Trump policies (corporate tax cuts, repatriation, deregulation, infrastructure spend), the most common sense play in the stock market has been flooding money into companies that make a lot of money. Those that make a lot of money have the most to gain from a slash in the corporate tax rate — it falls right to the bottom line. Leading the way on that front, is Apple. They make a lot of money. And they will make a lot more when a tax cut comes, making the stock even cheaper. That’s why it’s up 25% year-to-date. That’s 2.5 times the performance of the broader market.
Meanwhile, let’s take a look back at the Snapchat. Snapchat doesn’t make money. And even after a 1/3 haircut on the valuation, trades about 35 times revenue. And now, as a public company, probably doesn’t get the protection from the venture capital/private equity community that may have significant investments in its competitors. So the competitors (like Facebook) are circling like sharks to copy their business.
What about Uber? The Uber armor may be beginning to crack as well, with the leadership shakeup in recent weeks. Maybe a good signal for how Uber may be doing? Hertz! Hertz has bounced about 20% from the bottom this week.
What stocks should be on your shopping list, to buy on a big market dip? Join my Billionaire’s Portfolio to find out. It’s risk-free. If for any reason you find it doesn’t suit you, just email me within 30-days.
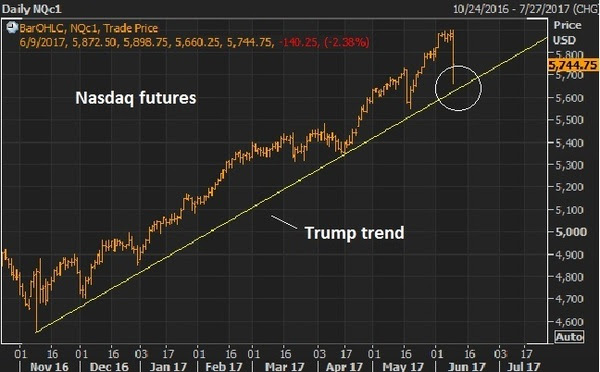
The Nasdaq trade unwound some today. From the peak this morning in the futures of 5898 the tumble started around 11am, falling to as low as 5660. That’s 238 Nasdaq futures points or 4% – quite a sharp move.
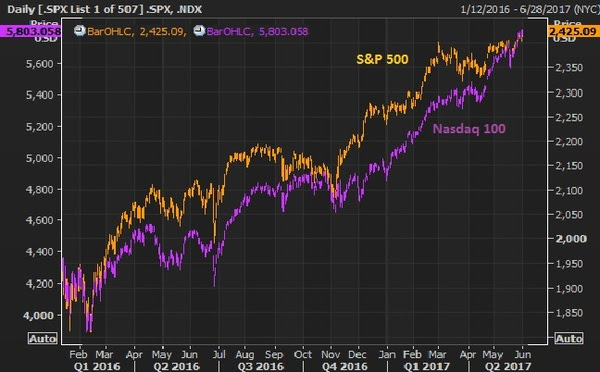
Remember, it seems like an overdone trade (driven by the big tech stocks). But as we discussed last week, the tech heavy Nasdaq has simply been a catch up trade — something that has lagged the strength in the broader market.
Here’s the chart we looked at last week.
This chart goes back to the lows driven by the oil price crash that bottomed out earlier last year.
Still, with the Nasdaq at +18% ytd and S&P 500 +9% ytd, as of this morning, as we’ve seen many times in this post-crisis era, the air pockets of illiquidity in stocks can give back gains very, very quickly. As they say, stocks go up on an escalator and down in an elevator.
The Trump trend, in the chart above, was nearly tested today — the same day a new all-time high was marked!
If we get another few days of sharp downside, it will be a tremendous buying opportunity – get your shopping list ready. And if that downside slide does indeed come, it could come at a very interesting time. It would add another (but very signficant) reason the Fed may balk on a rate hike next week. The other reasons? We discussed them yesterday (here).
Have a great weekend.
What stocks should be on your shopping list, to buy on a big market dip? Join my Billionaire’s Portfolio to find out. It’s risk-free. If for any reason you find it doesn’t suit you, just email me within 30-days.
Last week we discussed the building support for a next leg higher in commodities prices. China is clearly a very important determinant in where commodities go. And with the news last week about cooperation between the Trump team and China, on trade, we may have the catalyst to get commodities moving higher again.It just so happens that oil (the most traded commodity in the world) is rebounding too, on the catalyst of prospects of an OPEC extension to the production cuts they announced last November.In fact, overnight, Saudi Arabia and Russia said they would do “whatever it takes” to cut supply (i.e. whatever it takes to get oil prices higher). Oil was up big today on that news.When you hear these words spoken from policy-makers (those that can dictate outcomes), it should get everyone’s attention. Those are the exact words uttered by ECB head Mario Draghi, that ended the bond market assault in Spain and Italy that were threatening the existence of the euro and euro zone. The Spanish 10-year yield collapsed from 7.8% (unsustainable borrowing rate for the Spanish government, and threatening imminent default) to 1% over the next three years — and the ECB, while threatening to buy an unlimited amount of bonds to push those yields lower, didn’t have to buy a single bond. It was the mere threat of ‘whatever it takes’ that did the trick.
As for oil: From the depths of the oil price crash last year, remember, we discussed the prospects for a huge bounce. Oil prices at $26 were threatening to undo the trillions of dollars of work central banks and governments had done to stabilize the global economy. Central banks couldn’t let it happen. After a series of coordinated responses (from the BOJ, China, ECB and the Fed), oil bottomed and quickly doubled.
Also at that time, two of the best oil traders in the world were calling the bottom and calling for $70-$80 oil by this year (Pierre Andurand and Andy Hall). Another commodities king that called the bottom: Leigh Goehring.
Goehring, one of the best commodities investors on the planet, has also laid out the case for $100 oil by next year. He says he’s “wildly bullish” oil in his recent quarterly investor letter at his new fund, Goehring & Rozencwajg.
Goehring argues that the IEA inventory numbers are flawed. He thinks oil the market is already over-supplied and is in a draw, as of May of last year. With that, he thinks the OPEC cuts will ultimately exacerbate the deficit and send prices aggressively higher. He says “we remain ‘wildly’ bullish and believe that there is a very high probability of oil prices reaching triple digits in the first half of 2018.”
Follow This Billionaire To A 172% WinnerIn our Billionaire’s Portfolio, we have a stock in our portfolio that is controlled by one of the top billion dollar activist hedge funds on the planet. The hedge fund manager has a board seat and has publicly stated that this stock is worth 172% higher than where it trades today. And this is an S&P 500 stock!Even better, the company has been constantly rumored to be a takeover candidate. We think an acquisition could happen soon as the billionaire investor who runs this activist hedge fund has purchased almost $157 million worth of this stock over the past year at levels just above where the stock is trading now.So we have a billionaire hedge fund manager, who is on the board of a company that has been rumored to be a takeover candidate, who has adding aggressively over the past year, on a dip.
Over the past few days, some of the most influential investors in the world have publicly shared views on some of their best ideas.First, over the weekend, it was Buffett at his annual shareholders meeting. The take away, as I said yesterday, “stocks are dirt cheap” if you think rates will stay low for longer (i.e. below long term averages). His assumption in that statement is that the Fed’s benchmark rate goes to 3ish% and done – well below the long run average neutral rate of 5%.
In addition, he was quite vocal on Apple, a stake he picked up as others were selling in fear in the first half of last year (i.e. being greedy when others are fearful). And he doubled his stake earlier this year, now holding north of $20 billion worth of the stock. The analyst community thinks Apple is a juggling act, with balls that will drop if they don’t come up with another revolutionary product every quarter. Buffett thinks Apple is cheap even if they don’t have another single new invention in the future. Why? Because they’ve developed a services business around their hardware that has quickly become one of the biggest and fastest growing businesses in the world.
Remember, back on February 1, I made the case for why Apple could double. You can see that here. It’s gone from a $560 billion company to an $800 billion company since we added it in our Billionaire’s Portfolio early last year. Even at $154 a share (today’s levels) if we strip out the quarter of a trillion dollars in cash, we get the existing business for 12 times earnings.
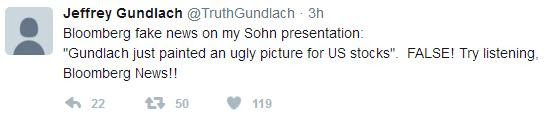
Now, let’s talk about one of the big ideas presented yesterday at the annual Sohn Conference in New York, where many of top billionaire investors and hedge fund managers give their outlook on the stock market, the economy and talk about their favorite long and/or short picks.
Billionaire investor Jeff Gundlach, who oversees the world’s largest bond fund likes selling the S&P 500 against emerging market stocks. He thinks value is distorted relative to global GDP. But it’s more a view on undervaluation of EM, rather than overvaluation of U.S. stocks. He took to Twitter to defend that view…
Assuming a stable to improving world economy, emerging market stocks have lagged and offer a great opportunity to catch up with the strength in the U.S. stock market. It also requires that emerging market currencies are a good bet against the dollar, if policy makers around the world are able to follow the lead of the Fed, where rising interest rate cycles follow. This is a very similar view to the one we discussed yesterday, where Spanish stocks (supported by a stronger euro) present a big catch up trade opportunity (to the tune of about 40% to revisit the 2007 highs), with the destabilization risk of the French elections in the rear-view mirror.
Follow This Billionaire To A 172% Winner
In our Billionaire’s Portfolio, we have a stock in our portfolio that is controlled by one of the top billion dollar activist hedge funds on the planet. The hedge fund manager has a board seat and has publicly stated that this stock is worth 172% higher than where it trades today. And this is an S&P 500 stock!
Even better, the company has been constantly rumored to be a takeover candidate. We think an acquisition could happen soon as the billionaire investor who runs this activist hedge fund has purchased almost $157 million worth of this stock over the past year at levels just above where the stock is trading now.
So we have a billionaire hedge fund manager, who is on the board of a company that has been rumored to be a takeover candidate, who has adding aggressively over the past year, on a dip.
As we discussed last week, we should expect more volatility in markets in the coming months, with the continued discovery surrounding Trump Policies (timing, size) and with UK/EU Brexit negotiations officially opening. That’s a dose of unknowns which should send stocks swinging around quite a bit more than we’ve seen for the past four months.
Remember, on Friday I noted the message the bond market was sending — with market interest rates (U.S. 10 year yields) closing the week, and quarter, at 2.39%. That’s almost a quarter point lower than the high that followed the March rate hike (the third in the Fed’s “normalization” process). And it’s about 10 basis point lower than where the 10 year stood going into the December 2015 rate hike. That’s a negative signal. And I suspect stocks will get that message.
With that said, the first day of the second quarter opened today with a slide in stocks, a slide further in yields and a rise in the price of gold.
When stocks go down, people get nervous and buy downside protection. That tends to spike implied volatility. There’s an index that measures that called the VIX.
Let’s talk about the VIX…
The VIX measures the implied volatility of options on the S&P 500. This is a key component in the price investors pay for downside protection on their portfolios.
So what is implied volatility? Implied volatility measures both actual volatilityand the options market maker community’s expectations (or perception of certainty) about future volatility. When market makers feel confident about the stability in markets, implied vol is lower, which makes the price of options cheaper. When they aren’t confident in stability, implied vol goes up, which makes the price of an option go up. To compensate those that are taking the other side of your trade, for the lack of predictability, you pay a premium.
You can see in the chart below, vol is very, very low — but has been ticking up.
Still, it takes a significant event – a high dose of uncertainty – to create a spike in implied volatility.
That spike tends to correlate well with a sharp slide in stocks. Otherwise, we’re looking at a garden-variety correction in stocks — and that’s what this low vol environment is spelling out.
We had new record highs again in the Dow today. But remember, yesterday we talked about this dynamic where stocks, commodities and the dollar were strong. But a missing piece in the growing optimism about growth has been yields.
Clearly the 10 year at 2.40ish is far different than the pre-election levels of 1.75%-1.80%. But the extension was quick and has since been a non-participant in the full-on optimism vote given across other key markets.
Why? While stocks can get ahead of better growth, yields can’t in this environment. Higher stocks can actually feed higher growth. Higher yields, on the other hand, can kill it.
But there’s something else at work here. As we know Japan’s policy to target the their 10 year at zero provides an anchor to our interest rates, as the BOJ is in unlimited QE mode. Some of that freshly produced liquidity, and the money displaced by their bond buying, undoubtedly finds a happier home in U.S. Treasuries (with a rising dollar, and a 2.4% yield). That caps yields.
But in large part, the quiet drag on U.S. yields has also come from the rising risks in Europe. The election cycle in Europe continues to threaten a populist Trump-like movement, which is very negative for the European Union and for the survival of the single currency (the euro). That creates capital flight, which has been contributing to dollar strength and flows into the parking place of U.S. Treasuries (which pressures yields, which is keeping mortgage and other consumer rates in check).
These flows are also showing up clearly in the safest bond market in Europe: the German bunds. The 2-year German bund hit an all-time record LOW, today of -91 basis points. Yes, while the U.S. mindset is adjusting for the idea of a 3%-4% growth era, German yields are reflecting crisis and money is plowing into the safest parking place in Europe. The spread between German and French bonds are reflecting the mid-2012 levels when Italy and Spain where on the brink of insolvency — only to be saved by a bold threat/backstop from the European Central Bank.
We talked last week about the prospects for higher gold and lower yields as questions arise about the execution of (or speed of execution) Trump’s growth policies, some of the inflation optimism that has been priced in, may begin to soften. That would also lead to a breather for the stock market. I suspect we will begin to see the coming elections in Europe also contribute to some de-risking for the next couple of months. We already have a good earnings season and some solid economic data and optimism about the policy path priced in. May be time for a dip. But as I’ve said, it would create opportunities– to buy any dip in stocks, and sell any rally in bonds.
To peek inside the portfolio of Trump’s key advisor, join me in our Billionaire’s Portfolio. When you do, I’ll send you my special report with all of the details on Icahn, and where he’s investing his multibillion-dollar fortune to take advantage of Trump policies. Click here to join now.
Stocks continue to print new record highs. Let’s talk about why.
First, as we know, the most powerful underlying force for stocks right now is prospects of a massive corporate tax cut, deregulation, a huge infrastructure spend and trillions of dollars of corporate repatriation coming. But quietly, among all of the Trump attention, earnings are also driving stocks. More than 70% of S&P 500 companies have reported. About 2/3rds of the companies have beat Wall Street estimates. And most importantly, earnings in Q4 have grown at 3.1% year-over-year. That’s the first consecutive positive growth reading since Q4 2014/ Q1 2015.
Meanwhile, yields have remained quiet. And oil prices have remained quiet. That’s positive for stocks. Take a look at the graphic below …
You can see, stocks and most commodities continue to rise on the growth outlook. Yields and energy should be rising too. But the 10 year yield has barely budged all year — same for oil. Of course, higher rates, too fast, are a countervailing force to the pro-growth policies. Same can be said for higher oil too fast. With that, both are adding more “fuel” to stocks.
On the rate front, we’ll hear from Janet Yellen this week, as she gives prepared remarks on the economy to Congress, and takes questions.
She’s been a communications disaster for the Fed. Most recently, following the Fed’s December rate hike, she backtracked on her comments made a few months prior, when she said the Fed would let the economy run hot. She denied that in December. Still, the 10-year yield is about 10 basis points lower than where it closed following that December press conference. I wouldn’t be surprised to see a more dovish tone from Yellen this time around, in effort to walk market rates a little lower, to take the pressure off of the Fed and to continue stimulating optimism about the economy.
On Friday we looked at four important charts for markets as we head into this week: the dollar/yen exchange rate, the Nikkei (Japanese stocks), the DAX (German Stocks), and the Shanghai Composite (Chinese stocks).
With U.S. stocks printing new record highs by the day, these three stock markets are ready to make a big catch-up run. It’s just a matter of when. And I argued that a positive tone coming from the meeting of U.S. and Japanese leadership, under the scrutiny of trade tensions, could be the greenlight to get these markets going. That includes a stronger dollar vs. the yen. All are moving in the right direction today.
On the China front, we looked at this chart on Friday.
As I said, “Copper has made a run (up 10% ytd). That typically correlates well with expectations of global growth. Global growth is typically good for China. Of course, they are in the crosshairs of Trump’s fair trade movement, but if you think there’s a chance that more fair trade terms can be a win for the U.S. and a win for China, then Chinese stocks are a bargain here.”
Copper is surged again today on a supply disruption and has technically broken out.
This should continue to spark a move in the Chinese stock market.
For help building a high potential portfolio for 2017, follow me in our Billionaire’s Portfolio, where you look over my shoulder as I follow the world’s best investors into their best stocks. Our portfolio more than doubled the return of the S&P 500 in 2016. You can join me here and get positioned for a big 2017.
Stocks are hitting new record highs today. That includes the Dow, the S&P 500 and the Nasdaq.
We’ve now seen about 60% of the earnings for Q4, and earnings are very good. As we’ve discussed, earnings guidance and consensus views are made to be beaten. Factset says that, on average, about 67% of S&P 500 companies beat the consensus view on earnings. For Q4, that number, as of last Friday, was 65%.
More importantly, the earnings growth rate for Q4 is +4.6% thus far. That’s better than the 3.1% that was predicted, coming into the earnings season. And that’s the first two consecutive quarters of year-over-year positive EPS growth in a couple of years.
So we have positive earnings surprises driving stocks higher. And finally, revenue growth is coming. After six consecutive quarters of revenue contraction, earnings for U.S. companies had a second consecutive quarter of growth. And the quarters ahead should be much better.
Clearly, in the weak growth environment, the focus has clearly been cutting costs, refinancing debt, selling non-core assets, and buying back shares. That’s all a recipe for juicing EPS, even though revenue growth is sluggish, if existent.
So for all of the people that are constantly hand wringing about the levels of the stock market, ask them this: What happens when you take these companies that are growing earnings by optimizing margins in a 1% growth world, and you give them 3%-4% economic growth? Earnings go up. What happens when you take a profitable company and cut the tax burden by 15 to 20 percentage points? Earnings go up.
When earnings go up, price to earnings goes down. And valuations can become very, very cheap.
We have companies that have been forced to streamline to survive. And now we’re in the early days of a regime shift, where tax cuts will work for them, deregulation will work for them, and a big infrastructure spend will pop demand, to actually fuel some revenue growth.
Below is a nice chart from Yardeni. You can see the flattish revenue growth, but earnings divergence over the past five years.
On the right hand axis, next year’s earnings on the S&P 500 are expected around $133. That doesn’t take into account the impact of a corporate tax cut, which Standard & Poors research has suggested could bump that number up to the mid $150s ($1.31 added for every 1% cut in the corporate tax rate). That would dramatically widen the revenue, earnings divergence — or make the closing of this gap that much more aggressive.
For help building a high potential portfolio for 2017, follow me in our Billionaire’s Portfolio, where you look over my shoulder as I follow the world’s best investors into their best stocks. Our portfolio more than doubled the return of the S&P 500 in 2016. You can join me here and get positioned for a big 2017.
Yesterday we looked at the slide in yields (U.S. market interest rates — the 10-year Treasury yield). That continued today, in a relatively quiet market.
Let’s take a look at what may be driving it.
If you take a look at the chart below, you can see the moves in yields and gold have been tightly correlated since election night: gold down, yields up.
As markets began pricing in a wave of U.S. growth policies, in a world where negative interest rates were beginning to emerge, the benchmark market-interest-rate in the U.S. shot up and global interest rates followed. The German 10-year yield swung from negative territory back into positive territory. Even Japan, the leader of global negative interest rate policy early last year, had a big reversal back into positive territory.
And as growth prospects returned, people dumped gold. And as you can see in the chart above of the “inverted price of gold,” the rising line represents falling gold prices.
Interestingly, gold has been bouncing pretty aggressively since mid December. Why? To an extent, it’s pricing in some uncertainty surrounding Trump policies. And that would also explain the slow down and (somewhat) slide in U.S. yields. In fact, based on that chart above and the gold relationship, it looks like we could see yields back below 2.10%. That would mean a break of the technical support (the yellow line) in this next chart …
Another reason for higher gold, lower yields (i.e. higher bond prices), might be the capital flight in China. Where do you move money if you’re able to get it out in China? The dollar, U.S. Treasuries, U.S. stocks, Gold.
The data overnight showed the lowest levels reached in the countries $3 trillion currency reserve stash in 6 years. That, in large part, comes from the Chinese central banks use of reserves to slow the decline of their currency, the yuan. Of course a weakening yuan only inflames U.S. trade rhetoric.
For help building a high potential portfolio for 2017, follow me in our Billionaire’s Portfolio, where you look over my shoulder as I follow the world’s best investors into their best stocks. Our portfolio more than doubled the return of the S&P 500 in 2016. You can join me here and get positioned for a big 2017.


 Last week we discussed the building support for a next leg higher in commodities prices. China is clearly a very important determinant in where commodities go. And with the news last week about cooperation between the Trump team and China, on trade, we may have the catalyst to get commodities moving higher again.It just so happens that oil (the most traded commodity in the world) is rebounding too, on the catalyst of prospects of an OPEC extension to the production cuts they announced last November.In fact, overnight, Saudi Arabia and Russia said they would do “whatever it takes” to cut supply (i.e. whatever it takes to get oil prices higher). Oil was up big today on that news.When you hear these words spoken from policy-makers (those that can dictate outcomes), it should get everyone’s attention. Those are the exact words uttered by ECB head Mario Draghi, that ended the bond market assault in Spain and Italy that were threatening the existence of the euro and euro zone. The Spanish 10-year yield collapsed from 7.8% (unsustainable borrowing rate for the Spanish government, and threatening imminent default) to 1% over the next three years — and the ECB, while threatening to buy an unlimited amount of bonds to push those yields lower, didn’t have to buy a single bond. It was the mere threat of ‘whatever it takes’ that did the trick.


 Over the past few days, some of the most influential investors in the world have publicly shared views on some of their best ideas.First, over the weekend, it was Buffett at his annual shareholders meeting. The take away, as I said yesterday, “stocks are dirt cheap” if you think rates will stay low for longer (i.e. below long term averages). His assumption in that statement is that the Fed’s benchmark rate goes to 3ish% and done – well below the long run average neutral rate of 5%.