Today let’s take a look at the recent moves the U.S. administration has made against Venezuela, and what that means for oil prices.
It was August of 2017, when Trump first stepped up pressure on Venezuela. Venezuela is (and has been) in a humanitarian, political and economic crisis–led by what the U.S. administration has officially called a dictator. Trump slapped sanctions on the Venezuelan President back in 2017 (freezing his U.S assets) and was said to be considering broad oil sanctions. That finally came yesterday (seventeen months later).
For a country that relied heavily on oil exports (ninety-five percent of export revenues in Venezuela come from oil), the U.S. will no longer be sending money to Venezuela for oil.
This is a crushing blow for an already suffering country.
What does it mean for oil prices?
Venezuela has the world’s largest oil reserves. With oil sanctions, should come supply disruptions for the oil market, which could likely send oil aggressively higher.
Back in 2017, when Trump threatened sanctions, oil broke out of its $40-$55 range, and ultimately traded up to $76.
Today, we’re nearing the top end of that same range.
Join me here to get my curated portfolio of 20 stocks that I think can do multiples of what broader stocks do, coming out of this market correction environment.
Stocks continue to recover from the wreckage of December. From December 3rd to December 26th, the S&P 500 collapsed 16%. That was over just 15 trading days.
We’ve since had a 12% bounce over 15 days. But we need another 7% to recoup the losses from December 3.The good news: The catalysts for a big recovery are in place — not only to recover the December 3rd levels, but to print new all time highs in the stock market.
Remember, major turning points in markets are often driven by some form of intervention. In this case, we’ve had it. We had intervention from the U.S. Treasury on December 23/24, 1) calling out to the six largest U.S. banks, and then 2) calling a meeting with the President’s Working Group (which includes the Fed).
Just days later, the Fed sent a clear message to markets that they were there to promote market stability (that means higher stock prices).
Add to this, we’ve entered Q4 earnings season, and we’re getting plenty of positive surprises already, on expectations that were already dialed down substantially in the wake of the stock market decline of the fourth quarter. As of last Friday, 90% of the companies that had reported beat Wall Street’s expectations.
So, where can stocks go from here?
Even with the sharp recovery over the past several weeks, the P/E on this year’s earnings estimate is just 15. That’s cheap relative to history. It’s very cheap relative to historical low interest rate environments.
If we apply Wall Street’s estimate on earnings for the S&P 500 (which is $172), to a P/E of 18 we get 3,096 on the S&P by the end of the year. If we apply a 20 P/E, we get 3,440. That’s argues for anywhere from 18% to 31% higher for 2019.
Keep in mind, that’s if Wall Street hasn’t undershot on its estimate. But they tend to undershoot often (to the tune of about 70% of the time).
Join me here to get my curated portfolio of 20 stocks that I think can do multiples of what broader stocks do, coming out of this market correction environment.
We’ve talked the past couple of days about economic growth and the likelihood that we’re just beginning to see the positive surprises from Trumponomics materialize in the economic data.
Yesterday we talked about the consumption component of GDP. Today, we’ll take a look at investment.
Businesses invest when they’re confident about the outlook. And that was anything but the case for the decade following the global financial crisis.
Why? Because the politicians spent their time playing politics in Washington, instead of addressing an economy that was in desperate need of fiscal stimulus and structural change. Instead, they swung the regulatory pendulum too far in the opposite direction. And they played political football with debt and deficits, instead of acting to restore growth and stability. They stifled growth, just as the Fed was desperately throwing everything at the economy to keep it going. And it was all coming to a head by mid-2016 when global interest rates started turning negative.
But with the election came optimism. There was at least a chance of a return of good economic times (not just domestically but globally). We had a President with an aggressive economic stimulus plan, and a Congress in place to approve it. With that, small business optimism popped and has soared to record highs.
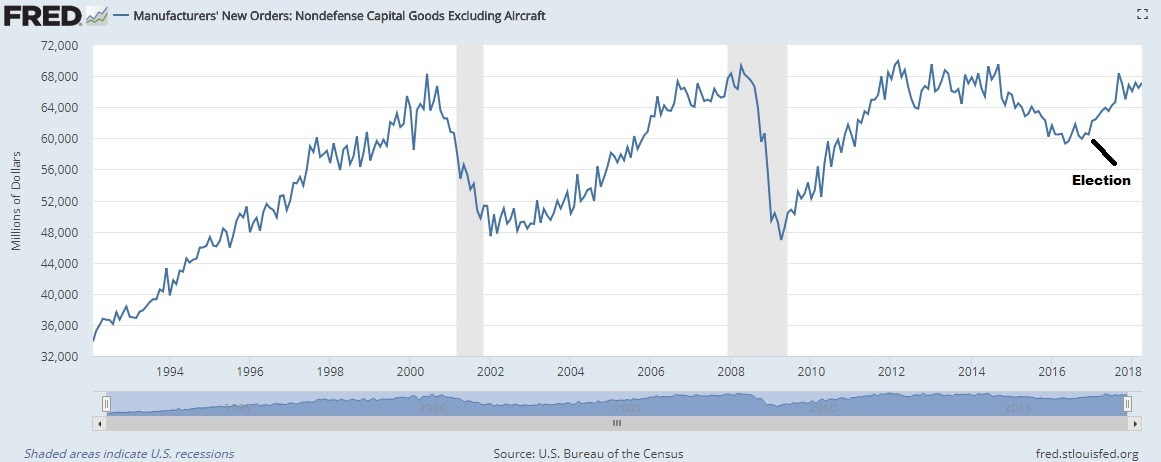
And companies are now investing again. Capital goods orders (the chart below) are nearing record highs again.
Get this: An ISM survey shows businesses were forecasting just 2.7% capital spending growth for 2018 when they were asked back in December. When they were asked again last month, they revised that number UP to 10.1% growth. A big positive surprise coming down the pike.
Again, as with the consumption picture we talked about yesterday, not only is the back drop solid, but we have stimulus that is still in the early stages of feeding through the economy, which is setting the table forpositive surprises in the economic data as we head toward the second half of the year.
And with that, we finally have the pieces in place for the aggressive bounce back in growth that is characteristic of post-recession recoveries. And that should continue to fuel stocks.
At the end of last week, I said “it looks like the all-clear signal has been given to stocks.”
Well, we had some more discomfort to deal with this week, but that statement probably has more validity today than it did last Friday.
With that, let’s review the events and conditions of the past two weeks, that build the case for that all-clear signal.
As of last Friday, more than half of first quarter corporate earnings were in, with record level positive surprises in both earnings and revenues (that has continued). And we got our first look at first quarter GDP, which came in at 2.3%, better than expected, and putting the economy on a 2.875% pace over the past three quarters.
What about interest rates? After all, the hot wage growth number back in February kicked the stock market correction into gear. The move in the 10-year yield above 3% last week started validating the fears that rising interest rates could quicken and maybe choke off the recovery. But last week, we also heard from the ECB and BOJ, both of which committed to QE, which serves as an anchor on global rates (i.e. keeps our rates in check).
Fast forward a few days, and we’ve now heard from the last but most important tech giant: Apple. Like the other FAANG stocks, Apple also beat on earnings and on revenues.
Still, stocks have continued to trade counter to the fundamentals. And we’ve been waiting for the bounce and recovery to pick up the pace. What else can we check off the list on this correction timeline? How about another test of the 200-day moving average, just to shake out the weak hands? We got that yesterday.
Yesterday, in the true form of a market that is bottoming, we had a sharp slide in stocks, through the 200-day moving average, and then a very aggressive bounce to finish in positive territory, and on the highs of the day. That took us to this morning, where we had another jobs report. Perhaps this makes a nice bookend to the February jobs report. This time, no big surprises. The wage growth number was tame. And stocks continued to soar, following through on yesterday’s big reversal off the 200-day moving average.
With all of this, it looks like “the all-clear signal has been given to stocks.”
Last year this time, as we ended 2016, and looked ahead to 2017, it was clear that the dominant theme for the year ahead would be Trumponomics.
We had a global economy that had been propped up by central banks for the better part of eight years, and growth that was proving to be dangerously slow — with growing risks of a stall and another downward spiral.
That was clear in the summer of 2016, when global interest rates started to diving deeply into negative territory. That meant people were happy to pay governments for the security of parking their money in government bonds.
There was a clear lack of optimism about economic conditions and what the future may look like.
That changed with Trump’s election and his commitment to launch an assault on economic stagnation.
It flipped the switch on the lack of optimism that had been paralyzing business activity. And that optimism has led to a hotter economy this year than most expected, despite the lack of substantial policy action (which we didn’t get until later in the year).
So what will next year look like?
As we discussed yesterday, we have tax cuts that should drive corporate earnings and warrant another double digit year for the stock market (close to 20%).
And that doesn’t take into account the impact to corporate earnings from personal tax cuts, a healthier job market with employees that can command higher wages and companies that are confident to take cash and invest in new projects. So, by design, we have incentives coming into the economy for 2018 that will boost demand. And another pillar of Trumponomics, infrastructure, will be the focus early next year, which will fuel more jobs, more economic activity.
All of this and the Fed is projecting just 2.5% growth next year. And Wall Street and the economist community tend to anchor their forecasts on the Fed. But the Fed doesn’t have a very good record in forecasting – especially in recent history.
They overestimated growth and the outlook throughout much of the recovery period. Instead we got stagnation.
But in the past 18 months or so, they flipped the script. They became the “new normal” believers that we’re in for long-term slower growth.
With that, they underestimated the outlook for 2017, even with the prospects of fiscal stimulus coming (they ignored it, and continue to). They were looking for 2.1% growth. It will be closer to 3% for the full year 2017. And next year, while they are looking for 2.5%, we could have something closer to 4%. That’s my bet.
Remember, we’ve talked about the fundamental backdrop, with the addition of fiscal stimulus, that could have us in the early stages of an economic boom period. I think we’ll feel that, for the first time in a long time, in 2018.
Join our Billionaire’s Portfolio today to get your portfolio in line with the most influential investors in the world, and hear more of my actionable political, economic and market analysis. Click here to learn more.
While the President’s pro-growth plan had some wins this year, it was a slow start.
Going after healthcare first was a mistake. Fortunately, a pivot was made, and we now have a big tax bill delivered. And we have what will likely exceed a couple hundred billion dollars in government spending on hurricane/natural disaster aid underway (the early stages of a big government spending/ infrastructure package).
Last year this time, I predicted that Trump’s corporate tax cut would cause stocks to rise 39%. That’s a big number, that’s only been done a handful of times since the 1920s. We got a little better than half way there.
But, here’s the good news: We got there on earnings growth, ultra-low rates and an improving economy. All of that still stands for next year, PLUS we will have the addition of an aggressive tax cut that will be live day one of 2018.
With that, my analysis from last year still stands! Let’s walk through it (yet) again.
S&P 500 earnings grew by 10% this year. S&P 500 earnings are expected to grow at about the same rate next year. And that’s before the impact of a huge cut in the corporate tax rate. The corporate tax rate now goes from 35% to 21% – and for every percentage point cut in that rate, we should expect it to add at least a dollar to S&P 500 earnings.
With that, the forecast on S&P 500 earnings for next year is $144. If we add $14 to that (for 14 percentage points in the corporate tax rate) we get $158. That would value stocks on next year’s earnings, at today’s closing price on the S&P 500, at just 17 times earnings (just a touch higher than the long-term average). BUT, the Fed has told us that rates will continue to be ultra-low next year (relative to history). When we look back at ultra–low interest rate periods, the valuation on stocks runs higher than average—usually north of 20 times earnings.
If we take the corporate tax cut driven earnings of $158 and multiply it times 20, we get 3,160 on the S&P 500. That’s 18% higher than current levels. This analysis doesn’t incorporate the impact of a potentially hotter than expected economy next year (thanks to the many other areas of fiscal stimulus). So, as we’ve discussed throughout the year, the backdrop continues to get better and better for stocks.
Join our Billionaire’s Portfolio today to get your portfolio in line with the most influential investors in the world, and hear more of my actionable political, economic and market analysis. Click here to learn more.
Stocks continue to rise today, up another 1% on the Dow. So year-to-date, the Dow is up 20% now, the S&P 500 is up 17% and the Russell 2000 is up 13%. Remember, most of Wall Street was expecting 3%-4% returns for stocks this year.
What did they miss? Mostly the rise in optimism surrounding the incoming pro-growth government.
With consumer and corporate balance sheets as good as we’ve seen in a long time, unemployment at 4.1% and corporate earnings growing at a 10% clip through the first three quarters, and tax cuts coming, we should expect almost everything to go up.
As for tax cuts, that got a step closer today, as it was approved by the Senate budget committee. Now it goes to a vote on the floor of the Senate.
All of this, and market interest rates are going nowhere. The 10-year yield, at 2.33%, is just about where we started the year. That’s, in part, being weighed down by some comments by incoming Fed Chair Jerome Powell.
Today, Powell gave prepared remarks and took questions for his confirmation hearing with the Senate today. The general view has been that Powell is a like-thinker to Yellen, but with partisan alignment for the president.
But under Yellen’s leadership at the Fed, the overly optimistic forecasts about inflation and the rate path affected consumer behaviors and nearly stalled the recovery last year. They had to reverse course on their projections and game plan early in 2016. And then we had the election, and the prospects of fiscal stimulus, and the Fed (under Yellen) went back to the script of telegraphing a more restrictive rate environment.
Now, with that in mind, I thought early on that Trump would show Yellen the door. And I expected him to appoint a new Fed Chair that was a clear dove–someone that would leave rates alone (given the weak inflation) and let fiscal stimulus feed into the recovering economy, to finally fuel some animal spirits. Do no harm to the economy. Even Bernanke suggested the Fed should let the economy run hot, warning not to kill the recovery by setting expectations for tighter credit coming down the pike.
From Powell’s comments today, it sounds like we may be getting less Yellen than people have believed. In his short prepared remarks, he made an effort to say he strives to support the economy’s progress toward full recovery. He implied the job market needs more improvement, and that he favors easing the regulatory burden on banks. This doesn’t sound like a guy that thinks the economy can withstand mechanically stepping rates higher in the face of weak inflation and sub-trend growth.
As we’ve discussed, in the post-election world (of last year) we’ve had a passing of the baton from a global economy driven by monetary policy, to a global economy driven by structural reform and fiscal stimulus.
With the anticipation of fiscal stimulus, the election represented the end of the QE-era. With that, the top central bankers in the world (Fed, ECB, BOJ, BOE) met today and had a coordinated message to that effect. Just as they coordinated their QE programs to stabilize the world and manufacture recovery, they vowed to coordinate on the exit of QE.
Still, Europe has more work to do before following the Fed’s lead on “normalizing” rates. And Japan will be far behind Europe in ending QE. But that message of coordination should keep global (market) interest rates moving higher.
We’ve talked in recent days about the pockets of selling in global markets. Last week it was junk bonds, then Japanese stocks, then Treasurys and then gold. Today it was commodities, led by oil. Oil was down 2.4% on the day. And the dollar was lower (not higher, as some might expect with commodities moving lower).
Meanwhile, the big U.S. market indices couldn’t be shaken and the Treasury market was very quiet. These intermarket relationships haven’t been normal. And that should raise some eyebrows about elevating risk.
We’ve talked in recent days about the influence that we may be seeing in markets from Saudi Arabia’s move to investigate (potentially seize) up to $800 billion of wealth from high profile officials accused of fleecing the country.
The proxy for global market stability, throughout the past decade (the crisis and post-crisis era), has been U.S. stocks. So as long as U.S. stocks are holding up, people continue to ignore some of these “risk” signs. But give it a 2% down day and suddenly the observables may become observed.
Join our Billionaire’s Portfolio subscription service today to get your portfolio in line with the most influential investors in the world, and hear more of my actionable political, economic and market analysis. Click here to learn more.
Into the latter part of last week, we had some indiscriminate selling in some key markets. First it was Japanese stocks that followed a new 25-year high with a 1,100 point drop. Then we had some significant selling in junk bonds and U.S. Treasuries. And then four million ounces of gold was sold in about a 10 minute period on Friday.
Markets were tame today, but as I said on Friday, the potential ripples from the political shakeup and related asset freeze in Saudi Arabia is a risk that still doesn’t seem to be given enough attention. I often talk about the many fundamental reasons to believe stocks can go much higher. But experience has shown me that markets don’t go in a straight line. There are corrections along the way, and we haven’t had one in a while.
With that said, since 1946, the S&P 500 has had a 10% decline about once a year (according to American Funds research).
The largest decline this year has been only 3.4%.
I could see a scenario play out, with forced selling related to the Saudi events, that looks a lot like this correction in 2014.
This chart was fear driven – when the Ebola fears were ramping up. You can see how quickly the slide accelerated. The decline hit 10% on the nose, and quickly reversed. Fear and forced selling are great opportunities to buy-into. This decline was completely recovered in 30 trading days.
We constantly hear predictions of impending corrections, pointing to all of the clear evidence that should drive it, but corrections are often caused by events that are less pervasive in the market psyche. The Saudi story would qualify. And we’re in a market that is underpricing volatility at the moment – with the VIX sitting only a couple of points off of record lows (i.e. little to no fear). Forced liquidations can create some fear.
Join our Billionaire’s Portfolio subscription service today to get your portfolio in line with the most influential investors in the world, and hear more of my actionable political, economic and market analysis. Click here to learn more.
Yesterday we talked about the case for commodities and the opportunity for a rotation into commodities stocks.
The valuation of commodities relative to stocks has only been this disconnected (stocks strong, commodities weak) twice, historically over the past 100 years: at the depths of the Great Depression in the early 30s and toward the end of the Bretton Woods currency system.
That supports the case that we’re in the early days of a bull market in commodities, especially considering where we stand in the global economic recovery, underpinned by the “reflation” focus at both the monetary and fiscal policy levels. It’s a recipe for hotter demand for commodities.
With that, let’s take a look at a few charts as we close the week.
Copper
We talked about copper yesterday. This continues to ring the bell, alerting us that better economic growth is coming – maybe a boom.
Copper is up 6.5% in the past two weeks, back of $3 and closing in on the highs of the year – which is a three year high. And remember, we looked at the potential break of this big six-year downtrend back in August. That has broken, retested and confirms the trend change.
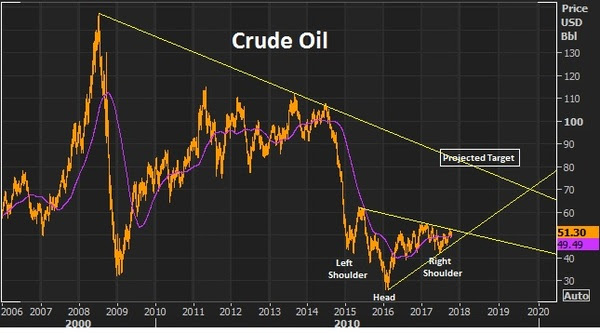
Crude Oil
We talked about the fundamental case for oil this week. And we looked at the technical case, as it made a brief test of the 200 day moving average and quickly bounced back. It’s up about 4% on the week.
We have this inverse head and shoulder (in the chart below) that projects a move back to the low $80s. And as part of that technical picture, we’re setting up for a break of a big two-year trendline that should open the doors to a move back into the $70+ oil area.
Iron Ore
Iron ore was the biggest mover of the day – up 6% today. This has been a deeply depressed market through the post-financial crisis era. In addition to the broad commodities weakness, iron ore prices have suffered from the dumping of poor quailty iron ore by Chinese producers. Those times seem to be changing.
This week there was a fraud claim on a big Japanese steel maker for fudging it’s quality data. Keep an eye on this one as it could lead to more, and could lead to a supply disruption in industrial metals.
Then today we had Chinese data that showed record imports of iron ore. This is a signal that there’s both an envirionmental movement and an anti-dumping movement against low grade iron ore that has been influencing supply and prices (and crushing producers). This big Chinese data point is also in line with the message copper is sending: perhaps the Chinese economy is doing better than most think.
With that, let’s take a look at a few charts as we close the week. The valuation of commodities relative to stocks has only been this disconnected (stocks strong, commodities weak) twice, historically over the past 100 years: at the depths of the Great Depression in the early 30s and toward the end of the Bretton Woods currency system.
Join our Billionaire’s Portfolio today to get your portfolio in line with the most influential investors in the world, and hear more of my actionable political, economic and market analysis. Click here to learn more.


 As we’ve discussed, in the post-election world (of last year) we’ve had a passing of the baton from a global economy driven by monetary policy, to a global economy driven by structural reform and fiscal stimulus.
 Into the latter part of last week, we had some indiscriminate selling in some key markets. First it was Japanese stocks that followed a new 25-year high with a 1,100 point drop. Then we had some significant selling in junk bonds and U.S. Treasuries. And then four million ounces of gold was sold in about a 10 minute period

 Yesterday we talked about the case for commodities and the