Stocks have now opened the year up 4%. Global interest rates are on the move, with the U.S. 2-year Treasury trading above 2% for the first time since 2008. Oil is trading in the mid $60s. And base metals are trading toward the highest levels of the young, two-year bull market in commodities.
This all looks like a market that’s beginning to confirm a real, sustainable economic recovery – anticipating much better growth than what we’ve experienced over the past decade.
If that’s the case, we should expect a big adjustment coming in inflation readings. And with that, we should expect a big adjustment coming for global interest rates. We’ll likely have a 10-year yield with a “3” in front of it before long. And that will have a meaningful impact on key consumer borrowing rates (especially mortgages).
On the inflation note, we’ve talked this week about the impact of higher oil prices on inflation and the impact it may have on the path of central bank policies (most importantly, the speed at which QE may be coming to an end in Europe and Japan).
You can see in this chart, the very tight relationship of oil prices and inflation expectations.
Now remember, one of the best research-driven commodities investors (Leigh Goehring) thinks we may see triple-digit oil prices — this year! This has been a very contrarian viewpoint, but beginning to look more and more likely. He predicted a surge in global oil demand (which has happened) and a drawdown on supplies (which has been happening at “the fastest rate ever experienced”). He says, with the OPEC production cuts (from November 2016), we’re “traveling down the same road” as 2006, which drove oil prices to $147 barrel by 2008.
Bottom line, this is an inflationary tale. If we had to search for a market that might be telling us this story (i.e. inflation is finally leaving the station), the first place people might look is the price of gold. What has gold been doing? It has been on a tear. Gold is up 8.3% over the past month.
For help building a high potential portfolio, follow me in our Billionaire’s Portfolio subscription service, where you look over my shoulder as I follow the world’s best investors into their best stocks. Our portfolio of highest conviction, billionaire-owned stocks is up close to 50% over the past two years. You can join me here and get positioned for a big 2018.
Remember, this time last year, the biggest Wall Street investment banks told us stocks would do just 3% in 2017.
They were looking for about 2,300 on the S&P 500. The most aggressive forecast was 2,500 — coming from the Canadian bank, RBC (Royal Bank of Canada).
Here’s another look at the snapshot of those projections for 2017:
They undershot by a lot. The S&P finished just shy of 2,700 for the year. And S&P 500 earnings came in around $131. Wall Street was looking for $127.
But their big miss was underestimating the outlook for “multiple expansion.” The reason: They continue to underestimate the demand for stocks, in a world where ultra-low yields continue to incentivize people to reach for higher returns (i.e. opt for the choice of more risk for more return).
Investors will pay more for each dollar of future earnings if they expect to earn a higher future rate of return. And they have expected just that over the past few years, because 1) central banks promised to keep pumping up asset prices through QE and to continue warding off any shock risks that could derail the recovery for the economy and stocks, and 2) we’ve had the major shift away from austerity, which has promoted a weaker than typical recovery out of recession (and worse, stall speed growth) and toward big and bold fiscal stimulus (one that can potentially return the economy to a more normal, higher long term growth rate).
That’s why the P/E on stocks can and should rise well north of 20 times earnings in this environment, just as it has over the past three years.
The P/E on the S&P 500 was 20 in 2015, 22 in 2016 and 23 for 2017 (on trailing earnings). In each case, we came into the year, with the market undervaluing earnings — given what people have proven to be willing to pay up for them.
The market is now valuing the New Year’s earnings at 19 times earnings. And that ignores the probability that actual earnings can come in much better than estimates next year, given the corporate tax cut. That would ratchet down that “19 times” earnings valuation – making stocks cheaper.
For help building a high potential portfolio for 2018, follow me in TheBillionaire’s Portfolio, where you look over my shoulder as I follow the world’s best investors into their best stocks. Our portfolio is up 45% over the past two years. Join me here!
Last year this time, as we ended 2016, and looked ahead to 2017, it was clear that the dominant theme for the year ahead would be Trumponomics.
We had a global economy that had been propped up by central banks for the better part of eight years, and growth that was proving to be dangerously slow — with growing risks of a stall and another downward spiral.
That was clear in the summer of 2016, when global interest rates started to diving deeply into negative territory. That meant people were happy to pay governments for the security of parking their money in government bonds.
There was a clear lack of optimism about economic conditions and what the future may look like.
That changed with Trump’s election and his commitment to launch an assault on economic stagnation.
It flipped the switch on the lack of optimism that had been paralyzing business activity. And that optimism has led to a hotter economy this year than most expected, despite the lack of substantial policy action (which we didn’t get until later in the year).
So what will next year look like?
As we discussed yesterday, we have tax cuts that should drive corporate earnings and warrant another double digit year for the stock market (close to 20%).
And that doesn’t take into account the impact to corporate earnings from personal tax cuts, a healthier job market with employees that can command higher wages and companies that are confident to take cash and invest in new projects. So, by design, we have incentives coming into the economy for 2018 that will boost demand. And another pillar of Trumponomics, infrastructure, will be the focus early next year, which will fuel more jobs, more economic activity.
All of this and the Fed is projecting just 2.5% growth next year. And Wall Street and the economist community tend to anchor their forecasts on the Fed. But the Fed doesn’t have a very good record in forecasting – especially in recent history.
They overestimated growth and the outlook throughout much of the recovery period. Instead we got stagnation.
But in the past 18 months or so, they flipped the script. They became the “new normal” believers that we’re in for long-term slower growth.
With that, they underestimated the outlook for 2017, even with the prospects of fiscal stimulus coming (they ignored it, and continue to). They were looking for 2.1% growth. It will be closer to 3% for the full year 2017. And next year, while they are looking for 2.5%, we could have something closer to 4%. That’s my bet.
Remember, we’ve talked about the fundamental backdrop, with the addition of fiscal stimulus, that could have us in the early stages of an economic boom period. I think we’ll feel that, for the first time in a long time, in 2018.
Join our Billionaire’s Portfolio today to get your portfolio in line with the most influential investors in the world, and hear more of my actionable political, economic and market analysis. Click here to learn more.
While the President’s pro-growth plan had some wins this year, it was a slow start.
Going after healthcare first was a mistake. Fortunately, a pivot was made, and we now have a big tax bill delivered. And we have what will likely exceed a couple hundred billion dollars in government spending on hurricane/natural disaster aid underway (the early stages of a big government spending/ infrastructure package).
Last year this time, I predicted that Trump’s corporate tax cut would cause stocks to rise 39%. That’s a big number, that’s only been done a handful of times since the 1920s. We got a little better than half way there.
But, here’s the good news: We got there on earnings growth, ultra-low rates and an improving economy. All of that still stands for next year, PLUS we will have the addition of an aggressive tax cut that will be live day one of 2018.
With that, my analysis from last year still stands! Let’s walk through it (yet) again.
S&P 500 earnings grew by 10% this year. S&P 500 earnings are expected to grow at about the same rate next year. And that’s before the impact of a huge cut in the corporate tax rate. The corporate tax rate now goes from 35% to 21% – and for every percentage point cut in that rate, we should expect it to add at least a dollar to S&P 500 earnings.
With that, the forecast on S&P 500 earnings for next year is $144. If we add $14 to that (for 14 percentage points in the corporate tax rate) we get $158. That would value stocks on next year’s earnings, at today’s closing price on the S&P 500, at just 17 times earnings (just a touch higher than the long-term average). BUT, the Fed has told us that rates will continue to be ultra-low next year (relative to history). When we look back at ultra–low interest rate periods, the valuation on stocks runs higher than average—usually north of 20 times earnings.
If we take the corporate tax cut driven earnings of $158 and multiply it times 20, we get 3,160 on the S&P 500. That’s 18% higher than current levels. This analysis doesn’t incorporate the impact of a potentially hotter than expected economy next year (thanks to the many other areas of fiscal stimulus). So, as we’ve discussed throughout the year, the backdrop continues to get better and better for stocks.
Join our Billionaire’s Portfolio today to get your portfolio in line with the most influential investors in the world, and hear more of my actionable political, economic and market analysis. Click here to learn more.
Remember, the Fed met last week and hiked rates for the third time this year, and the fifth time in the post-crisis hiking cycle. But as we discussed, the big event for interest rates wasn’t last week, it’s this week.
The Bank of Japan meets on Wednesday and Thursday. Japan‘s policy on pegging their 10-year yield at zero has been the anchor on global interest rates (weighing on global interest rates). When they signal a change to that policy, that’s when rates will finally move – and maybe very quickly.
With that in mind, we have the stock market continuing to climb north of +20% on the year. Economic growth is going to get very close to 3% for the full year of 2017, and yet the benchmark longer term interest rates determined by the market are unchanged for the year. The yield on the 10 year Treasury is 2.43% this morning (ticking UP today). We came into the year at 2.43%.
Again, this is the flattening yield curve we discussed last week. For a world that is constantly looking for the next potential danger or signal for doom, the flattening of the yield curve has been the latest place they’ve been hanging their hats (as what they believe to be a predictor of recession). But those people seem happy to assume this yield curve indicator is driven by the same behaviors that have led to recessions in past economic periods, ignoring the unprecedented and coordinated global central bank manipulation that has gotten us here and continues to warp the interest rate market.
So now we have the Fed, which has been moving away from emergency policies. The ECB has signaled an end to QE next year. And the Bank of Japan is next in line — it’s a matter of when.
So how do things look going into this week’s meeting? We know the architect of Japan’s economic reform plan, Prime Minister Shinzo Abe, has just followed the American fiscal stimulus movement with a corporate tax cut of his own, but only for companies that will start raising wages for their employees. He said today that Japan is no longer in a state of deflation. The head of the Bank of Japan has said the economy is in “very good shape.” And that they would consider what is the best level of rate targets to align with changes n the economy, prices and financial conditions. The recent Tankan survey showed sentiment in the manufacturing community hitting decade and multi-decade highs.
But inflation continues to undershoot in Japan, as it is in the U.S. Japan is targeting a 2% inflation rate and is running at just 0.8% annualized.
So it’s unlikely that they will give any signal of taking the foot off of the gas this week. But that signal is probably not far off — maybe in January, after U.S. tax cuts are in effect. What does that mean? It means our market rates probably make an aggressive move higher early next year (10s in the mid 3s and rates on consumer loans probably jump 150 to 200 basis points higher).
Join our Billionaire’s Portfolio today to get your portfolio in line with the most influential investors in the world, and hear more of my actionable political, economic and market analysis. Click here to learn more.
The Fed decided to hike interest rates by another quarter point yesterday. That was fully telegraphed and anticipated by markets. That’s the third rate hike this year, and the fifth in the post-crisis rate hiking cycle.
Still, the yield on the 10-year Treasury note (the benchmark market determined interest rate), moved lower today, not higher — and sits unchanged for the year.
We talked earlier in the week about the biggest central bank event of the month. It wasn’t the Fed, but it will be in Japan next week. Japan’s policy on pegging their 10-year yield at zero has been the anchor on global interest rates.
When they signal a change to that policy, that’s when rates will finally move.
With this divergence between what the Fed is doing (setting rates) and what market rates are doing (market-determined), people have become convinced that the interest rate market is foretelling a recession coming — i.e. short term rates have been rising, while longer term rates have been quiet, if not falling. For example, when the Fed made it’s first rate hike in December of 2015, the 30-year government bond yield was 3%. Today, after five rate hikes on the overnight Fed determined interest rate, the 30-year is just 2.72% (lower, not higher than when the Fed started).
This dynamic has created a flattening yield curve. That gets people’s attention, because historically, when the yield curve has inverted (short term rates rise above long term rates), recession has followed every time since 1950, with one exception in the late 60s.
And it turns out, this “flattening of the yield curve” indicator, historically (and ultimate inversion, when it happens), is typically driven by monetary policy (i.e. rate hikes — check). In these cases, the market anticipates the Fed killing growth and eventually leading rate cuts! They find more certainty and stability in owning longer term bonds (leaving short term bonds pushing those rates up and moving into long term bonds, pushing those rates down — inverting the curve).
The question, is that the case this time? Or is this time different. It’s rarely a good idea in markets to think this time is different than the past. But in this case, following trillions of dollars of central bank intervention and a near implosion in the global economy, it’s probably safe to say that this time is certainly different than past recessions. Though the Fed is in a hiking cycle, rates remain well below long term averages. And, as we know, we have unconventional monetary policies at work in other key areas of the world — stoking liquidity, growth and skewing demand for U.S. Treasuries (which suppresses those long term interest rates).
So the flattening yield curve fears are probably misplaced, especially given big fiscal stimulus is coming. And when Japan moves off of its “zero yield policy,” the U.S. yield curve may steepen more quickly than people think is possible.
Join our Billionaire’s Portfolio today to get your portfolio in line with the most influential investors in the world, and hear more of my actionable political, economic and market analysis. Click here to learn more.
This morning we got a report that smallbusiness optimism hit the second highest level in the 44-year history of the index.
Here’s a look at that history …
optimism
Remember, last year, following the election, this index that measures the outlook from the small business community had the biggest jump since 1980 (as you can see in the chart).
Why were they so excited? For most of them, they had dealt with a decade long crisis in their business, where they had credit lines pulled, demand for their products and services were crushed, healthcare costs were up and their workforce had been slashed. If they survived that storm and were still around, any sign that there could be a radical change coming in the environment was a good sign.
A year ago, with a new administration coming in, half of the smallbusiness owners surveyed, expected the economy to improve. That was the largest agreement of that view in 15 years.
They’ve been right.
Now with an economy that will do close to 3% growth this year, still, about half of small business owners expect the economy to improve further from here.
No surprise, they are more than pleased with the tax cuts coming down the pike. They’ve seen regulatory relief over the past year. And, according the chief economist for the National Federation of Independent Businesses, small business owners see the incoming Fed Chair (Powell) as more favorable toward business (and market determined decisions) than Yellen. And he says, “as long as Congress and the President follow through on tax reform, 2018 is shaping up to be a great year for small business, workers, and the economy.”
This reflects the theme we’ve talked about all year: the importance of fiscal stimulus to bridge the gap between the weak economic recovery that the Fed has manufactured, and a robust sustainable economic recovery necessary to escape the crisis era. This small business survey tends to correlate highly with consumer confidence. Consumer confidence drives consumption. And consumption contributes about two-thirds of GDP. So, by restoring confidence, the stimulative policy actions (and the anticipation of them) has been self-reinforcing.
Join our Billionaire’s Portfolio today to get your portfolio in line with the most influential investors in the world, and hear more of my actionable political, economic and market analysis. Click here to learn more.
As we head into the Thanksgiving day weekend, let’s talk about oil and Saudi Arabia.
On Thanksgiving night three years ago oil was trading around $73, when the Saudis blocked a vote on an OPEC production cut. Oil dropped 10% that night, and that set off a massive oil price bust that ultimately bottomed out early last year at $26.
The goal of the Saudis was to put the emerging, competitive U.S. shale industry out of business–to force oil prices lower so that these shale companies couldn’t product profitably. The plan: They go away, and Saudi Arabia retains its power on global oil. It nearly worked. Shale companies started dropping like flies, with more than 100 bankruptcies between 2015 and 2016.
But cheap oil had broader implications for the global economy, following the Great Recession. It exposed the global banks that had lent the shale industry hundreds of billions of dollars.
Additionally, collapsing oil prices directly weighed on inflation measures and the inflation expectations. That was bad news for the central banks that had committed trillions of dollars to avert a deflationary spiral and promote a normalization of inflation. High inflation is bad. Deflation is worse. Once a deflationary mindset takes hold, it feeds into more deflation. Central banks can raise rates to kill inflation. They have few tools to fight deflation (especially after the financial crisis).
So cheap oil became bad news for the fragile global economic recovery. With that, central banks stepped in early last year and responded with coordinated easing (which included direct asset purchases, which likely included outright oil and oil-related ETFs). Oil bottomed the day the Bank of Japan intervened in the currency market, and prices jumped 50% in a month as other major central banks followed with intervention.
Now, the other piece of this story: cheap oil damaged the shale industry and the global economy, but it also damaged the same folks that set the collapse into motion–Saudi Arabia and other oil producing countries. These countries, which are heavily reliant on oil revenues, have seen their budget deficits balloon. So, with all of the above in mind, in November of last year, the oil producing countries (led by Saudi Arabia) reversed course on their plan, by promising the first production cuts since 2008.
Oil prices have now recovered to the mid-$50s. And since OPEC announced production cuts last year at this time, U.S. petroleum supply has drawn down 5%. Meanwhile, global demand is running far hotter than forecasts of last year. Yet, OPEC is extending their production cuts into this market and may get even bolder next week at their November meeting. Why? Because now it suits them. Remember, Saudi Arabia’s next king has been cleaning house over the past two weeks, in the process of seizing hundreds of billions of dollars from his political foes. Higher oil prices help his efforts to reshape the Saudi economy.
As liquidity dries up into the end of year and holidays, we may see oil find its way back up toward those November 2014 levels (low $70s)–where the whole price-bust debacle started.
Join our Billionaire’s Portfolio today to get your portfolio in line with the most influential investors in the world, and hear more of my actionable political, economic and market analysis. Click hereto learn more.
As we head into the weekend, today I want to talk a bit about the 401k.
I’m looking today at a relatives 401k offering. Nothing has made Wall Street richer than the advent of the 401k. They get a constant monthly stream of fresh capital to skim fees and commissions from, and you get all of the market risk.
For the average person, selecting from the “options” in their 401k plan is a practice of picking the highest number. No surprise, the fund providers know that, and play plenty of games to show you the best numbers possible.
Here’s an example: As I’m looking through the limited choices in this particular 401k plan provider, there is a common theme in the “inception date” of most of the company’s mutual fund offerings. They tend to have track records that start in 2002 at or near the bottom of the internet bubble-induced stock market crash, OR they start in 2009 AFTER the 50% collapse in stocks, OR they start in late 1987 AFTER the crash.
Clearly the long-term returns will look quite a bit better when you’re starting from a bottom, after a crash. And clearly returns will look better without hanging a negative 30%-50% in 2008 and then another negative 30%-40% in the early 2000s.
Maybe they are newer, better strategies and had the good fortune of launching at the right time?
More often, they close them down and reopen them under a new, tweaked name. Add to that, they are constantly launching and running hundreds, if not thousands of funds, so that at any given time they can cherry pick the best performers over a certain period, to put them in front of a captive audience.
Bottom line: Big mutual fund giants are mass asset gatherers feeding on the passive 401k flow of capital, rather than astute investment managers. And the long term returns, after fees, prove it. People are locking their money up for a very long time, and getting a fraction of the market return.
When Congress invented the 401k in the 70s to transfer risk and obligations from the employer (traditional defined benefit pensions) to the employee (defined contributions), they didn’t do you any favors.
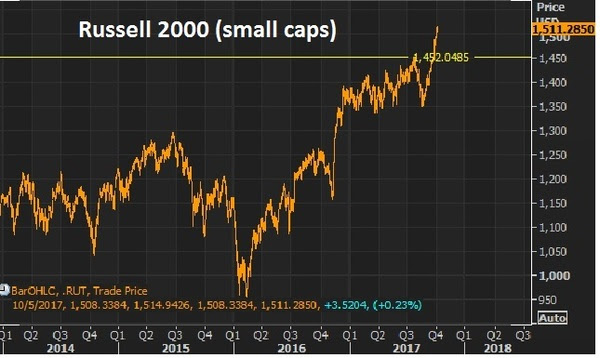
We looked at small caps last week when the the Russell 2000 broke to new highs.
Remember, at that point, small–caps had done only 9% on the year at this point. That’s against 13% for the S&P and Dow.
Here’s the chart now…
The Russell 2000 is now up 12% since the lows of August (up 11% ytd) and if you bought the small cap index on the Monday before the elections last year, you’re up 26%. But small caps continue to lag the bigger cap market. And that makes the last quarter a very intriguing opportunity to own small caps.
Bull markets tend to lift all boats. And with that, equal-dollar weighted small caps tend to outperform equal-dollar weighted large caps in bull markets (in some cases by a lot). This one (bull market) looks like plenty of room to go in that regard. And small cap companies should have more to gain from a corporate tax cut as the tend to have fewer ways to shelter income (relative to big multinationals).
Now, with that bull market assertion, let’s talk about the general uneasiness that seems to exist (and has for a while) from watching the continued climb in stocks.
As we’ve discussed, you often here the argument that the fundamentals don’t support the level of stocks. It’s just not true. The fundamental backdrop continues to justify and favor higher stocks. We have the prospects of fiscal stimulus building, which will be poured onto an already fertile economic backdrop — with low rates, cheap commodities, record consumer high credit worthiness and low unemployment.
As the old market adage goes, “bull markets are born on pessimism, grow on skepticism, mature on optimism and die on euphoria.” I don’t think anyone could argue we are currently in the state of euphoria for stocks. And as the great macro trader Paul Tudor Jones has said, “the last third of a great bull market is typically a blow-off, whereas the mania runs wild and prices go parabolic” (i.e. euphoria can last for a while).
Finally, let’s revisit this analysis from billionaire Larry Robbins on the influence of low interest rates, Fed policy and oilon markets. He says every time ONE of these (following) conditions has existed, the market has produced positive returns. Here they are:
When the 30 year bond yield begins the year below 4%, stocks go up 22.1%.
When investment grade bonds yield below 4%, stocks go up 16%.
When high yield bonds yield below 8%, stocks go up 11.6%.
When cash as a % of asset for non-financials is above 10%, stocks go up 17.6%.
When the Fed tightens 0-75 basis points in the year, stocks go up 22%.
When oil falls more than 20%, stocks go up 27.5%.
Again, his study showed that there has NEVER been a down year stocks, when any ONE of the above conditions is met.
It worked in 2015. It worked in 2016. And now, not only does ONE of these conditions exist, but ALL of these conditions are (or have been) met for 2017.


 As we head into the Thanksgiving day weekend, let’s talk about oil and Saudi Arabia.