We’ve talked quite a bit over the past year about this $100 oil thesis from the research-driven commodities investors Goehring and Rozencwajg.
As they said in their recent letter, “we remain firmly convinced that oil-related investments will offer phenomenal investment returns. It’s the buying opportunity of a lifetime.”
With that, let’s take a look at some favorite energy stocks of the most informed and influential billionaire investors:
David Einhorn of Greenlight Capital has about 5% of his fund in Consol Energy (CNX). Mason Hawkins of Southeastern Asseet Management is also in CNX. He has 9% of his fund in the stock, his third largest position. The last time oil was $100, CNX was a $36 stock. That’s more than a double from current levels.
Carl Icahn’s biggest position is in energy. He has 12% of his fund in CVR Energy. The last time oil was $100, CVI was $49. That’s 58% higher than current levels.
Paul Singer of Elliott Management’s third largest position is an oil play: Hess Corp. (HES). It’s a billion-dollar stake, and the stock was twice as valuable the last time oil prices were $100.
Andreas Halvorsen of Viking Global Investors has the biggest position in his $16-billion fund in EnCana Corp. (ECA). The stock was around $25 last time oil was $100. It currently trades at $14.
If you are hunting for the right stocks to buy, join me in my Billionaire’s Portfolio. We have a roster of 20 billionaire-owned stocks that are positioned to be among the biggest winners as the market recovers. You can add these stocks at a nice discount to where they were trading just a week ago.
With the big decline and wild swings in the stock market, earnings season has gotten little attention.
We’ve now heard from 80% of the companies in the S&P 500 on Q4. According to FactSet, 75% of the companies have beat on earnings. And 78% have had positive revenue surprises.
Now, earnings estimates are made to be broken. And they tend to be beaten at a rate of about 70% of the time. But the same cannot be said for revenues. This has been a key missing piece in the economic recovery. Companies have been cutting costs, refinancing and trimming headcount, all in an effort to manufacture margins and profitability. But revenues, the true gauge of business activity and demand, had been dead for the better part of the past decade.
It was just last year that we finally saw some decent revenue growth coming in from the earnings reports. And this most recent quarter, revenue growth is running at the hottest rate since FactSet has been keeping records. That’s a very good sign for the economic outlook.
And corporate earnings are running 15.2% higher than the same period the year prior. That’s the hottest earnings growth we’ve seen since 2011. More importantly, that’s four percentage points higher than analysts were projecting at the end of the year–with knowledge of the tax cut legislation.
With that said, remember, just last Friday, we had a moment during the day when the forward P/E on the S&P 500 hit 16.2. But if the fourth quarter is any indication, those forward earnings (estimates) will likely get ratcheted UP over the coming quarters, but will still undershoot. That will keep downward pressure on the P/E. Stocks are cheap.
If you are hunting for the right stocks to buy, join me in my Billionaire’s Portfolio. We have a roster of 20 billionaire-owned stocks that are positioned to be among the biggest winners as the market recovers. You can add these stocks at a nice discount to where they were trading just a week ago.
On Friday, stocks bottomed into two big technical levels: 1) the two-year rising trendline that represented the recovery from the lows of 2016, which were induced by the oil price crash, and 2) the 200-day moving average.
We’ve since seen a 5.5% bounce off of the bottom.
Interestingly, the market that has had so many people concerned over the past two weeks–interest rates–were tame and lower on the day. But only after printing a new high (at 2.90%, which is the highest since January of 2014).
That climb in rates, of course, has had everyone uptight about the inflation outlook. But the market you would expect to reflect inflation fears hasn’t been telling the inflation story at all. I’m talking about the price of gold. And gold has been lower, not higher, since stocks have fallen.
Here’s a look at that chart …
With this in mind, the psychology always changes when stocks go down. People search for stories to fit the price–for trouble to fit the price. Even some of the more rational market practitioners were succumbing to this over the weekend, trying to conjure up a negative scenario unfolding for markets.
Having been involved in markets for 20 years, I’ve seen, within both short- and long-term cycles, thousands of turning points, trend changes, phases of a cycles, trends and corrections of trends. Markets can and do have technical corrections. And they can and do correct for no reason, other than price.
So, for perspective, things are good. We will have the hottest economy this year that we’ve seen in a decade. The benchmark 10-year yield, at 2.90%, remains very low relative to history. That means, although borrowing costs are ticking higher, money is still cheap. Gas is cheap. Consumer and corporate balance sheets are as good as they’ve been in a long time. And we’ve just gotten a blue light special on stocks–marking down prices from 18 times to something closer to 16 times earnings. And with the prospects for earnings to come in better than expected, given influence of tax cuts, we are probably looking at a P/E on the S&P 500 forward earnings closer to 15.
If you are hunting for the right stocks to buy, join me in my Billionaire’s Portfolio. We have a roster of 20 billionaire-owned stocks that are positioned to be among the biggest winners as the market recovers. You can add these stocks at a nice discount to where they were trading just a week ago.
Two weeks ago there were signals that a correction was underway. First we had a swing back into positive yield territory for the German 5-year government bond. That was a significant marker for the end of the negative interest rate era and the end of global QE.
And with the outlook for rate normalization formalizing in the market, we should expect stock market growth to be driven from that point by earnings and dividends, and therefore economic growth. And then we had a perfect trigger lining up to set off the correction: earnings from the big tech giants. On script, Google missed. Apple disappointed on guidance, and the broad market sell-off began.
With that, when stocks broke down on February 2nd, we remembered that the stock market has had about a 10% decline on average, about once a year, over the past 70 years.
Then on Monday, the sell-off accelerated, and for a target in the S&P 500 we looked at this chart, which projected a reasonable spot to think we might find a bottom–around 2,560. We hit that on Friday and traded through to the 200-day moving average (2,539)–and we got an aggressive bounce.
Now, I’ve said a decline like this would make stocks cheap–“maybe something closer to 15 times forward earnings.” That sounded crazy two weeks ago. But guess what? We’re pretty darn close. At the lows on Friday, the P/E on earnings forecasted over the next four quarters was 16.2!
But as we know, Wall Street has a long history of underestimating earnings. That’s why about 70% of companies beat on earnings every quarter. And in this case, we’re talking about a huge earnings bump coming in the first quarter from the tax cuts. And Wall Street has barely bumped earnings expectations to incorporate that.
As said earlier this week, when the tax cut was in proposal stages, Citigroup estimated it would add $2 to S&P 500 earnings for every 1 percentage point cut in the tax rate. We’ve gone from 35% to 21%. With that, the forward four-quarter estimate for S&P 500 earnings, before the tax bill (in late November) was around $142.
If we add $28 in tax savings, we get $170. At the lows today in the S&P 500 that puts the P/E on a $170 in S&P 500 forward earnings at 14.8! That’s cheap relative to the long run historical P/E on stocks. And it’s extremely cheap in a world of low rates. And rates are still very low relative to history. And the low-rate environment will continue to motivate investors to seek higher returns in stocks–and pay higher valuations as stocks rebound. With hotter earnings and multiple expansion from here, we could reasonably see a 20%-30% rebound in stocks by year end.
Remember, the psychology always changes when stocks go down. People search for stories to fit the price–for trouble to fit the price. Rather than one of these stories leading to another major fallout, it’s a much higher probability that we are in the early innings of an economic boom, and stocks will be much higher than here in a year’s time. It’s time to be greedy while others are getting fearful.
For help building a high potential portfolio, follow me in our Billionaire’s Portfolio, where you look over my shoulder as I follow the world’s best investors into their best stocks. Our portfolio of highest conviction, billionaire-owned stocks is up close to 50% over the past two years. You can join me here and get positioned for a big 2018.
We talked last week about the correction underway in stocks. As I said, since 1946, the S&P 500 has had a 10% decline about once a year. And we haven’t had one in a while. Since the November 2016 election, the worst decline in stocks from peak to trough had been only 3.4%.
So we were due. And we’ve gotten it.
Today we’ve seen it accelerate. With the steep slide in stocks today, for a brief moment, the Dow futures were down 11% from the peak of just 7 days ago.
Now, let’s add a little perspective on this …
First, as I’ve said, when you are a hedge fund or trader and you’re leveraged 10, 20, 50, 100 times, then avoiding corrections or trend changes is critical to your survival. Getting it wrong, can mean your portfolio blows up and maybe goes to zero. That’s the mentality the media is speaking to, and frankly much of Wall Street is speaking to, when addressing any market decline.
The bottom line is that 99.9% of investors aren’t leveraged and should have no concern about U.S. stock market declines, other than saying to themselves: “What a gift! Do I have cash I can put to work at these cheaper prices? And, where should I put that cash to work?” As the great Warren Buffett has said, “be greedy when others are fearful.”
So, for the average investor, dips are an opportunity to buy stocks at a discount. Don’t let the noise distract you.
Remember, we’ve talked about the transition that is underway, with a global economy that now has the potential to officially exit the economic slog of the past decade, driven by pro-growth policies in the U.S. And those economic tailwinds have introduced the likelihood that the world will finally be able to exit central bank life support (i.e. QE). That’s all very positive.
But it has also been the trigger of the correction in stocks–this transition. QE has promoted higher stock prices. Now we get a correction, and a new catalyst (earnings and the growth picture) to justify the next leg of the global economic recovery (and stock bull market).
With that in mind, the fundamentals for stocks are very strong. As stocks tick down, the better valuation on stocks will only be amplified, when we get hot first quarter earnings hitting in a few months (thanks to the big corporate tax cut). For the S&P 500 P/E: We have the “P” going down, and the “E” going up.
How long could this correction last?
Remember when we were discussing the probability of a correction back in November, we looked at this chart …
In September 2014, with no significant one event or catalyst prompting it, the S&P 500 went on a slide. Stocks closed on a record high on Friday, September 19 (2014). On Monday, stocks gapped lower and over the next 18 days fell 10%. But over the following 12 days it all came back–a sharp V-shaped recovery. It was a textbook technical correction–right at 10%, right into the prevailing trend. You can see it in the chart above: the v-shaped move in stocks, and the bounce right off of the big trendline.
What’s happened in the markets the last few days reminds me of that correction. The moves can be fast, and the recovery can be fast, in this (post-crisis) environment. Big institutions have been trading stocks through computer programs for a long time, but the speed at which these algorithms can access markets and information have changed dramatically over the past decade–so has the massive amount of assets deployed through high frequency trading programs. They can remove liquidity very quickly. Combine that with the reduced liquidity in markets that has resulted from the global financial crisis (i.e. the shrinkage of the marketing making community and of hedge fund speculators, and the banning of bank prop trading) and you get markets that can go down very fast. And you get markets that can go up very fast too.
The proliferation of ETFs exacerbates this dynamic. ETFs give average investors access to immediate execution, which turns investors into reactive traders. Selling begets selling. And buying begets buying.
With the above dynamic, we’ve seen a fair share of quick declines and quick recoveries in the post-financial crisis era.
How do things look now?
In the chart above, this big trend line represents the move off of the oil crash lows of 2016. This 2560 area would give us a 10.8% correction in the S&P 500. I wouldn’t be surprised if we got there over a few days, and a recovery began. And I expect to stocks to end the year up double digits (still).
For help building a high potential portfolio, follow me in our Billionaire’s Portfolio, where you look over my shoulder as I follow the world’s best investors into their best stocks. Our portfolio of highest conviction, billionaire-owned stocks is up close to 50% over the past two years. You can join me here and get positioned for a big 2018.
We talked this past week about the prospects that a correction was underway in stocks. Stocks in China, Japan, Germany and the UK were already leading the way. And with earnings from the big tech giants, I thought any cracks in the armor might give people reason to accelerate the profit taking.
That was the case. Google (NASDAQ:GOOG) missed on earnings. And Apple (NASDAQ:AAPL) disappointed on guidance. And the global stock markets were a sea of red on Friday.
Now, markets don’t go in a straight line, there are corrections along the way. Remember, since 1946, the S&P 500 has had a 10% decline about once a year. And we haven’t had one in a while. Since the election (in November of 2016), the worst decline in stocks from peak to trough has been only 3.4%. We’ve matched that now.
Now, it should be noted that this decline isn’t driven by a negative turn in fundamentals, rather it’s driven by profit taking, and (more importantly) the increasing likelihood that a higher growth environment will ultimately allow the central banks in Europe and Japan to exit QE — the remaining instruments of life support for a global economy that has been brought back to life by fiscal stimulus.
With that, as I’ve said, it’s fair to expect a correction until the data begins to prove out the benefits of fiscal stimulus (i.e. when we see first quarter corporate earnings and GDP growth – both of which should be very strong).
Now, as they do, the media wrings their hands over a slide in stocks and tries to find a story of trouble to fit the price. The reality is, most investors should see a decline in the U.S. stock market as an exciting opportunity. The best investors in the world do. If you are not leveraged, dips in stocks (particularly U.S. stocks – the largest economy in the world, with the deepest financial markets) should be bought, because in the simplest terms, over time, the broad stock market has an upward sloping trajectory.
And when better earnings from tax cuts start coming in for Q1, a lower stock market would amplify the impact of a higher denominator in the P/E ratio — that means stocks could become cheap (er) – maybe something closer to 15 times forward earnings, in a world of (still) low rates.
For help building a high potential portfolio, follow me in our Billionaire’s Portfolio subscription service, where you look over my shoulder as I follow the world’s best investors into their best stocks. Our portfolio of highest conviction, billionaire-owned stocks is up close to 50% over the past two years. You can join me here and get positioned for a big 2018.
For the first time in a decade, the mood at the World Economic Forum in Davos was of optimism and opportunity. And Trump economic policies have had a lot to do with it.
That optimism has continued to drive markets higher this year: global stocks, global interest rates, global commodities – practically everything.
The S&P 500 is up nearly 7% on the year now — just a little less than a month into the New Year. And we’ve yet to see the real impact of tax incentives hit earnings and investment.
But, with the rising price of oil (now above $65), and improving consumption (on the better outlook), we will likely start seeing the inflation numbers tick up.
Now, what will be the catalyst to cap this very sharp run higher in stocks to start the year? It will probably be the first “hotter than expected” inflation number.
That would start the speculation that the Fed might need to move rates faster, and it might speed-up the exit talks from QE in Europe and Japan.
If the inflation outlook triggers a correction (which would be healthy), that would set the table for hotter earnings and hotter economic growth (coming down the pike) to ultimately drive the remainder of stock returns for the year.
For help building a high potential portfolio, follow me in our Billionaire’s Portfolio subscription service, where you look over my shoulder as I follow the world’s best investors into their best stocks. Our portfolio of highest conviction, billionaire-owned stocks is up close to 50% over the past two years. You can join me here and get positioned for a big 2018.
We talked last week about the prospects of a government shutdown and the little-to-no impact it would likely have on markets.
Here we are, with a shutdown as we open the week, and stocks are on to new record highs. Oil continues to trade at the highest levels of the past three years. And benchmark global interest rates continue to tick higher.
As we look ahead for the week, fourth quarter earnings will start rolling in this week. But the big events of the week will be the Bank of Japan and European Central Bank meetings. The Bank of Japan (the most important of the two) meets tonight.
Remember, we’ve talked about the disconnect we’ve had in government bond yields, relative to the recovering global economy and strong asset price growth (led by stocks). And despite five Fed rate hikes, bond yields haven’t been tracking the moves made by the Fed either. The U.S. 10-year government bond yield finished virtually unchanged for the year in 2017.
That’s because the monetary policy in Japan has been acting as an anchor to global interest rates. Their policy of pegging their 10-year yield at zero, has created an open ended, unlimited QE program in Japan. That means, as the forces on global interest rates pulls Japanese rates higher, away from zero, they will, and have been buying unlimited amounts of Japanese Government Bonds (JGBs) to force the yield back toward zero. And they do it with freshly printed yen, which continues to prime the global economy with fresh liquidity.
So, as we’ve discussed, when the Bank of Japan finally signals a change to that policy, that’s when rates will finally move–and maybe very quickly.
If they choose, tonight, to signal an end of QE could be coming, even if it’s a year from now, the global interest rate picture will change immediately. With that in mind, here’s a look at the U.S. ten year yields going in …
For help building a high potential portfolio, follow me in our Billionaire’s Portfolio subscription service, where you look over my shoulder as I follow the world’s best investors into their best stocks. Our portfolio of highest conviction, billionaire-owned stocks is up close to 50% over the past two years. You can join me here and get positioned for a big 2018.
With a government shutdown over the weekend, today I want to revisit my note from last month (the last time we were facing a potential government shutdown) on the significance of the government debt load.
The debt load is an easy tool for politicians to use. And it’s never discussed in context. So the absolute number of $19 trillion is a guarantee to conjure up fear in people – fear that foreigners may dump our bonds, fear that we may have runaway inflation, fear that the economy is a house of cards. So that fear is used to gain negotiating leverage by whatever party is in a position of weakness. For the better part of the past decade, it was used by the Republican party to block policies. And now it’s being used by the Democratic party to try to block policies.
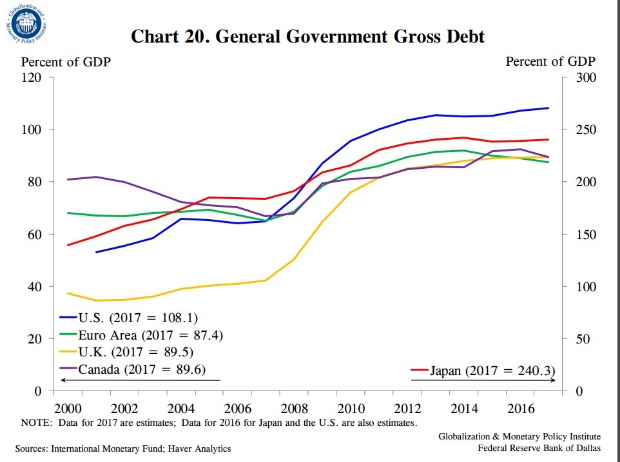
Now, the federal debt is a big number. But so is the size of our economy – both about $19 trillion. And while our debt/GDP has grown over the past decade, the increase in sovereign debtrelativetoGDP, has been a global phenomenon, following the financial crisis. Much of it has to do with the contraction in growth and the subsequent sluggish growth throughout the recovery (i.e. the GDP side of the ratio hasn’t been carrying its weight).
You can see in the chart below, the increasing debt situation isn’t specific to the U.S.
Now, we could choose to cut spending, suck it up, and pay down the debt. That’s called austerity. The choice of austerity in this environment, where the economy is fragile, and growth has been sluggish for the better part of ten years, would send the U.S. economy back into recession. Just ask Europe. After the depths of the financial crisis, they went the path of tax hikes and spending cuts, and by 2012 found themselves back in recession and a near deflationary spiral – they crushed the weak recovery that the European Central Banks (and global central banks) had spent, backstopped and/or guaranteed trillions of dollars to create.
The problem, in this post-financial crisis environment: if the major economies in the world sunk back into recession (especially the U.S.), it would certainly draw emerging markets (and the global economy, in general) back into recession. And following a long period of unprecedented emergency monetary policies, the global central banks would have limited-to-no ammunition to fight a deflationary spiral this time around.
Now, all of this is precisely why the outlook for the U.S. and global economy changed on election night in 2016. We now have an administration that is focused on growth, and an aligned Congress to overwhelm the political blocking. That means we truly have the opportunity to improve our relative debt-load through growth.
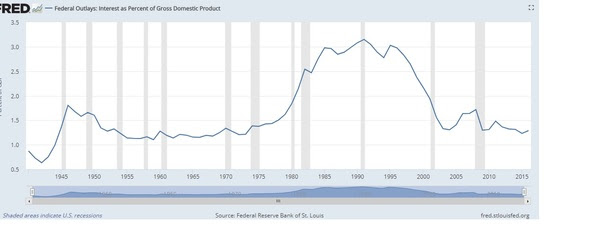
In the meantime, despite all of the talk, our ability to service the debt load is as strong as it’s been in forty years (as you can see in the chart below). And our ability to refinance debt is as strong as it’s been in sixty years.
For help building a high potential portfolio, follow me in our Forbes Billionaire’s Portfolio, where you look over my shoulder as I follow the world’s best investors into their best stocks. Our portfolio of highest conviction, billionaire-owned stocks is up close to 50% over the past two years. You can join me here and get positioned for a big 2018.
government shutdown, washington, wall street, economy
Last week we talked about the big adjustment we should expect to come in the inflation picture. With oil above $60 and looking like much higher prices are coming, and with corporate tax cuts set to fuel the first material growth in wages we’ve seen in a long time (if not three decades), this chart (inflation expectations) should start moving higher…
And with that, market interest rates should finally make a move. As we discussed last week, we will likely have a 10-year yield with a “3” in front of it before long.
Yields have already popped nearly a quarter point since the beginning of the year. But that’s just (finally) reflecting the December Fed rate hike. What hasn’t been reflected in rates, as it has in stocks, is the different growth and wage pressure outlook this year, thanks to the tax cut. Last year, people could argue it wasn’t going to happen. This year, it’s in motion. And the impact is already showing up. We should expect it to show in the inflation data, sooner rather than later.
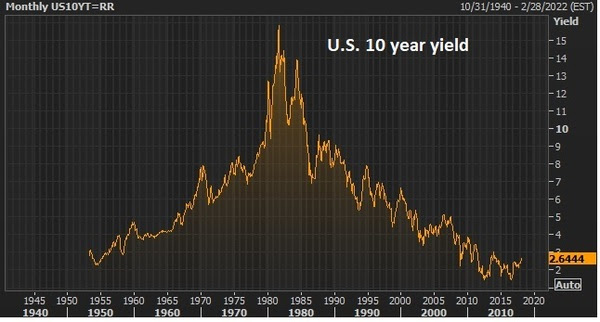
With that, today we’re knocking on the door of a big breakout in rates (as you can see in the chart below) — which comes in at 2.65%…
As we’ve discussed, the anchor for the benchmark U.S. 10-year yield (and for global rates), even in the face of a more optimistic global economic growth outlook, has been Japan’s unlimited QE (driven by its policy to peg its 10-year at a yield of zero). On that note, last week, the former head of the central bank in India, Raghuram Rajan (a highly respected former central banker), said he thinks both Europe and Japan will exit emergency policies sooner than people think. That’s a positive statement on the global economy and a warning that global rates should finally start moving.
For help building a high potential portfolio, follow me in our Billionaire’s Portfolio subscription service, where you look over my shoulder as I follow the world’s best investors into their best stocks. Our portfolio of highest conviction, billionaire-owned stocks is up close to 50% over the past two years. You can join me here and get positioned for a big 2018.