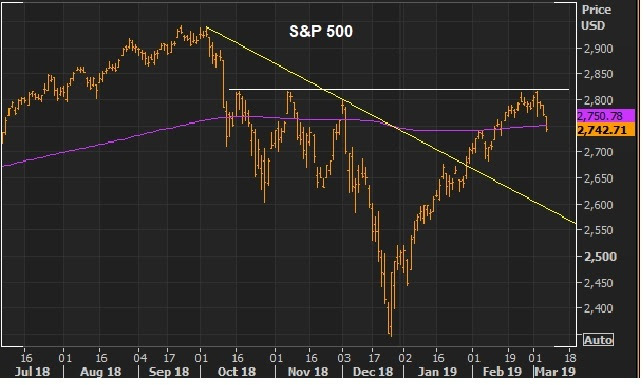
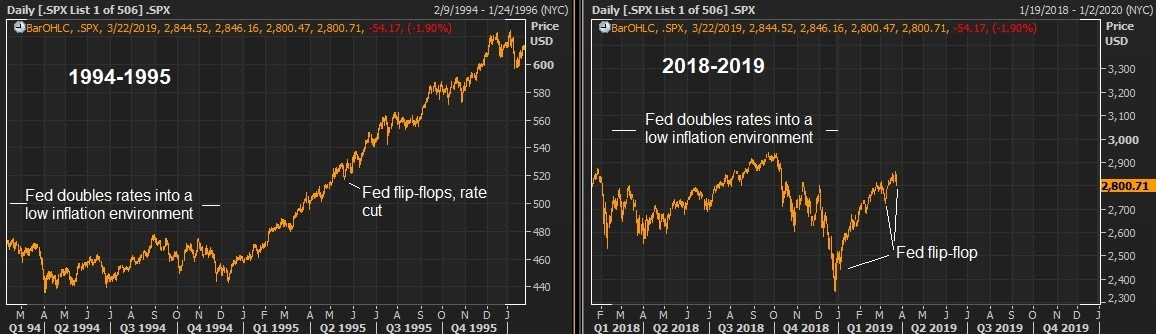
March 27, 5:00 pm EST

We’ve talked this week about the yield curve inversion.

In response, the market is now pricing in a better than 70% chance of a rate cut in June.  And Trump’s new pick to join the Fed, Stephen Moore, has said the Fed should cut by 50 basis points immediately.We’ve talked about the comparisons between 2019 and 1995.  In 1994 the Fed aggressively tightened into a low inflation, recovering economy (as they did in 2018).  By the middle of 1995, they were cutting.  Stocks finished the year up 36%.

Given the contrast of where the Fed has positioned themselves now, compared to just three months ago, they have effectively eased — and we can see it clearly manifested in the interest rate market.  The 10-year U.S. government bond yield has gone from 3.25% to under 2.5% since just November.  I would argue we already have a repeat of 1995.

Here’s a look, in the chart on the left, at what stocks did in 1994-1995, when the Fed transitioned from overtightening (into a low inflation, recovering economy) to easing.  And, on the right, this is how things look now, with similar context. 


Within a few quarters of the ’95 rate cut, U.S. growth was printing above 4% and did so for 18 consecutive quarters.  Stocks tripled over that period.

Join me here to get my curated portfolio of 20 stocks that I think can do multiples of what broader stocks do, through the end of the year.

March 7, 5:00 pm EST

Stocks continue to back off after completing a full recovery of the December declines.

Here’s another look at the chart we observed on Monday, where you can see the big technical area of resistance (three prior highs) — and today we close back on the 200-day moving average (the purple line).

As we discussed on Monday, the failure of this level shouldn’t be too surprising, as a reasonable technical area to take some profits.

As stocks slide back, the media is quick to turn the attention back toward fears of global economic slowdown.  What’s the big difference between now and December?  The Fed has moved from telegraphing rate hikes to ‘neutral’ and sitting/watching.  The PBOC (central bank in China) has done more to stimulate their economy (to incentivize bank lending) and this morning, the ECB has come in with more easy money policies.  Both the Fed and ECB were pre-emptive shots.

Like 2016, the response from central banks has been aggressive and coordinated to ward off slowdown and/or a stock market destabilization.  That recipe worked well in 2016.  I suspect it will work well this year.

Join me here to get my curated portfolio of 20 stocks that I think can do multiples of what broader stocks do, coming out of this market correction environment.

March 6, 5:00 pm EST

Yesterday we talked about the big IPO agenda for the year.

We have some big Silicon Valley “disrupters” set to go public this year, including Lyft, Uber, WeWork and Airbnb.

Remember, these companies emerged from a post-Great Recession world, where pension funds and sovereign wealth funds were flooding money into Silicon Valley, following the money and regulatory favor from the U.S. government.  Of the $800 billion fiscal stimulus response to the financial crisis, the Obama administration doled out $100 billion worth of funding and grants for “the discovery, development and implementation of various technologies.”  The money followed it, and the private market valuations soared.

Were they based on reality or hype and too much money chasing the dream of the next Facebook?

Let’s take a look today at how the big “disrupters” of the past two years have fared, after much anticipated IPOs.

Dropbox:  Dropbox was priced at $21 per share.  It started trading at over $28.  Today it trades at $22.

Spotify:  Priced at $165.90 per share.  It started trading at $164.  It currently trades at $146.

Snap: Priced at $17 per share.  It started trading at $22.  Today it trades at $9.90.

Nothing good for the average investor that picked up these shares when these stocks went public.

Who has gotten rich? The founders.

The founder of Dropbox is worth $2.3 billion.  His company lost half a billion dollars last year on $1.4 billion in revenue.  Revenue growth is slowing to a near mortal 25% growth rate – and losses are widening dramatically.

Spotify’s founder is now also worth about $2.3 billion.  Revenue growth is slowing too to unexciting levels, and the company is still losing money.

What about Snap?  The Snap founder is worth over $2 billion.  Snap lost $1.2 billion last year, on $1.1 billion in revenue. Revenue growth has gone from 600%, to 100%, to 43% last year.

The hyper-growth valuations are unlikely to get hyper-growth.  I suspect we might see the same with the roster of IPOs this year.

Join me here to get my curated portfolio of 20 stocks that I think can do multiples of what broader stocks do, coming out of this market correction environment.

March 5, 5:00 pm EST

There’s a lot of excitement about the building IPO docket for the year.  Let’s take a look of the lay of the land …

There is said to be more than 220 companies planning to go public in 2019.

On Friday, Lyft filed an S1 with the SEC (a prospectus like document) in preparation for an IPO.  This will be the first Silicon Valley darling to go public this year.

Lyft is the second largest ride-sharing company — owns about a third of the U.S. market, with Uber owning the rest.  Uber is expected to go public this year.  The other big ones coming:  Airbnb, WeWork and Palantir.

We’ve clearly had a boom cycle in Silicon Valley over the past decade.  But are these IPOs coming late the party?

Remember, we have an administration in Washington that has tightened the regulatory screws on the dominant publicly-traded tech giants (Facebook, Amazon, Google).  The regulatory tailwinds (or lack thereof) that they enjoyed along the path of their disruptive growth, have now turned into headwinds.  And the stocks have all been hit, as a result.

Keep in mind, the private market valuations were pumped-up in these IPO candidates when public equity markets were offering little optimism about future returns.  With that, pension money was flowing into the coffers of Silicon Valley private equity firms.  And private equity fund managers were throwing money at things — and companies have been burning through that money, ramping staff, buying fancy offices and inundating us with blitz advertising campaigns.

Safe to say there has been an overhyping of the term “disrupters.”  In many cases, we’re looking at startups trying to underprice and outspend (with our pension money) in a traditional business, without having the hurdle of making money (maybe ever).  Not surprisingly, there have been market share wins.

But public companies tend to be held to a standard: profitability.  We’ll see how they do with the shifting market environment (i.e. late cycle Silicon Valley).

Lyft will be an early indicator.  Its last private investment valued the company at $15.1 billion.  For that, in their filing, they revealed a company doing a little over $2 billion in revenue, while losing almost a billion dollars last year.  Revenue growth has been slowing, losses have been widening as the private equity investors attempt to cash out in the public markets.

Join me here to get my curated portfolio of 20 stocks that I think can do multiples of what broader stocks do, coming out of this market correction environment.

March 4, 5:00 pm EST

Stocks sold off sharply this morning, before bouncing nicely from the lows.   The range on the day was the third largest of the year.

The question:  Was the selling today technically-driven or was there a catalyst that introduced new risk into the market (i.e. something bigger)?

Let’s take a look at the chart …

With this sharp V-shaped recovery of the past two months, we have stocks testing these highs, and failing today.

But the failure of this level (for the moment) shouldn’t be too surprising.  Following a runup of 20%, for some this is a reasonable technical area to sell some/ to take profit.

But is there more to the sell-off this morning?

We did get an announcement that the Congressional Judiciary Committee has launched an investigation into the Trump administration.  It includes document requests from 80 people/entities tied to the administration.  They will be looking at obstruction of justice, public corruption and abuse of power (the latter of which, might be the most subjective and, therefore, threatening).

After all of the allegations and political mudslinging surrounding Trump, could this pose the biggest risk to the Trump administration and policymaking yet?  Possibly.

Congress has a unchallengeable investigatory and subpoena power.  They can dig as deeply and broadly as the want, and create as much havoc as they want, which means this may dominate what happens on Capitol Hill until the 2020 election.

Now, with all of this said, if we look at the market reaction today, as a proxy for how the market is digesting this — we did not see across the board selling.  That’s good.  If we look inside the U.S. stock market, most active stocks were a mix of up and down on the day (including up days Apple, Facebook, Baba and Amazon).  That’s good.  And foreign stocks were less impacted by the early swing in U.S. stocks.  That’s good. The emerging market futures index MXEF actually finished at the New York close UP from Friday’s close.

Join me here to get my curated portfolio of 20 stocks that I think can do multiples of what broader stocks do, coming out of this market correction environment.

February 22, 5:00 pm EST

As the anticipation has grown on a structural reform agreement between the U.S. and China, we’ve talked about what might be the leading indicators that China will make the necessary concessions to get something done.

Remember, by the end of last year, much economic data in China was running at or worse the 2009 levels (the depths of the global economic crisis).  Clearly, they are in trouble.  As for Chinese stocks, an ugly bear market of was triggered in early 2018 when Trump’s rhetoric turned into action.  He slapped tariffs on washing machines and solar panels (a signal of bark and bite).

But as we know, by December the spiraling data in China also began taking a big toll on global markets.  With this, we’ve had responses from global central banks, including in China.

Now, Chinese stocks have been important to watch, for clues on: 1) are they doing enough to stimulate the struggling economy, and 2) (more importantly) are they taking serious steps to get to an agreement on trade with the U.S.?

With the above in mind, Chinese stocks bottomed on January 4th. That was when China and the United States announced they would hold trade talks in Beijing that following week.  That announcement represented the re-opening of trade talks, and the potential of an end to the trade war – which was a welcomed relief signal.

Chinese stocks have since represented an important signal in the recovery in global stocks.  On that note, the Shanghai Composite is now up 15% from the January 4th bottom. So, the signal has been good.  And as you can see in the chart below, we’re trading through the 200 day moving average (the purple line).

Another spot we’ve been watching in my Pro Perspective notes has been China’s currency.

China’s currency (the yuan) ends the week near its strongest levels since July.  This is China’s attempt to show the Trump administration that they are willing to make concessions on the all-important currency (the tool that has driven the massive trade disparity and wealth transfer of the past three decades).

As we head into the weekend, we have these two “leading indicators” supporting what has been maybe the most optimistic tone we’ve heard yet on an agreement.  It was announced this afternoon that the head Chinese trade negotiator would be extending his trip to Washington through the weekend.

Join me here to get my curated portfolio of 20 stocks that I think can do multiples of what broader stocks do, coming out of this market correction environment.

February 14, 5:00 pm EST

A big miss on retail sales this morning sent stocks sharply lower, initially.

This type of reaction presents a perfect opportunity to add at cheaper levels.  Remember, this is old data, from December (delayed due to the government shutdown).  And we know what was going on in December.  Stocks were hammered.  The government was heading toward a shutdown (which happened toward the end of the month).  And the Fed raised rates right into it.  It was a sentiment storm.

What is significantly correlated to sentiment?  Retail sales.

Here’s a look at the dip in both …


The number this morning has already triggered downgrades in fourth quarter growth estimates.

The good news:  This will also further drive down expectations for Q1 growth.

I say good news, because these sentiment driven indicators have a long history of short-term swings, and can bounce back very quickly.  Remember, since December, we now have a near full retracement in stocks, a Fed on hold (and a  more acommodative global central bank stance), and a somewhat more optimistic geopolitical outlook.

So, we’re setting up for positive surprises in the economic data for Q1.  Positive surprises are fuel for stocks.

Join me here to get my curated portfolio of 20 stocks that I think can do multiples of what broader stocks do, coming out of this market correction environment.

February 13, 5:00 pm EST

Over the past couple of days we’ve looked at some key technical levels for stocks, as we continue this V-shaped recovery from the deep decline of December.

We now sit just a percent and a half off of the December 3rd highs. And today, we get a break and a close above the 200-day moving average in the S&P 500.

So, with all of the doom and gloom scenarios we heard as we entered 2019, a month later and we’ve nearly fully recovered the losses of December.  And with expectations on earnings  and growth all ratcheted down now for the year, we have a lot of fuel for much higher stocks.

As U.S. stocks go, so do global stocks.  We looked at the chart on Japanese stocks yesterday.  We did indeed get a big technical break overnight of the correction downtrend that started in October of last year.

So, today we have this chart … 

With much of the concern on global growth directed squarely in China, this chart of Chinese stocks is signaling that perhaps Chinese growth is bottoming, and maybe because a U.S./China deal is coming.  

In this chart above, you can see this bear market in Chinese stocks last year was started in January.  That was when Trump rhetoric on a China trade war turned into action.  He slapped tariffs on washing machines and solar panels (a signal of bark and bite).  Now we have a bottom, as of last month, and a big technical break of the downtrend, arguably leading the patterns we’re seeing in U.S. and Japanese stocks.  For how you can play it:  Here are some ETFs that track Chinese stocks.

Join me here to get my curated portfolio of 20 stocks that I think can do multiples of what broader stocks do, coming out of this market correction environment.

February 12, 5:00 pm EST

Yesterday we talked about the big trend break in the S&P 500 and the big 200-day moving average hurdle, above.  Today we closed right on that 200-day moving average.

Here’s an update of the chart …


With this momentum, the chart tonight to watch is in Japan.  Here’s a look at Japanese stocks.  

As you can see, U.S. stocks have broken the downtrend of the past quarter, but Japanese stocks have yet to follow.  The Nikkei remains 15% off of the highs of October.  But with the strength in U.S. stocks today, we may get the breakout in Japanese stocks tonight, ahead of Japanese Q4 GDP (which is due tomorrow night). These are some ETFs that track the Nikkei. We own DBJP in my Forbes Billionaire’s Portfolio, an ETF that tracks the dollar-denominated Nikkei.  

Join me here to get my curated portfolio of 20 stocks that I think can do multiples of what broader stocks do, coming out of this market correction environment.

February 9, 5:00 pm EST

It’s a fairly light data week this week.  And we’re in the final stretch of Q4 earnings season, which has been good, despite a bad stock market for the quarter.

As for stocks, after a very huge bounce back in January, February has been flat.

But we’re working on this chart … 

As you can see, the S&P 500 has broken out of the downtrend that started October 3rd, but has failed (thus far) at the 200-day moving average (the purple line).  That 2,742 level is a key area to overcome for a return back to the levels of December 3.  That would complete this V-shaped recovery (about 3.5% higher than current levels).

Mnuchin and Lighthizer are in China this week.  So we’ll get more information on the U.S./China trade front.  However, it now looks like the March 1 trade truce deadline will be pushed back.  And maybe the whole thing culminates with a meeting between Trump and Xi at Mar-A-Lago next month.

Perhaps a good signal, after the holiday week in China for the Lunar New Year, Chinese stocks opened the week strong.  The index that tracks smaller cap stocks and higher risk tech names jumped 3.5%, for the biggest two day gain since early October.  Broad stocks in China are now up 9% from the January lows.

Join me here to get my curated portfolio of 20 stocks that I think can do multiples of what broader stocks do, coming out of this market correction environment.