
|
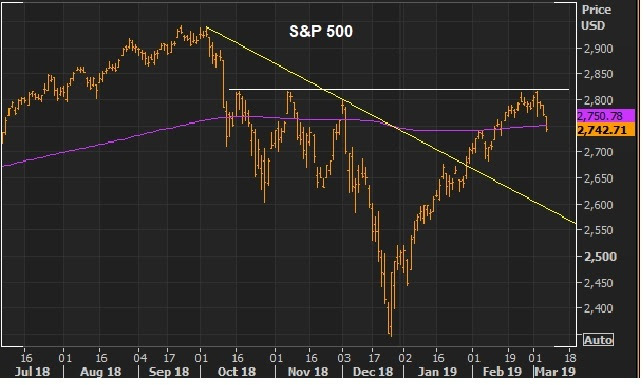
March 7, 5:00 pm EST Stocks continue to back off after completing a full recovery of the December declines. Here’s another look at the chart we observed on Monday, where you can see the big technical area of resistance (three prior highs) — and today we close back on the 200-day moving average (the purple line). |
 |
|
As we discussed on Monday, the failure of this level shouldn’t be too surprising, as a reasonable technical area to take some profits. As stocks slide back, the media is quick to turn the attention back toward fears of global economic slowdown. What’s the big difference between now and December? The Fed has moved from telegraphing rate hikes to ‘neutral’ and sitting/watching. The PBOC (central bank in China) has done more to stimulate their economy (to incentivize bank lending) and this morning, the ECB has come in with more easy money policies. Both the Fed and ECB were pre-emptive shots. Like 2016, the response from central banks has been aggressive and coordinated to ward off slowdown and/or a stock market destabilization. That recipe worked well in 2016. I suspect it will work well this year. Join me here to get my curated portfolio of 20 stocks that I think can do multiples of what broader stocks do, coming out of this market correction environment. |