March 20, 5:00 pm EST

The Fed met today and confirmed the signaling we’ve seen since early January.

With the luxury of solid growth, low unemployment and subdued inflation, they have been signaling to markets, since January, that they will do nothing to rock the boat.  That move has restored confidence and stock prices (a reinforcing loop).

So, the Fed has gone from mechanically raising rates (as recently as December) to sitting on their hands.  And today they are forecasting no further rate hikes this year, and they are ending the unwind of their balance sheet in September (ending quantitative tightening).

This all looks like a move to neutral, but given the rate path they had been telegraphing up until the end of last year, this pivot is effectively easing — especially since these moves look like pre-emptive strikes against the potential of Brexit and U.S./China trade negotiations going bad.

With that, we have a big technical break in the bond market today.  The U.S. 10-year government bond yield (chart below) broke this important trendline today.


This trendline represents the “normalization” of market rates following the Trump election.  Following the election, with the optimism surrounding Trumponomics, the market started pricing OUT the slow post-recession economic growth rut, and pricing IN the chance that we could see a return to sustained trend growth.

So, what is it pricing in now?  I would say its pricing in the worst-case scenario – a no deal with China.

Join me here to get my curated portfolio of 20 stocks that I think can do multiples of what broader stocks do, coming out of this market correction environment.

March 18, 5:00 pm EST

Stocks open the week in breakout mode.

We’ve now taken out the December highs, the levels that preceded the sharp 20% plunge.

So, now we have this chart as we enter a week with a Fed meeting on the agenda.


This leaves us up 13% on the year, and with another 4% climb to regain the October all-time highs.

The Fed meets this week.  With a relatively light data and news week, the Fed will get plenty of attention.  But remember, we know exactly where they stand.  They want to maintain confidence in the economy.  And they know the stock market is an important contributor (and can be a dangerous detractor) to confidence.  They need stocks higher.

That’s why on January 4th, the Fed responded to the plunging stock market by marching out the current and past two leaders of the Fed to tell us the “normalization phase” on interest rates was over (i.e. no more rate hikes).

And that’s why on March 10th (just a week ago), in response to a 4% one-day plunge in Chinese stocks and some loss of momentum in the U.S. stock market rebound, Powell followed the script of his predecessor Ben Bernanke, and spoke directly to the public through an exclusive 60 Minutes interview, to reassure the public that the economy was in good shape, and that the Fed was there to ensure stability.  If you bought stocks after both interviews, you felt no pain and have been rewarded handsomely.

With the above chart in mind, below is the chart we looked at to start the year, as we discussed the potential for a V-shaped recovery following the Fed’s January 4th strategic pivot.

From my January 4th Pro Perspectives note:
“We entered the year with the idea that the Fed would need to walk back on its rate hiking path this year (possibly even cutting, if the stock market environment persisted).  And today, just days into the new year, we get the Fed Chair Powell, former Fed Chairs Yellen and Bernanke telling us that the Fed is essentially done of the year, unless things improve … [as for stocks] We broke a big level today on the way up in the S&P 500 (2520) and it looks like a V-shaped recovery is underway, to take us back to where stocks broke down on December 3rd.  That would be 12% from current levels.” So, far so good. The Fed has stabilized confidence.  The question now is, do we get a deal with China soon?  If not, we may find a rate cut, in the near future for the Fed.  The former Minneapolis Fed president, and former voting FOMC member, is calling for a cut, as a pre-emptive strike to a slowdown.Remember, 2018 was the first since 1994 that cash was the best producing major asset class (among stocks, real estate, bonds, gold).  The culprit was an overly aggressive Fed tightening cycle in a low inflation recovering economy.  The Fed ended up cutting rates in 1995 and spurring a huge run up in stocks (up 36%).

Join me here to get my curated portfolio of 20 stocks that I think can do multiples of what broader stocks do, coming out of this market correction environment.

March 14, 5:00 pm EST

Wall Street has a lot of adages that many follow, and few question (but they should).

One of them:  The bond market is smarter than the stock market.

The logic is that bond market investors are better and quicker at interpreting news and information than stock investors.  As such, the belief is that bonds will be pricing in the more probable outcome before stocks.

So, is there a signal to be taken from the behavior of the 10-year yield?  While stocks have fully recovered the losses of December, you might expect the bond market to reflect the ease in uncertainty (i.e. moving back higher, along with stocks).  But bond yields are back near the lows of early last year, and appear to be pricing OUT some (and threatening to price out all) of the optimism that followed the Trump election.


With that, at 2.60% on the U.S. 10-year government bond yield (a global benchmark interest rate), is there an element of worst-case scenario for the global economy being priced in?  I’d say with the U.S. economy growing at 3%, and stocks at these levels, even when the 10-year was at 3.25%, bonds were (to some degree) pricing the worst-case scenario.

So, why are bond yields as low as 2.60%?  Smarter market participants?  No.  It’s intervention/manipulation.  Sure, the Fed has put the brakes on its policy direction.  The ECB has reversed course on policy!  China is easing.  But, most importantly, the Bank of Japan is still executing on an unlimited QE campaign.

The Bank of Japan’s yield targeting policy gives it the license to buy unlimited assets.  They have been and will continue to buy U.S. government bonds, and they continue to be the anchor for global interest rates.  And it’s safe to say, they are acting with plenty of coordination with the other major central banks in the world (namely, the Fed).

Bottom line:  The interest rate picture is signaling one very clear action.  The Bank of Japan is still engaging in full throttle QE. 

Join me here to get my curated portfolio of 20 stocks that I think can do multiples of what broader stocks do, coming out of this market correction environment.

March 12, 5:00 pm EST

Remember, when oil prices began the fourth-quarter plunge from $76 down to as low as $42, we talked about the damage it would do to the inflation outlook, and how it may provoke a response from the Fed, which it has.

With today’s inflation data, you can see the impact of (yet another) oil price crash.  Headline inflation in the U.S. was running near 3% late last summer, the highest level since 2012. Now it’s 1.5%.


The Fed likes to talk about their assessment of inflation, excluding the effects of volatile oil prices. But they have a record of acting on monetary policy when oil is moving, especially in this post-crisis environment where deflation has been a persistent threat throughout.  They acted in 2016.  And they’ve acted in 2019.

Why?  They have the tools to deal with inflation.  They raise rates.  But the tools are limited to deal with deflation.  They cut rates.  But when rates hit zero, they have to get creative (like QE, negative rates, etc.).  And the consequences of losing the deflation battle are big.  When people hold onto their money thinking things will be cheaper tomorrow than they are today, that mindset can bring the economy to a dead halt. It’s a formula that can become irreversible.

So, we can see why the Fed has been pro-active in response to falling oil prices, falling stocks and falling inflation.  It can all lead to falling confidence.  And that can put them in the position of fighting the dangerous spiral of deflation.

That said, oil is on the rebound.  And as we discussed last month (here), with the quieting of controversy surrounding the Saudi government, it looks like a V-shaped recovery could be in store for oil prices (as we’ve seen with stocks).

Join me here to get my curated portfolio of 20 stocks that I think can do multiples of what broader stocks do, coming out of this market correction environment.

March 7, 5:00 pm EST

Stocks continue to back off after completing a full recovery of the December declines.

Here’s another look at the chart we observed on Monday, where you can see the big technical area of resistance (three prior highs) — and today we close back on the 200-day moving average (the purple line).

As we discussed on Monday, the failure of this level shouldn’t be too surprising, as a reasonable technical area to take some profits.

As stocks slide back, the media is quick to turn the attention back toward fears of global economic slowdown.  What’s the big difference between now and December?  The Fed has moved from telegraphing rate hikes to ‘neutral’ and sitting/watching.  The PBOC (central bank in China) has done more to stimulate their economy (to incentivize bank lending) and this morning, the ECB has come in with more easy money policies.  Both the Fed and ECB were pre-emptive shots.

Like 2016, the response from central banks has been aggressive and coordinated to ward off slowdown and/or a stock market destabilization.  That recipe worked well in 2016.  I suspect it will work well this year.

Join me here to get my curated portfolio of 20 stocks that I think can do multiples of what broader stocks do, coming out of this market correction environment.

March 5, 5:00 pm EST

There’s a lot of excitement about the building IPO docket for the year.  Let’s take a look of the lay of the land …

There is said to be more than 220 companies planning to go public in 2019.

On Friday, Lyft filed an S1 with the SEC (a prospectus like document) in preparation for an IPO.  This will be the first Silicon Valley darling to go public this year.

Lyft is the second largest ride-sharing company — owns about a third of the U.S. market, with Uber owning the rest.  Uber is expected to go public this year.  The other big ones coming:  Airbnb, WeWork and Palantir.

We’ve clearly had a boom cycle in Silicon Valley over the past decade.  But are these IPOs coming late the party?

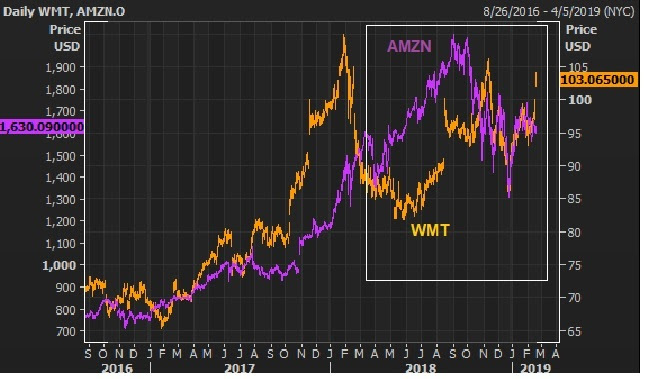
Remember, we have an administration in Washington that has tightened the regulatory screws on the dominant publicly-traded tech giants (Facebook, Amazon, Google).  The regulatory tailwinds (or lack thereof) that they enjoyed along the path of their disruptive growth, have now turned into headwinds.  And the stocks have all been hit, as a result.

Keep in mind, the private market valuations were pumped-up in these IPO candidates when public equity markets were offering little optimism about future returns.  With that, pension money was flowing into the coffers of Silicon Valley private equity firms.  And private equity fund managers were throwing money at things — and companies have been burning through that money, ramping staff, buying fancy offices and inundating us with blitz advertising campaigns.

Safe to say there has been an overhyping of the term “disrupters.”  In many cases, we’re looking at startups trying to underprice and outspend (with our pension money) in a traditional business, without having the hurdle of making money (maybe ever).  Not surprisingly, there have been market share wins.

But public companies tend to be held to a standard: profitability.  We’ll see how they do with the shifting market environment (i.e. late cycle Silicon Valley).

Lyft will be an early indicator.  Its last private investment valued the company at $15.1 billion.  For that, in their filing, they revealed a company doing a little over $2 billion in revenue, while losing almost a billion dollars last year.  Revenue growth has been slowing, losses have been widening as the private equity investors attempt to cash out in the public markets.

Join me here to get my curated portfolio of 20 stocks that I think can do multiples of what broader stocks do, coming out of this market correction environment.

March 4, 5:00 pm EST

Stocks sold off sharply this morning, before bouncing nicely from the lows.   The range on the day was the third largest of the year.

The question:  Was the selling today technically-driven or was there a catalyst that introduced new risk into the market (i.e. something bigger)?

Let’s take a look at the chart …

With this sharp V-shaped recovery of the past two months, we have stocks testing these highs, and failing today.

But the failure of this level (for the moment) shouldn’t be too surprising.  Following a runup of 20%, for some this is a reasonable technical area to sell some/ to take profit.

But is there more to the sell-off this morning?

We did get an announcement that the Congressional Judiciary Committee has launched an investigation into the Trump administration.  It includes document requests from 80 people/entities tied to the administration.  They will be looking at obstruction of justice, public corruption and abuse of power (the latter of which, might be the most subjective and, therefore, threatening).

After all of the allegations and political mudslinging surrounding Trump, could this pose the biggest risk to the Trump administration and policymaking yet?  Possibly.

Congress has a unchallengeable investigatory and subpoena power.  They can dig as deeply and broadly as the want, and create as much havoc as they want, which means this may dominate what happens on Capitol Hill until the 2020 election.

Now, with all of this said, if we look at the market reaction today, as a proxy for how the market is digesting this — we did not see across the board selling.  That’s good.  If we look inside the U.S. stock market, most active stocks were a mix of up and down on the day (including up days Apple, Facebook, Baba and Amazon).  That’s good.  And foreign stocks were less impacted by the early swing in U.S. stocks.  That’s good. The emerging market futures index MXEF actually finished at the New York close UP from Friday’s close.

Join me here to get my curated portfolio of 20 stocks that I think can do multiples of what broader stocks do, coming out of this market correction environment.

February 22, 5:00 pm EST

As the anticipation has grown on a structural reform agreement between the U.S. and China, we’ve talked about what might be the leading indicators that China will make the necessary concessions to get something done.

Remember, by the end of last year, much economic data in China was running at or worse the 2009 levels (the depths of the global economic crisis).  Clearly, they are in trouble.  As for Chinese stocks, an ugly bear market of was triggered in early 2018 when Trump’s rhetoric turned into action.  He slapped tariffs on washing machines and solar panels (a signal of bark and bite).

But as we know, by December the spiraling data in China also began taking a big toll on global markets.  With this, we’ve had responses from global central banks, including in China.

Now, Chinese stocks have been important to watch, for clues on: 1) are they doing enough to stimulate the struggling economy, and 2) (more importantly) are they taking serious steps to get to an agreement on trade with the U.S.?

With the above in mind, Chinese stocks bottomed on January 4th. That was when China and the United States announced they would hold trade talks in Beijing that following week.  That announcement represented the re-opening of trade talks, and the potential of an end to the trade war – which was a welcomed relief signal.

Chinese stocks have since represented an important signal in the recovery in global stocks.  On that note, the Shanghai Composite is now up 15% from the January 4th bottom. So, the signal has been good.  And as you can see in the chart below, we’re trading through the 200 day moving average (the purple line).

Another spot we’ve been watching in my Pro Perspective notes has been China’s currency.

China’s currency (the yuan) ends the week near its strongest levels since July.  This is China’s attempt to show the Trump administration that they are willing to make concessions on the all-important currency (the tool that has driven the massive trade disparity and wealth transfer of the past three decades).

As we head into the weekend, we have these two “leading indicators” supporting what has been maybe the most optimistic tone we’ve heard yet on an agreement.  It was announced this afternoon that the head Chinese trade negotiator would be extending his trip to Washington through the weekend.

Join me here to get my curated portfolio of 20 stocks that I think can do multiples of what broader stocks do, coming out of this market correction environment.

February 18, 5:00 pm EST

We had a big earnings report from Walmart today.

Last summer we talked about the huge divergence in the performance of Amazon (the world’s biggest company by market cap) and Walmart (the world’s biggest company by revenue).

Let’s take another look …

As we discussed, the market was pricing Amazon like a runaway monopoly — killer of all industries, especially retail.  And the perception has been that Walmart was destined to become another rise and fall story of a dominant American retailer.

But there was a clear and new catalyst that entered. Trump had made it very clear that he was, not only looking to balance the playing fieldglobally, but also domestically.  And that meant, the tech giants were due for some regulatory headwinds.  Amazon has been in the crosshairs, and still is.

As such, as I said last summer, this chart below was becoming the proxy for the domestic “rebalancing” — where the foot is being lifted from the jugular of the old economy survivors.


With today’s big Q4 earnings report from Walmart, we now have this chart.  

As you can see, the jaws have closed, albeit mostly driven by the resurgence of Walmart.  This spread trade was good for about 25% since June.  Amazon was 4.3 times the size of Walmart.  Now its about 2.5 times as big.

And this convergence should continue to have legs, not just because of the pressure from Washington on Amazon, but also because of the competitive moves made by Walmart, that may be finally garnering some respect on Wall Street.

Walmart has been aggressively investing in online. They bought Jet.com in 2016, an American online retailer.  That same year they took a large stake in the number two online retailer in China, JD.com.  Walmart now owns 12% of JD.

JD.com already has a big share of ecommerce in China.  They are number two to Alibaba, but gaining ground due to some clear competitive advantages.  JD owns and controls its logistics infrastructure, and does quality control from the supplier to delivery.  And unlike Alibaba, JD sources product to its warehouses to fight the counterfeit goods risk – a big problem in China. JD has 500+ warehouses around the country, and they now source product and service customers from one of the 433 Walmart stores in China.

So Walmart is positioned well to take advantage of the growth in the middle class in China.  Amazon has yet to find its way in China.  It has about 1% market share.   Add to this, Google came in last year with a $550 million investment to help position JD to challenge Alibaba and Amazon on a global scale.

Join me here to get my curated portfolio of 20 stocks that I think can do multiples of what broader stocks do, coming out of this market correction environment.

February 14, 5:00 pm EST

A big miss on retail sales this morning sent stocks sharply lower, initially.

This type of reaction presents a perfect opportunity to add at cheaper levels.  Remember, this is old data, from December (delayed due to the government shutdown).  And we know what was going on in December.  Stocks were hammered.  The government was heading toward a shutdown (which happened toward the end of the month).  And the Fed raised rates right into it.  It was a sentiment storm.

What is significantly correlated to sentiment?  Retail sales.

Here’s a look at the dip in both …


The number this morning has already triggered downgrades in fourth quarter growth estimates.

The good news:  This will also further drive down expectations for Q1 growth.

I say good news, because these sentiment driven indicators have a long history of short-term swings, and can bounce back very quickly.  Remember, since December, we now have a near full retracement in stocks, a Fed on hold (and a  more acommodative global central bank stance), and a somewhat more optimistic geopolitical outlook.

So, we’re setting up for positive surprises in the economic data for Q1.  Positive surprises are fuel for stocks.

Join me here to get my curated portfolio of 20 stocks that I think can do multiples of what broader stocks do, coming out of this market correction environment.