April 11, 5:00 pm EST

As we came into the week, the economic, political and corporate calendar was relative light.  With that, I suspected markets would be relatively quiet.

Of course we have had an ECB meeting and minutes from the Fed.  Often, these would be market moving events.  Not this week.  As we discussed yesterday, we clearly know where they stand.

So, what’s next?  Earnings.

First quarter earnings season kicks off next week.  We’ll hear from the major banks.  Earnings will be the catalyst for where stocks go from here – and banks will set the tone.   The building theme has been “earnings recession.”

After 20%+ earnings growth in 2018, following a historic corporate tax cut, anyone would expect earnings growth to be less hot than last year.  Some were even predicting that the hot numbers of last year would be a peak in earnings growth.  After all, under ordinary circumstances (in a stable economic environment) we’re very unlikely to see the U.S. stock market grow earnings by excess of 20%.  That’s not much of a story .

But the media loved the shock value of the phrase “peak earnings” last year, and ran it in headlines, conveniently excluding the word “growth.”  Peak earnings is very different than peak earnings growth.

Still, the broad market sentiment on future corporate earnings eroded through the end of 2018, and has continued to erode through 2019.

And both Wall Street and corporate America are more than happy to ride the coattails of lower sentiment by lowering the expectations bar on earnings.  When sentiment is leaning that way already, there is little-to-no penalty for lowering the bar.  That just sets the table for positive surprises.  They did it for Q4 2018 earnings.  And they beat expectations.  And they have set the table for positive surprises for Q1 2019 earnings.

Just how low has the bar been set for Q1?

Before stocks unraveled in December, Wall Street was looking for 8.3% earnings growth for 2019.  Now they are looking for less than half that.  Moreover, they have projected earnings to contract in Q1 compared to the same period a year ago (i.e. at least a short-term peak in earnings).
Will they be right?
Well, the Atlanta Fed’s real-time model for estimating GDP has Q1 GDP coming in at 2.3%.  The economy added on average 173,000 jobs a month over the first quarter.  Both manufacturing and services PMIs expanded in the quarter, and stocks fully recovered the losses from December. That’s a formula for earnings growth, no contraction.

If you haven’t signed up for my Billionaire’s Portfolio, don’t delay … we’ve just had another big exit in our portfolio, and we’ve replaced it with the favorite stock of the most revered investor in corporate America — it’s a stock with double potential.

Join now and get your risk free access by signing up here.

April 10, 5:00 pm EST

The minutes were released from the March Fed meeting today.  But we already know very clearly where they stand.

Remember, they spent the better part of the first three months of the year marching out Fed officials (one after another) to give us a clear message that they would do nothing to kill the economic recovery.

Just in case there was any question, Jay Powell stepped in just ahead of the March Fed meeting with an exclusive 60 Minutes interview, where he spoke directly to the public, to reassure everyone that the economy was in good shape, and that the Fed was there to promote stability (i.e. rates on hold and even prepared to act if the environment were to turn for the worse).

As expected, the ECB echoed that position today, following their meeting on monetary policy.  As we’ve discussed, the major global central banks have again coordinated both messaging and policy to ward off an erosion of confidence in the global economy.   No surprises.  And I’m sure managing the U.S. 10-year yield has been part of that coordinated response.  In addition to the speculative flows that have pushed yields lower, I suspect there has been a healthy dose of central bank buying (Bank of Japan and others through sovereign wealth funds).

With that, even though stocks have bounced back, commodities are on the move, and we’ve had improvements in global economic data, we still have European 10-year yields (Germany) at zero and U.S. yields at 2.50%. That is promoting the global central bank stability plan.

Sign up to my Billionaire’s Portfolio and get my market beating Billionaires Portfolio … Live Portfolio Review conference calls … Weekly notes with updates and specific recommendations on following the best billionaire investors …  Access to my member’s only area on the Billionaire’s Portfolio.  Plus, my blog — full of information that will set you apart from other average investors.

Join now and get your risk free access by signing up here.

April 9, 5:00 pm EST

A key piece in the continuation of the global economic recovery will be a weaker dollar.  It will drive a more balanced U.S. and global economy, and it will reflect strength in emerging markets (i.e. capital flows to emerging markets).

To this point, as we’ve discussed, higher U.S. rates have meant a stronger dollar.  With global central banks moving in opposite directions in recent years, capital has flowed to the United States.  But the emerging markets have suffered under this dynamic.  As money has moved OUT of emerging market economies, their economies have weakened, their currencies have weakened, and their foreign currency denominated debt has increased.

But now we have a retrenchment from the Fed.  And we have coordinated global monetary policy (facing in the same direction).

This sets up to solidify a long-term bear market for the dollar.

Let’s take a look at a couple of charts that argue the long-term trend is already lower, and the next leg will be much lower.

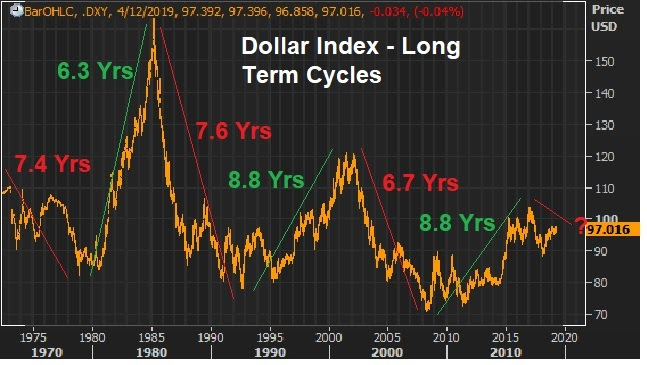
First, here’s a revisit of the long-term dollar cycles, which we’ve looked at quite a bit in this daily note.

Since the failure of the Bretton-Woods system, the dollar has traded in six distinct cycles – spanning 7.6 years on average.  Based on the performance and duration of past cycles, the bull cycle is over, and the bear cycle is more than two years in.

With this in mind, if we look within this current bear cycle, technically the dollar is trading into a major resistance area – a 61.8% retracement.  The next leg should be lower, and for a long period of time. 

Trump wants a weaker dollar, and I suspect he’s going to get it.

Sign up to my Billionaire’s Portfolio and get my market beating Billionaires Portfolio … Live Portfolio Review conference calls … Weekly notes with updates and specific recommendations on following the best billionaire investors …  Access to my member’s only area on the Billionaire’s Portfolio.  Plus, my blog — full of information that will set you apart from other average investors.

Join now and get your risk free access by signing up here.

April 8, 5:00 pm EST

As we discussed on Friday, the overhang of risks to markets, to the Trump administration and to the economy are as light as we’ve seen in quite some time.

With this in mind, we have a fairly light data week – which means the likelihood of a disruption in the rise in stocks and risk appetite remains low.

We get some inflation data this week, which should be tame, justifying the central bank dovishness we’ve seen in recent months.  The ECB meets this week.  They’ve already walked back on the idea that they might hike rates this year.  Expect Draghi to hold the line on that.  The Chinese negotiations have positive momentum, with reports over the weekend that talks last week advanced the ball.  And we have another week before Q1 earnings season kicks in.

So, expect the upward momentum to continue for stocks.  Just three months into the year and stocks are up big, and back near record highs in the U.S..  The S&P 500 is up 15% year-to-date.  The DJIA is up 13%.  Nasdaq is up 20%.  German stocks are up 13%.  Japanese stocks are up 11%.  And Chinese stocks are up 32%.

Remember, we’ve talked about the signal Chinese stocks might be giving us, putting in a low on the day the Fed did it’s about face on the rate path, back on January 4th.

The aggressive bounce we’ve since had in Chinese stocks appears to be telegraphing the bottoming in the Chinese economy   That’s a big relief signal for the global economy.  Commodities prices are supporting that view (sending the same signal).  Oil is now up 42% on the year.  And the CRB industrial metals index is up 24%.

Sign up to my Billionaire’s Portfolio and get my market beating Billionaires Portfolio … Live Portfolio Review conference calls … Weekly notes with updates and specific recommendations on following the best billionaire investors …  Access to my member’s only area on the Billionaire’s Portfolio.  Plus, my blog — full of information that will set you apart from other average investors.

Join now and get your risk free access by signing up here.

April 4, 5:00 pm EST

The slowdown in China spooked global markets late last year, and have since spooked global central banks. 

Given the current recession-like growth in China (6%ish), and the prospects that it could keep sliding, especially if a U.S./China trade deal doesn’t materialize, the major central banks in the world have positioned for the worst case scenario.

In the process, we may have discovered the real drag on the Chinese economy.

Here’s the latest look at the Shanghai Composite, up 33% since January 4th (which not so coincidentally is the day the Fed walked back on its rate hiking path).

Maybe the easiest message to glean from this chart, and that turning point, is that the biggest culprit in the China slowdown has been the Fed, not tariffs.

Here’s how the Dallas Fed put it in a report from October 3rd (which happens to be the high in stocks, the day stocks turned):

Emerging economies have suffered a general decline in forecast GDP growth, and inflation rose in a handful of countries. The tightening of monetary policy in advanced economies, both through rate hikes and other policy actions such as forward guidance, results in capital outflows from emerging economies with low reserves relative to their foreign debt.”  

Higher U.S. rates has meant a stronger dollar.  With the economy moving north, the dollar moving north and rates moving north, global capital flows to the U.S. — and away from riskier emerging markets.  It’s not that the U.S. economy can’t handle a 3.25% ten-year yield or a 5% mortgage rate in the domestic economic environment.  It’s the EM world that can’t handle it (at the moment).

China has responded to the growth slowdown with an assault of monetary and fiscal stimulus.  But the most powerful stimulus appears to have been the move by the Fed to stand-down.

Join me here to get my curated portfolio of 20 stocks that I think can do multiples of what broader stocks do, through the end of the year.

April 2, 5:00 pm EST

Oil is one of the biggest movers of the day, now back above $60.

That’s nearly 50% higher from the lows of late December.

Is that surprising?  It shouldn’t be.  Declines in both stocks and oil (late last year) were triggered by threats of sanctions on Saudi Arabia.  We talked about it as it transpired in these daily notes. The stock market decline started on October 3rd when headlines hit that implicated the Saudi Crown Prince in the murder of the journalist, Jamal Khashoggi.  Oil topped the same day, and then accelerated the day Trump spoke with the Saudi Crown Prince on the phone on October 16. Oil opened that day at $72 and hasn’t seen the level since (forty-three days later it was trading at $42).

The Saudi capital flight threat dissolved as it became clear later in the year that the U.S. would sanction Saudi individuals only — and not the Crown Prince, nor the government.  Sill those geopolitical risks early on, soon turned into eroding sentiment — as lower stocks, feed weaker confidence.

But we’ve had a full “V-shaped” recovery in stocks.  And I’ve suspected we would see the same in oil prices. And the catalyst has been a coordinated response from global central banks, not too dissimilar from what we saw in 2016, following another oil prices crash.  Oil and stocks rallied aggressively back then.  And we’re seeing a similar result this time.

Remember, we looked at this chart back in February…


Here is a look at the chart now as crude continues to recover the declines of late last year (working toward completing the “V”)…

Join me here to get my curated portfolio of 20 stocks that I think can do multiples of what broader stocks do, through the end of the year.

April 1, 5:00 pm EST

Last week we talked about the buildup to the Lyft IPO.

Lyft, “lifted” to a valuation of close to $25 billion when shares started trading on Friday.  Today, it’s down as much as 20% from the Friday highs.

The last private investment valued the company at $15.1 billion.  That gave them a paper gain of over 60% on Friday, for just a 9-month holding period. Good for them.

For everyone else, remember, you’re looking at a company that did a little over $2 billion in revenue, while losing almost a billion dollars. Most importantly, over the three years of data that Lyft shared in its S-1 filing, revenue growth has been slowing and losses have been widening.

So, you’re buying a company that hopes to be profitable in seven years, to justify the valuation today.  This is a company that has only existed seven years.  And to think that we can predict what the next seven will look like, in the ever changing technology and political/regulatory environment (much less economic environment), is a stretch.

For some perspective on these valuations, below is what it looks like if we compare the three largest/dominant car rental car companies (Enterprise, Hertz and Avis) to the two largest/dominant ride sharing companies.


With Uber now expected to be valued at around $120 billion when it goes public (possibly this month), the ride sharing industry is valued at about 14 times the car rental industry.

The rental car industry has been priced as if ride-sharing industry has destroyed it.  Ironically, if the ride sharing movement is to succeed in the long-run, and is to fully reach the potential that is being priced into the valuations, then they will need these car rental companies to supply and manage the fleet of vehicles required for Uber and Lyft to scale.

Join me here to get my curated portfolio of 20 stocks that I think can do multiples of what broader stocks do, through the end of the year.

March 29, 5:00 pm EST

We’ve talked about the prospects of a repeat of 1995, when the Fed flip-flopped — cutting rates, following an overly aggressive tightening cycle. Stocks soared.

With that in mind, in addition to the about-face the Fed has done over the past three months, verbally managing down expectations on rates, we’ve since heard from (effectively) the White House, calling for “an immediate 50 basis points cut.”

Trump has selected Stephen Moore as an nominee for the Fed.  He publicly called for the 1/2 point cut this week.  And today, Larry Kudlow, the White House Chief Economic Advisor, said the same.

The Fed wants ammunition if a U.S. slowdown occurs (as damage control).  The White House wants a cut to “protect” the current growth — i.e. to pre-empt a slowdown (prevent the damage).

This comes following a weaker final Q4 GDP number, which dropped full year 2018 growth just below 3% (2.9%).  And the reality is, Q1 won’t be a big number (thanks in part to the sentiment scars from the Q4 stock market decline). It looks like 1.5% at the moment.  That would be the slowest growth since Q1 2016.

Are the calls for a cut from the White House coming because they don’t think a China deal will happen?  Possibly.  More likely, the Trump administration wants the spigot open, to fuel economic momentum into the 2020 election.  Why not press the accelerator, given the continued tame inflation environment and softness in Europe and China?

Join me here to get my curated portfolio of 20 stocks that I think can do multiples of what broader stocks do, through the end of the year.

March 28, 5:00 pm EST

Earlier this month, we talked about the big IPO agenda this year.

We have some big Silicon Valley “disrupters” set to go public this year, including Lyft, Uber, WeWork and Airbnb.

Lyft will IPO tomorrow.  The expectations is for a $20+ billion valuation.

The company has raised $4.9 billion in the private market since launching in 2012.   A little more than a year ago, it raised money at an $11 billion valuation.  If you were the investor at that stage, you’re looking at a double when it goes public (just 15-months later).

Now, if you are joe-average investor, as a buyer of Lyft shares, you’re about to pay these early private market investors at a $22 billion valuation.  This is a company that did about $2 billion in revenue last year, and lost about a billion dollars.

Remember, while the founders of these companies will become celebrated billionaires, the investors that buy these shares in the public market don’t tend to get rewarded very well.  Of course, there are exceptions, but remember, the IPOs this year are coming into a far less friendly regulatory environment than their “disrupter” predecessors of the past decade.

The reality:  The hyper-growth valuations are unlikely to get hyper-growth, as the regulatory advantages Silicon Valley has enjoyed over the past decade are now being scrutinized by Washington.

Here’s how the big “disrupters” of the past two years have fared, after much anticipated IPOs.

Dropbox:  Dropbox was priced at $21 per share.  It started trading at over $28.  Today it trades at $22.

Spotify:  Priced at $165.90 per share.  It started trading at $164.  It currently trades at $137.

Snap: Priced at $17 per share.  It started trading at $22.  Today it trades at $10.80.

After Lyft, Uber is on deck.  Uber last raised venture capital at a $68 billion valuation.  They are expected to go public at a $120 billion valuation.

Join me here to get my curated portfolio of 20 stocks that I think can do multiples of what broader stocks do, through the end of the year.

March 26, 5:00 pm EST

Yesterday we talked about the yield curve inversion.

It was driven by the Fed walking up the fed funds rate (i.e. “normalizing rates”) over the course of the past three years.  As we discussed yesterday, with global central banks pinning down the long-end of the yield curve through QE (now led by the BOJ), there were few things better telegraphed than the U.S. yield curve inversion.

The market is now pricing in a 66% chance of a rate cut by the end of the year.  The market is arguing that the rate hike the Fed made in December, was a mistake.

When have we seen this script before?  1995.  As we discussed coming into the year, 2018 was the first year since 1994 that cash was the best producing major asset class (among stocks, real estate, bonds, gold).  And the culprit was an overly aggressive Fed tightening cycle in a low inflation recovering economy.

The Fed ended up cutting rates in 1995 and spurring a huge run up in stocks (up 36%).  That’s the bet people are making again.  But I suspect we’ve already seen the equivalent of a cut through the Fed’s dovish posturing since early January.  Remember, they went on a media blitz the first several days of January, dialing down expectations that there would be any more tightening.

Join me here to get my curated portfolio of 20 stocks that I think can do multiples of what broader stocks do, through the end of the year.