At the end of last week, I said “it looks like the all-clear signal has been given to stocks.”
Well, we had some more discomfort to deal with this week, but that statement probably has more validity today than it did last Friday.
With that, let’s review the events and conditions of the past two weeks, that build the case for that all-clear signal.
As of last Friday, more than half of first quarter corporate earnings were in, with record level positive surprises in both earnings and revenues (that has continued). And we got our first look at first quarter GDP, which came in at 2.3%, better than expected, and putting the economy on a 2.875% pace over the past three quarters.
What about interest rates? After all, the hot wage growth number back in February kicked the stock market correction into gear. The move in the 10-year yield above 3% last week started validating the fears that rising interest rates could quicken and maybe choke off the recovery. But last week, we also heard from the ECB and BOJ, both of which committed to QE, which serves as an anchor on global rates (i.e. keeps our rates in check).
Fast forward a few days, and we’ve now heard from the last but most important tech giant: Apple. Like the other FAANG stocks, Apple also beat on earnings and on revenues.
Still, stocks have continued to trade counter to the fundamentals. And we’ve been waiting for the bounce and recovery to pick up the pace. What else can we check off the list on this correction timeline? How about another test of the 200-day moving average, just to shake out the weak hands? We got that yesterday.
Yesterday, in the true form of a market that is bottoming, we had a sharp slide in stocks, through the 200-day moving average, and then a very aggressive bounce to finish in positive territory, and on the highs of the day. That took us to this morning, where we had another jobs report. Perhaps this makes a nice bookend to the February jobs report. This time, no big surprises. The wage growth number was tame. And stocks continued to soar, following through on yesterday’s big reversal off the 200-day moving average.
With all of this, it looks like “the all-clear signal has been given to stocks.”
We talked last week about the correction underway in stocks. As I said, since 1946, the S&P 500 has had a 10% decline about once a year. And we haven’t had one in a while. Since the November 2016 election, the worst decline in stocks from peak to trough had been only 3.4%.
So we were due. And we’ve gotten it.
Today we’ve seen it accelerate. With the steep slide in stocks today, for a brief moment, the Dow futures were down 11% from the peak of just 7 days ago.
Now, let’s add a little perspective on this …
First, as I’ve said, when you are a hedge fund or trader and you’re leveraged 10, 20, 50, 100 times, then avoiding corrections or trend changes is critical to your survival. Getting it wrong, can mean your portfolio blows up and maybe goes to zero. That’s the mentality the media is speaking to, and frankly much of Wall Street is speaking to, when addressing any market decline.
The bottom line is that 99.9% of investors aren’t leveraged and should have no concern about U.S. stock market declines, other than saying to themselves: “What a gift! Do I have cash I can put to work at these cheaper prices? And, where should I put that cash to work?” As the great Warren Buffett has said, “be greedy when others are fearful.”
So, for the average investor, dips are an opportunity to buy stocks at a discount. Don’t let the noise distract you.
Remember, we’ve talked about the transition that is underway, with a global economy that now has the potential to officially exit the economic slog of the past decade, driven by pro-growth policies in the U.S. And those economic tailwinds have introduced the likelihood that the world will finally be able to exit central bank life support (i.e. QE). That’s all very positive.
But it has also been the trigger of the correction in stocks–this transition. QE has promoted higher stock prices. Now we get a correction, and a new catalyst (earnings and the growth picture) to justify the next leg of the global economic recovery (and stock bull market).
With that in mind, the fundamentals for stocks are very strong. As stocks tick down, the better valuation on stocks will only be amplified, when we get hot first quarter earnings hitting in a few months (thanks to the big corporate tax cut). For the S&P 500 P/E: We have the “P” going down, and the “E” going up.
How long could this correction last?
Remember when we were discussing the probability of a correction back in November, we looked at this chart …
In September 2014, with no significant one event or catalyst prompting it, the S&P 500 went on a slide. Stocks closed on a record high on Friday, September 19 (2014). On Monday, stocks gapped lower and over the next 18 days fell 10%. But over the following 12 days it all came back–a sharp V-shaped recovery. It was a textbook technical correction–right at 10%, right into the prevailing trend. You can see it in the chart above: the v-shaped move in stocks, and the bounce right off of the big trendline.
What’s happened in the markets the last few days reminds me of that correction. The moves can be fast, and the recovery can be fast, in this (post-crisis) environment. Big institutions have been trading stocks through computer programs for a long time, but the speed at which these algorithms can access markets and information have changed dramatically over the past decade–so has the massive amount of assets deployed through high frequency trading programs. They can remove liquidity very quickly. Combine that with the reduced liquidity in markets that has resulted from the global financial crisis (i.e. the shrinkage of the marketing making community and of hedge fund speculators, and the banning of bank prop trading) and you get markets that can go down very fast. And you get markets that can go up very fast too.
The proliferation of ETFs exacerbates this dynamic. ETFs give average investors access to immediate execution, which turns investors into reactive traders. Selling begets selling. And buying begets buying.
With the above dynamic, we’ve seen a fair share of quick declines and quick recoveries in the post-financial crisis era.
How do things look now?
In the chart above, this big trend line represents the move off of the oil crash lows of 2016. This 2560 area would give us a 10.8% correction in the S&P 500. I wouldn’t be surprised if we got there over a few days, and a recovery began. And I expect to stocks to end the year up double digits (still).
For help building a high potential portfolio, follow me in our Billionaire’s Portfolio, where you look over my shoulder as I follow the world’s best investors into their best stocks. Our portfolio of highest conviction, billionaire-owned stocks is up close to 50% over the past two years. You can join me here and get positioned for a big 2018.
This morning we got a report that smallbusiness optimism hit the second highest level in the 44-year history of the index.
Here’s a look at that history …
optimism
Remember, last year, following the election, this index that measures the outlook from the small business community had the biggest jump since 1980 (as you can see in the chart).
Why were they so excited? For most of them, they had dealt with a decade long crisis in their business, where they had credit lines pulled, demand for their products and services were crushed, healthcare costs were up and their workforce had been slashed. If they survived that storm and were still around, any sign that there could be a radical change coming in the environment was a good sign.
A year ago, with a new administration coming in, half of the smallbusiness owners surveyed, expected the economy to improve. That was the largest agreement of that view in 15 years.
They’ve been right.
Now with an economy that will do close to 3% growth this year, still, about half of small business owners expect the economy to improve further from here.
No surprise, they are more than pleased with the tax cuts coming down the pike. They’ve seen regulatory relief over the past year. And, according the chief economist for the National Federation of Independent Businesses, small business owners see the incoming Fed Chair (Powell) as more favorable toward business (and market determined decisions) than Yellen. And he says, “as long as Congress and the President follow through on tax reform, 2018 is shaping up to be a great year for small business, workers, and the economy.”
This reflects the theme we’ve talked about all year: the importance of fiscal stimulus to bridge the gap between the weak economic recovery that the Fed has manufactured, and a robust sustainable economic recovery necessary to escape the crisis era. This small business survey tends to correlate highly with consumer confidence. Consumer confidence drives consumption. And consumption contributes about two-thirds of GDP. So, by restoring confidence, the stimulative policy actions (and the anticipation of them) has been self-reinforcing.
Join our Billionaire’s Portfolio today to get your portfolio in line with the most influential investors in the world, and hear more of my actionable political, economic and market analysis. Click here to learn more.
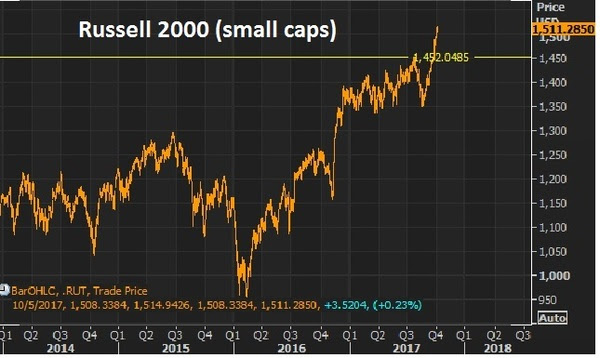
We looked at small caps last week when the the Russell 2000 broke to new highs.
Remember, at that point, small–caps had done only 9% on the year at this point. That’s against 13% for the S&P and Dow.
Here’s the chart now…
The Russell 2000 is now up 12% since the lows of August (up 11% ytd) and if you bought the small cap index on the Monday before the elections last year, you’re up 26%. But small caps continue to lag the bigger cap market. And that makes the last quarter a very intriguing opportunity to own small caps.
Bull markets tend to lift all boats. And with that, equal-dollar weighted small caps tend to outperform equal-dollar weighted large caps in bull markets (in some cases by a lot). This one (bull market) looks like plenty of room to go in that regard. And small cap companies should have more to gain from a corporate tax cut as the tend to have fewer ways to shelter income (relative to big multinationals).
Now, with that bull market assertion, let’s talk about the general uneasiness that seems to exist (and has for a while) from watching the continued climb in stocks.
As we’ve discussed, you often here the argument that the fundamentals don’t support the level of stocks. It’s just not true. The fundamental backdrop continues to justify and favor higher stocks. We have the prospects of fiscal stimulus building, which will be poured onto an already fertile economic backdrop — with low rates, cheap commodities, record consumer high credit worthiness and low unemployment.
As the old market adage goes, “bull markets are born on pessimism, grow on skepticism, mature on optimism and die on euphoria.” I don’t think anyone could argue we are currently in the state of euphoria for stocks. And as the great macro trader Paul Tudor Jones has said, “the last third of a great bull market is typically a blow-off, whereas the mania runs wild and prices go parabolic” (i.e. euphoria can last for a while).
Finally, let’s revisit this analysis from billionaire Larry Robbins on the influence of low interest rates, Fed policy and oilon markets. He says every time ONE of these (following) conditions has existed, the market has produced positive returns. Here they are:
When the 30 year bond yield begins the year below 4%, stocks go up 22.1%.
When investment grade bonds yield below 4%, stocks go up 16%.
When high yield bonds yield below 8%, stocks go up 11.6%.
When cash as a % of asset for non-financials is above 10%, stocks go up 17.6%.
When the Fed tightens 0-75 basis points in the year, stocks go up 22%.
When oil falls more than 20%, stocks go up 27.5%.
Again, his study showed that there has NEVER been a down year stocks, when any ONE of the above conditions is met.
It worked in 2015. It worked in 2016. And now, not only does ONE of these conditions exist, but ALL of these conditions are (or have been) met for 2017.
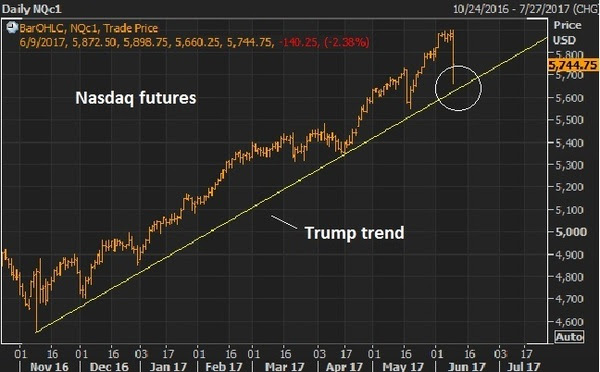
The Nasdaq trade unwound some today. From the peak this morning in the futures of 5898 the tumble started around 11am, falling to as low as 5660. That’s 238 Nasdaq futures points or 4% – quite a sharp move.
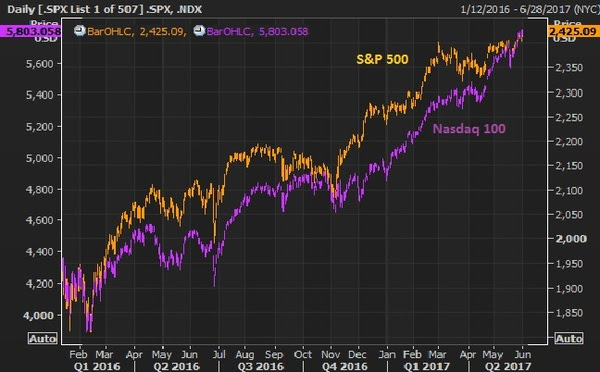
Remember, it seems like an overdone trade (driven by the big tech stocks). But as we discussed last week, the tech heavy Nasdaq has simply been a catch up trade — something that has lagged the strength in the broader market.
Here’s the chart we looked at last week.
This chart goes back to the lows driven by the oil price crash that bottomed out earlier last year.
Still, with the Nasdaq at +18% ytd and S&P 500 +9% ytd, as of this morning, as we’ve seen many times in this post-crisis era, the air pockets of illiquidity in stocks can give back gains very, very quickly. As they say, stocks go up on an escalator and down in an elevator.
The Trump trend, in the chart above, was nearly tested today — the same day a new all-time high was marked!
If we get another few days of sharp downside, it will be a tremendous buying opportunity – get your shopping list ready. And if that downside slide does indeed come, it could come at a very interesting time. It would add another (but very signficant) reason the Fed may balk on a rate hike next week. The other reasons? We discussed them yesterday (here).
Have a great weekend.
What stocks should be on your shopping list, to buy on a big market dip? Join my Billionaire’s Portfolio to find out. It’s risk-free. If for any reason you find it doesn’t suit you, just email me within 30-days.
We had a heavy event calendar last week for markets, with the Fed, BOJ and BOE meetings. And then we had the anticipation of the G-20 Finance Minister’s meeting as we headed into the weekend.
As I said to open the week last week, markets were pricing in a world without disruptions. But disruptions looked likely. Still, the week came and went and stocks were little changed on the week, but yields came in lower (despite the Fed’s third rate hike) and the dollar came in lower (again, despite the Fed’s third rate hike).
Is that a signal?
Maybe. But as we discussed on Friday, the divergence between market rates and the rate the Fed sets is part central bank-driven Treasury buying (from those still entrenched in QE — Japan, Europe), and part market speculation that higher rates are threatening to the economy, and therefore traders sell short term Treasuries (rates go higher) and buy longer term Treasuries (rates go lower). With that, the Fed has been ratcheting the Fed Funds rate higher, now three times, but the 10 year government bond yield is doing nothing.
As for the dollar, if your currency has been weak, no one wanted to head into a G-20 Finance Ministers meeting and sit across the table from the new Treasury Secretary under the Trump administration (Mnuchin) and be drawn into the fray of currency manipulation claims. With that, the dollar weakened across the board last week.
All told, we had little disruption last week, but things continue to look vulnerable this week. Today we have the FBI Director testifying before Congress and acknowledging an open investigation of Trump associates contacts with Russia during the election. Fed officials have already been out in full force today make a confusing Fed picture even more confusing. And it sounds like the UK will officially notify the EU on March 29 that they will exit.
With all of the above in mind, and given the growth policies from the Trump administration still have little visibility on “when” they might get things done, the picture for markets has become muddied.
This all makes stocks vulnerable to a correction, though dips should be met with a lot of buying interest. Perhaps the clearest trade in this picture that’s become more confusing to read, is gold.
Gold jumped on the Fed rate hike last week, and Yellen’s more hawkish tone on inflation. If she’s right, gold goes higher. If she’s wrong, and the Fed has made a big mistake by hiking three times in a world that still can’t sustain much growth or inflation, gold probably goes higher on the Fed’s self-inflicted wounds to the economy.
In our Billionaire’s Portfolio, we’re positioned in a portfolio of deep value stocks that all have the potential to do multiples of what broader stocks do — all stocks owned and influenced by the world’s smartest and most powerful billionaire investors. Join us today and we’ll send you our recently recorded portfolio review that steps through every stock in our portfolio, and the opportunities in each.
As we head into the Fed tomorrow, stocks have fallen back a bit today.
Yesterday we looked at the nice 45 degree climb in stocks since Election Day. And the big trendline that looked vulnerable to any disruption in the optimism that has led to that climb. That line gave way today, as you can see.
The run up, of course, was on the optimism about a pro-growth government, coming in after a decade of underwhelming growth. The dead top in stocks took place the day after President Trump’s first speech before the joint sessions of Congress. There is a phenomenon in markets where things can run up as people “buy the rumor/news” and then sell-off as people “sell the fact.”
It’s a reflection of investors pricing new information in anticipation of an event, and then selling into the event on the notion that the market has already valued the new information. It looks like that phenomenon may be transpiring in stocks here, especially given that the timeline of tax reform and infrastructure spending looks, now, to be a longer timeline than was anticipated early on.
And as we discussed yesterday, it happens to come at a time where some disruptive events are lining up this week: from a Fed rate hike, to Dutch elections, to Brexit, to G20 protectionist rhetoric.
Stocks are up 6% year-to-date, still in the first quarter. That’s an aggressive run for the broad stock market, and we’re now probably seeing the early days of the first dip, on the first spell of profit taking.
What about oil? Oil and stocks traded tick for tick for the better part of last year, first when oil crashed to the mid-$20s, and then when oil proceeded to double from the mid-$20s. Over the past few days, oil has fallen out of it’s roughly $50-$55 range of the Trump era. Is it a drag on stocks and another potential disrupter? I don’t think so. Oil became a risk to stocks and the global economy last year because it was beginning to trigger bankruptcies in the American shale industry, and was on pace to spread to banks, oil producing countries and the global financial system. We now have an OPEC production cut under the belt and a highly influential oil man, Tillerson, running the State Department. With that, oil has been very stable in recent months, relative to the past three years. It should stay that way – until demand effects of fiscal policy start to show up, which should be very bullish for oil.
In our Billionaire’s Portfolio, we’re positioned in a portfolio of deep value stocks that all have the potential to do multiples of what broader stocks do — all stocks owned and influenced by the world’s smartest and most powerful billionaire investors. Join us today and we’ll send you our recently recorded portfolio review that steps through every stock in our portfolio, and the opportunities in each.
Since going public last week, Snap has had a valuation north of $30 billion. It’s been getting hammered from the highs over the past couple of days. A big component to the rise of Internet 2.0 was the election of Barack Obama. With a change in administration as a catalyst, the question is: Is this chapter of the boom in Silicon Valley over? And is Snap the first sign?
Without question, the Obama administration was very friendly to the new emerging technology industry. One of the cofounders of Facebook became the manager of Obama’s online campaign in early 2007, before Obama announced his run for president, and just as Facebook was taking off after moving to and raising money in Silicon Valley (with ten million users). Facebook was an app for college students and had just been opened up to high school students in the months prior to Obama’s run and the hiring of the former Facebook cofounder. There was already a more successful version of Facebook at the time called MySpace. But clearly the election catapulted Facebook over MySpace with a very influential Facebook insider at work. And Facebook continued to get heavy endorsements throughout the administration’s eight years.
In 2008, the DNC convention in Denver gave birth to Airbnb. There was nothing new about advertising rentals online. But four years later, after the 2008 Obama win, Airbnb was a company with a $1 billion private market valuation, through funding from Silicon Valley venture capitalists. CNN called it the billion dollar startup born out of the DNC.
Where did the money come from that flowed so heavily into Silicon Valley? By 2009, the nearly $800 billion stimulus package included $100 billion worth of funding and grants for the “the discovery, development and implementation of various technologies.” In June 2009, the government loaned Tesla $465 million to build the model S.
When institutional investors see that kind of money flowing somewhere, they chase it. And valuations start exploding from there as there becomes insatiable demand for these new “could be” unicorns (i.e. billion dollar startups).
Who would throw money at a startup business that was intended to take down the deeply entrenched, highly regulated and defended taxi business? You only invest when you know you have an administration behind it. That’s the only way you put cars on the street in NYC to compete with the cab mafia and expect to win when the fight breaks out. And they did. In 2014, Uber hired David Plouffe, a senior advisor to President Obama and his former campaign manager to fight regulation. Uber is valued at $60 billion. That’s more than three times the size of Avis, Hertz and Enterprise combined.
Will money keep chasing these companies without the wind any longer at their backs? The favor in the new administration looks more likely to go toward industrials and energy. That would leave the pumped up valuations in some of these internet businesses, that operate with no real plan on how to make money, with a long way to fall.
In our Billionaire’s Portfolio, we’re positioned in a portfolio of deep value stocks that all have the potential to do multiples of what broader stocks do — all stocks owned and influenced by the world’s smartest and most powerful billionaire investors. Join us today and we’ll send you our recently recorded portfolio review that steps through every stock in our portfolio, and the opportunities in each.
Stocks are hitting new record highs today. That includes the Dow, the S&P 500 and the Nasdaq.
We’ve now seen about 60% of the earnings for Q4, and earnings are very good. As we’ve discussed, earnings guidance and consensus views are made to be beaten. Factset says that, on average, about 67% of S&P 500 companies beat the consensus view on earnings. For Q4, that number, as of last Friday, was 65%.
More importantly, the earnings growth rate for Q4 is +4.6% thus far. That’s better than the 3.1% that was predicted, coming into the earnings season. And that’s the first two consecutive quarters of year-over-year positive EPS growth in a couple of years.
So we have positive earnings surprises driving stocks higher. And finally, revenue growth is coming. After six consecutive quarters of revenue contraction, earnings for U.S. companies had a second consecutive quarter of growth. And the quarters ahead should be much better.
Clearly, in the weak growth environment, the focus has clearly been cutting costs, refinancing debt, selling non-core assets, and buying back shares. That’s all a recipe for juicing EPS, even though revenue growth is sluggish, if existent.
So for all of the people that are constantly hand wringing about the levels of the stock market, ask them this: What happens when you take these companies that are growing earnings by optimizing margins in a 1% growth world, and you give them 3%-4% economic growth? Earnings go up. What happens when you take a profitable company and cut the tax burden by 15 to 20 percentage points? Earnings go up.
When earnings go up, price to earnings goes down. And valuations can become very, very cheap.
We have companies that have been forced to streamline to survive. And now we’re in the early days of a regime shift, where tax cuts will work for them, deregulation will work for them, and a big infrastructure spend will pop demand, to actually fuel some revenue growth.
Below is a nice chart from Yardeni. You can see the flattish revenue growth, but earnings divergence over the past five years.
On the right hand axis, next year’s earnings on the S&P 500 are expected around $133. That doesn’t take into account the impact of a corporate tax cut, which Standard & Poors research has suggested could bump that number up to the mid $150s ($1.31 added for every 1% cut in the corporate tax rate). That would dramatically widen the revenue, earnings divergence — or make the closing of this gap that much more aggressive.
For help building a high potential portfolio for 2017, follow me in our Billionaire’s Portfolio, where you look over my shoulder as I follow the world’s best investors into their best stocks. Our portfolio more than doubled the return of the S&P 500 in 2016. You can join me here and get positioned for a big 2017.
We ended last week with a very strong jobs report, yet the measure of wage pressure was soft. That, for the near term, reduces expectations on how aggressive the Fed might be (but not a lot).
Still, the 10-year yield has drifted lower to start the week. It was 2.50% Friday afternoon. Today it’s closer to 2.40%. When the 10-year yield drifts lower, mortgage rates drift a little lower, back very close to 4% today. This all helps two of the most important tools the Fed has been focused on for the past eight years to drive economic recovery: stocks and housing.
The Trump administration, like the Fed, will need both stocks and housing to continue higher to maintain confidence in the economy, and in the agenda.
Now, on Friday I said Trump was hosting Japan’s Prime Minister Abe in Florida over the weekend for a round of golf at Mar-a-Lago. It looks like it’s this coming weekend, instead.
Interestingly, this comes as the Trump administration made a conscious effort on Friday to refocus the messaging from a protectionist narrative to an economic growth narrative.
Abe will be entering this meeting with President Trump under some peripheral scrutiny about trade imbalances. Japan runs about a $60 billion surplus with the United States. That’s about on par with Mexico, which has become a target for Trump in recent weeks. Still, as I said last week, it’s peanuts compared to China, and that’s where the Trump administration’s real attention lies.
Nonetheless, Abe is expected to come in with a plan to balance trade with the U.S., which includes working together on a big U.S. infrastructure program. And there is still considerable sensitivity surrounding the value of the yen (the Japanese currency).
As we know, under Abenomics, the yen has devalued by about 40% against the dollar. But as China has done often over the past decade, as they have headed into big meetings with global leaders, Japan seems to be walking its currency up in the days heading into the Abe/Trump meeting.
You can see in the chart above, the dollar has been in decline against the yen this year (the orange line falling represents a weaker dollar, stronger yen). The top in the USD/JPY exchange rate this year came when Trump’s chief trade negotiator was named on January 3rd. Robert Lighthizer worked in the Reagan administration and happened to be behind stiff tariffs imposed on Japan during that era on electronics.
Trump’s tough talk on trade, and the market’s continued focus on upcoming elections in Europe (that threaten to continue the trend of nationalism and protectionism) have stocks in Japan and Europe diverging from the strength we’re seeing in U.S. stocks. The Dow is above 20k. Meanwhile, Japanese stocks are still 10% off of the 2015 highs. German stocks are 7% off of 2015 highs.
But as I’ve said, growth solves a lot of problems. In addition to the underlying current of a better performing U.S. economy (with the pro-growth agenda in the pipeline), the data is already improving in both Germany and Japan. I suspect that Europe and Japan will soon be cleared from the fray of the trade protectionist rhetoric, and we’ll start seeing major European stock markets and the Japanese stock market climbing, and ultimately putting up a big number in 2017.
For help building a high potential portfolio for 2017, follow me in our Billionaire’s Portfolio, where you look over my shoulder as I follow the world’s best investors into their best stocks. Our portfolio more than doubled the return of the S&P 500 in 2016. You can join me here and get positioned for a big 2017.


 We looked at small caps last week when the the Russell 2000 broke to new highs.