
|


September 18, 5:00 pm EST
To the surprise of many, stocks went up. Why?
Perhaps it’s because reforming the way the world deals with China is a good thing. Remember, China’s currency manipulation over the past two decades led to the credit bubble, which ultimately led to the financial crisis. And as long as the rest of the world continues to allow China to maintain a trade advantage (dictated by their currency manipulation): 1) they will manufacture hot economic growth through exports, 2) the global cycle of booms and bust will continue, and 3) the wealth transfer from the rest of the world to China will continue.
With this in mind, as I’ve said, the trade dispute is all about China – everything else Trump has taken on (Canada, Mexico, Europe) has been to gain leverage on getting movement in China.
With Trump now making it very clear that he won’t back down until major structural change takes place in China, it’s no surprise that one of the biggest winners of the day (following the further economic sanctions on China) was Japan!
The Nikkei was up big today. And it was Japanese stocks that set the tone for global markets on the day. As a signal that China’s days of cornering the world’s export markets may be coming to an end, Japan is in position to be a big winner.
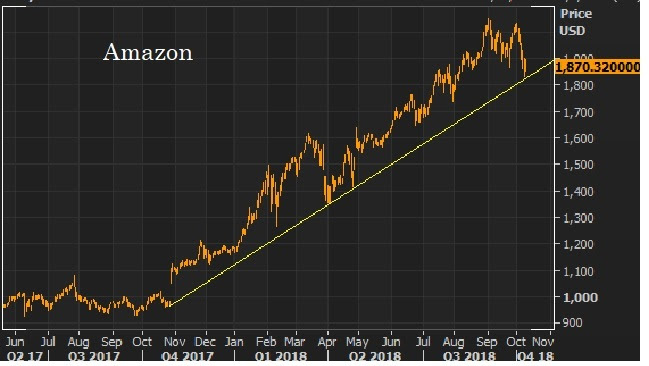
Remember, while much of the world has returned to new record highs following the global financial crisis, Japan remains 40% away from the record highs set nearly 30 years ago.
If you haven’t joined the Billionaire’s Portfolio, where you can look over my shoulder and follow my hand selected 20-stock portfolio of the best billionaire owned and influenced stocks, you can join me here.
|
August 22, 5:00 pm EST Yesterday we looked at this chart of the S&P 500 …
|
 |
|
In discussing this chart, I made an error. The blue line, of course, represents what the S&P 500 would have looked like had it continued its long-run annualized growth rate of 8% from the 2007 (pre-crisis) peak. That gives us perspective on where we stand in this stock market recovery. Even though we’re up more than four-fold from the 2009 bottom, and people continue to talk about how long this bull market has run, we still have not recovered the lost growth of the past decade. That is clearly displayed in the gap between the orange line (the actual S&P 500) and the blue line (where stocks would be had we continued along the 8% annualized path). What can we attribute this gap to? Post-recession recoveries are typically driven by an aggressive bounce-back in growth. We didn’t get it. Instead, the post-recession growth environment of the past decade was dangerously shallow and slow. Why? The Fed and other major central banks were the only game in town for the global economy over the past decade. They saved the world from a total collapse, staved off further shocks along the way, and they manufactured a recovery. But the “easy money” solution doesn’t work the same in the depths and aftermath of a global debt bust, as it does in normal recessions. The central banks could only muster stall-speed growth. That’s why the election was so important. It has resulted in the great hand-off, from a global economy that was just surviving on the life-support of central banks, to a global economy that has the chance to thrive on the catalyst of fiscal stimulus, and become sustainable from structural reform. With that, we should expect the gap in the chart above to close. That argues for much higher stock prices, and a continuation of this bull market. If you haven’t joined the Billionaire’s Portfolio, where you can look over my shoulder and follow my hand selected 20-stock portfolio of the best billionaire owned and influenced stocks, you can join me here.
|
|
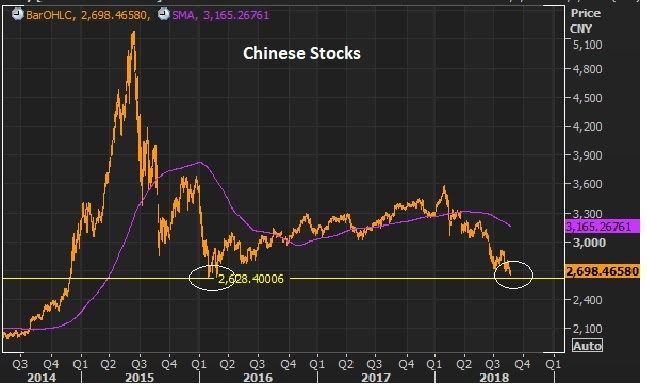
August 20, 5:00 pm EST As we discussed on Friday, with China coming back to the negotiating table on trade, we have a signal that the trade dispute smoke will not end in fire. That is unlocking this rotation we’ve been talking about for the past month or so, where the money that has been plowed into the stocks of the very hot tech giants, starts moving out and into the lagging blue chips. With that, as we sit eight months into the year, with the winds of fiscal stimulus in our sails, the S&P 500 is just now close to recovering the losses from the January highs. And the Dow remains, 3.2% off of the January highs (which were record highs). But I suspect we will now close that gap quickly. Remember, we have two very hot earnings quarters under our belt, and building momentum in the economic data, as fuel for stocks. And I suspect the China news, to break the stalemate on trade negotiations, will also fuel the resumption of the young bull market in commodities, which should offer very attractive investing outcomes in the coming months. Maybe the best signal for commodities is this chart on Chinese stocks, which looks like it may have bottomed TODAY into these 2016 lows (circled). |
 |
|
If you haven’t joined the Billionaire’s Portfolio, where you can look over my shoulder and follow my hand selected 20-stock portfolio of the best billionaire owned and influenced stocks, you can join me here.
|
July 24, 5:00 pm EST
As we’ve discussed, tech and small-caps (the Nasdaq and the Russell 2000) have been big outperformers on the year, compared to blue-chip stocks. But today seemed like an exhaustive move in that divergence.
There was a clear rotation out of the small-caps (which finished down on the day) and into the blue chips (the Dow finished up nicely on the day). And the red-hot Nasdaq reversed from new record highs to finish flat.
Trump tweeted this morning that tariffs are bringing trade parters to the negotiating table. He seems to be confident that his meeting with EU Chief Jean-Claude Juncker tomorrow will result in concessions from Europe. And there seems to be movement on a new NAFTA deal too. Add this to more good earnings hitting from second quarter earnings season, and it’s enough to get big investment managers moving back into the blue-chip multinationals.
Remember, we’ve been watching this chart. The Dow still has a long way to go, to recover the record highs of earlier this year. But the technical breakout of this corrective downtrend has broken.

If you haven’t joined the Billionaire’s Portfolio, where you can look over my shoulder and follow my hand selected 20-stock portfolio of the best billionaire owned and influenced stocks, you can join me here.
|
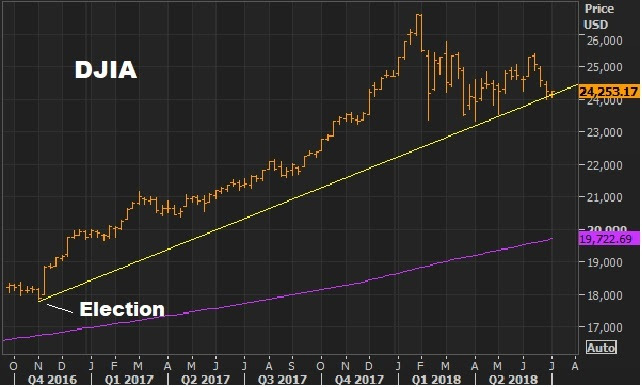
July 9, 5:00 pm EST We’ve talked about the glaring lag in the performance of blue chip stocks coming out of this recent stock market correction. This is creating a huge opportunity to buy the Dow, now. With all of the complexities you can make of investing, this one is simple. The blue-chip Dow Jones Industrials Index is down on the year (as of this morning). The Nasdaq is up 13% on the year. Small caps (the Russell 2000) is up 11%. And we’re in an economy that’s running at better than 3% growth, with low inflation, ultra-low rates, and corporate earnings growing at 20% year-over-year. With this formula, and yet a tame P/E multiple on stocks, we’ll probably see stocks up double digits before the year is over. Meanwhile, we are already in July, and the DJIA — the most important benchmark stock index for global markets – is starting from near zero. You may be thinking the boring “industrials” average is out-dated, and flat for a reason. But as far as the makeup of the indices is concerned: The index curators will shuffle the constituents to ensure that the biggest, best performing companies are in it. Bad stocks get kicked out. Good stocks get added. And, to be sure, your retirement money will be methodically plowed into it (the benchmark indices) every month by Wall Street investment professionals. Bottom line: The DJIA is presenting a gift here to invest, at a discount, in an economy that’s heating up. And you get this chart, which we’ve been watching in recent weeks. This big trend line has held, and so has the 200-day moving average. |
 |
|
How do you buy it? Your financial advisor will put you into mutual funds with big sales loads and fees in attempt to track the Dow. But you can buy an ETF that tracks the Dow for as little as 17 basis points (example: symbol DIA, the SPDR DJIA ETF). This Dow looks like low hanging fruit.
If you haven’t joined the Billionaire’s Portfolio, where you can look over my shoulder and follow my hand selected 20-stock portfolio of the best billionaire owned and influenced stocks, you can join me here.
|
July 3, 5:00 pm EST
Yesterday we talked about the set up for the Dow. In the past couple of trading sessions, it traded perfectly into the trendline (support) that represents the run in stocks following the 2016 election.
It’s especially compelling when we consider that the Dow has been the laggard coming out of the broad stock market correction. As I said yesterday, this sets up for a second half where money should aggressively move back toward the blue chips.
With this in mind, I want to revisit some analysis I talked about last July. It’s from billionaire investor Larry Robbins (of the hedge fund Glenview Capital).
Robbins looked back at the important influence of low interest rate environments on stocks. He said “every time ONE of these following conditions has existed, the market has produced positive returns.
Here they are again:
- When the 30-year bond yield begins the year below 4%, stocks go up 22.1%.
- When investment grade bonds yield below 4%, stocks go up 16%.
- When high yield bonds yield below 8%, stocks go up 11.6%.
- When cash as a percent of asset for non-financials is above 10%, stocks go up 17.6%.
- When the Fed tightens 0-75 basis points in the year, stocks go up 22%.
- When oil falls more than 20%, stocks go up 27.5%.
His study showed that there has NEVER been a down year in stocks, when any ONE of the above conditions is met.
Now, we looked at this last year this time, and the S&P 500 finished up close to 20% on the year. It also worked in 2015. And it worked in 2016.
Does it apply this year? All apply, with the exception of oil. Oil is UP, big. And assuming the Fed hikes one more time this year. Still, as Robbins said, we need just ONE of these conditions to be met. The point is, low interest rates tend to make stocks go UP. That’s because global capital tends to reach for more risk to get return in a world where risk-free bonds aren’t compensating them enough.
Bottom line: Ignore all of the geopolitical noise. Low rates continue to tell us stocks will go up. And to make it easy for us, the DJIA is starting today at essentially the zero line — flat on the year!
Join our Billionaire’s Portfolio today to get your portfolio in line with the most influential investors in the world, and hear more of my actionable political, economic and market analysis. Click her
|
July 2, 5:00 pm EST As we head in to the holiday week, markets will likely go quiet until we get Friday’s jobs number. We’re now into the second half of the year. After stocks got out to a huge start in January (up 7% in just the first 18 trading days of the year), we’ve since had a textbook correction of about 12%. And we currently sit up only 1% in the S&P 500 for the year. And the Dow is still down, -1.8%. But we have this chart on the Dow that looks very intriguing… |
 |
|
The DJIA is trading perfectly into the trendline that represents this post Trump-election rally. Given that technical backdrop, the underperformance of the Dow relative to small caps and tech stocks, and a 16 P/E, the blue-chip American companies are a bargain in a world of sub-3% ten-year yields. This sets up a second half, where money aggressively moves back toward the blue chips. Remember, as we worked through the price correction in stocks for the first half, we were awaiting Q1 earnings to show the early signs of fiscal stimulus working on the economy. We got it. We had big positive surprises on an earnings season that was already projected to do nearly 20% earnings growth. Now, as we enter the second half, we should start to see the positive surprises in the economic data. If you haven’t joined the Billionaire’s Portfolio, where you can look over my shoulder and follow my hand selected 20-stock portfolio of the best billionaire owned and influenced stocks, you can join me here.
|
June 4, 5:00 pm EST
On Friday, we talked about the building momentum in the economy. We’ve already had huge positive surprises in corporate earnings for the first quarter. And we’re probably just beginning to see the positive surprises on economic data roll in.
Remember, despite the execution success on Trumponomics over the past year (deregulation, repatriation, tax cuts and $400 billion in new government spending approved), the Fed is still expecting growth to come in well below trend (3%), at 2.7%. That’s just 20 basis points higher than they projected prior to the execution of massive tax cuts in late December.
The good news: Positive surprises are fuel for confidence and fuel for stocks.
Remember, we’ve yet to have a return of ‘animal spirits’–a level of trust and confidence in the economy that fuels more aggressive hiring, spending and investing. We should see this reflected in wage growth. Wage growth has been the missing piece of the economic recovery puzzle.
On that note, we’re now near the best wage growth in nine years, and that tax rate cut is still in the early stages of working through the economy.
Don’t underestimate the value of confidence in the outlook (and the return of “animal spirits”) to drive economic growth higher than the number crunchers in Washington can imagine. Remember, these are the same experts that couldn’t project the credit bubble, and didn’t project the sluggish ten years that have followed.
Remember, while we’re in the second longest post-War economic expansion, we’ve yet to have the aggressive bounceback in growth that is characteristic of post-recession recoveries. We now have the pieces in place to finally get it.
So, as we’ve discussed throughout the year, the backdrop continues to get better and better for stocks.
May 11, 3:00 pm EST
Over the past two Friday’s we’ve stepped events and conditions that have built the case that that “all-clear” signal has been given for stocks.
We are 91% through S&P 500 earnings for Q1 and the positive surprises have continued to roll in, on both earnings growth and revenue growth. Q1 GDP growth had a positive surprise, to reflect an economy that is running very close to 3% over the past three quarters. The important FAANG stocks all beat on earnings and beat on revenues for Q1. And the big jobs report last Friday did NOT come with a hot wage growth number, which keeps the inflation outlook tame.
Now we have very compelling technical confirmation that a resumption of the big secular bull trend for stocks is resuming. This correction has given everyone a long time to get on board. But it looks like the train is leaving the station.
Here’s a look at the S&P 500 ….

This bull trend in stocks from the oil-price crash induced lows of 2016 remains intact. The trendline tested and held three times in this recent correction, as did the 200-day moving average. And yesterday we had a big break of this trendline that represents this correction of the past three months. This has been textbook technical confirmation of a price correction within a strong bull trend.
Here’s the Dow chart we looked at on Wednesday …

And here’s the latest as we end the week, as the momentum from that trend break continues …


U.S. stocks are being valued right at the long-term P/E, at about 16 times forward earnings. Stocks in the UK, Germany and Japan are all trading closer to 13 times forward earnings. That’s cheap relative to long-term averages, and especially cheap (including U.S. stocks), in ultra-low interest rate environments. For perspective, Japanese stocks are recovering back toward the highest levels in more than 25 years, yet the forward P/E on Japanese stocks is closer to the lowest levels over the period. Stocks are cheap, and this correction has been a gift to get all of the onlookers on board.