January 28, 5:00 pm EST

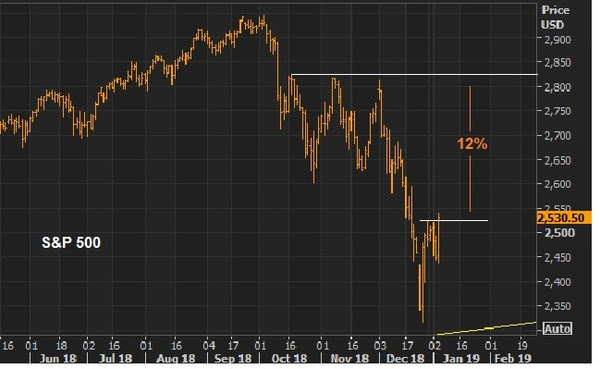
This is a huge week.  We’re following a down 9% month for stocks with a big bounceback.  But it will all hinge on the events of the week.

We get Q4 earnings from about quarter of the companies in the S&P 500 – and a third of the Dow.  We have the Fed on Wednesday.  And the U.S. hosts trade talk meetings with China on Wednesday and Thursday.  And then on Friday, we’ll get the jobs report.

We kicked off earnings season with reports from the big banks two weeks ago.  And the reports broadly painted the picture of a healthy consumer and healthy economy.

This week, we hear from a broad swath of blue chips, including big multinational businesses.  Among them:  We heard from Caterpillar today. We’ll hear from Apple and Boeing tomorrow.  McDonalds and 3M report on Wednesday.  Amazon is on Thursday.

Expect a lot of discussions about “concerns” on the outlook (as we heard from Caterpillar today), but with a picture about Q4 that looked good (continuing with the theme of 2018).

Remember, much of the talk about slowdown has been about what might happen, in the year (or two) ahead – which primarily assumes a long-term stalemate on the Trump trade war.  With that, never underestimate Wall Street and corporate America’s willingness to set the bar low (when given the opportunity), so that they can jump over a very low bar (i.e. set up for earnings beats in future quarters).

Far more important than those “concerns” voiced by CEO’s, is what the Fed has already done, and what will come out of the U.S./China talks this week.

Remember on January 4th, the Fed responded to the calamity in financial markets by backing down from their rate hiking plans.  This week, the Fed Chair will likely use his post-meeting press conference to further massage markets. The Fed, the ECB and the BOJ have already positioned themselves (in recent weeks) to be the shock absorbers if the trade war continues to drag out.

As for trade talks, the calendar continues to approach the March 1 deadline on the tariff truce.  And China has been gasping for air.  I suspect we will get progress — maybe an official agreement on trade, leaving the intellectual property and technology transfer negotiations still on the table. That would be good progress.

Join me here to get my curated portfolio of 20 stocks that I think can do multiples of what broader stocks do, coming out of this market correction environment.

January 25, 5:00 pm EST

We end the week with a weaker dollar, stronger commodities and recovering stocks.  I suspect this is a building theme for the year – and that it will be a very lucrative one.

With that, let’s take a look at some key charts.

For perspective, here’s a longer term picture of the S&P 500.  As you can see, even after the deep decline of the last quarter, the trend from the crisis lows of 2009 remains intact … and we’ve seen plenty of V-shaped recoveries along the path of this trend …

To this point, stocks have followed a December loss of 9% with a bouncein January of 6%.

We remain about 10% off of the October highs (all-time highs).

The opportunity to take advantage of this bounce in stocks is very attractive, but there are even more attractive opportunities in stocks outside of the U.S.

First, and importantly, the dollar is in a long-term bear cycle….and it’s early.

Here’s a look at the long-term dollar cycles dating back to the failure of the Bretton-Woods system …

The dollar is down 8% in this new bear cycle, and about two-years into a cycle that should run another five to six years. These are the early innings.

A lower dollar should fuel capital flows into foreign stock markets.

Among the most interesting:  Japanese stocks and emerging markets.

Here’s a look at the Nikkei…

Back in late 2012, Shinzo Abe, then candidate for Japanese Prime Minister, promised a big and bold QE plan to beat two decades of deflation, and he had his hand selected candidate to run the BOJ, in waiting, to execute it.  As you can see in the chart on stocks, that beganthe sharp rise in Japanese equities. And that trend too, still holds after the recent sell-off.

Seven years later, the Bank of Japan is now the lone global economic shock absorber (i.e. they are the last major central bank still easing and will be in QE mode for the foreseeable future).  As part of their QE program, they continue to outright buy Japanese stocks.  While U.S. stocks are 10% from the highs of last year, Japanese stocks would still need another 20% to regain the 2018 highs.

As for EM:  If we consider where emerging market stocks were a year ago, and now introduce the possibility that China may be coming to the table later this month with a deal (at least on trade) that will include balancing trade with the U.S. over six years.  How might EM economies look if the world’s leading exporter (China) no longer unfairly floods the world with its cheap products?

Here’s a look at the chart on emerging markets.  You can see we’re getting a big trend-break this month of the ugly downtrend of the past year. 

Finally, a falling dollar and a deal with China is jet fuel for commodities. And you can see in the chart below, this huge downtrend of the past decade is nearing a break.  

With all of the above in mind, I suspect we’ve seen peak pessimism over the past quarter.  And markets are showing signs that we might see a spillover of prosperity from the U.S. economy to the rest of the world, rather than another retrenchment in the global economy.
Have a great weekend!
Join me here to get my curated portfolio of 20 stocks that I think can do multiples of what broader stocks do, coming out of this market correction environment.

January 22, 5:00 pm EST

China reported the slowest growth since 1990 on Monday (+6.4%).

This an interesting period to reference because, at that point, China was in the latter stages of executing on an economic plan.  At the core of that plan was currency manipulation — i.e. devaluing it’s currency (i.e. trashing it) so that they would have a distinct advantage on price when competing for world exports (i.e. they would always be the cheapest).

It worked.  The Chinese economy grew at an average of 12% the following five years (1991-1995).  From 1991 to 2009, leading up the global financial crisis, China grew at 10.5% annual rate.  That’s 18-years of double-digit annualized growth, on average.

That’s why the Chinese economy has ascended from a $350 billion economy to a $12 trillion economy since 1990.

Here’s what that looks like in a chart ….

Thanks to decades of uncontested currency manipulation, China is now the second largest economy in the world and on pace to be the biggest soon (though it still has just an eighth of the per capita GDP as the U.S.).

Why does it matter?

When they maintain a cheap currency, to undercut the world on price, they become the world’s sellers to everyone.  That means they accumulate a mountain of foreign currency as a result (which they have).  China is the holder of the largestsforeign currency reserves in the world, at more than $3 trillion dollars (mostly U.S. dollars). What do they do with those dollars?  They buy our Treasuries, which keeps our rates low, so that U.S. consumers can borrow cheap and buy more of their goods — adding to China’s mountain of currency reserves, adding to their wealth and depleting the U.S. of wealth.  And so the cycle goes.

This has proven to be a recipe for booms and busts (big busts), and a destructive global wealth transfer. 

So coming out of a decade long global economic slog, U.S. growth (driven by fiscal stimulus) has put us in a position of strength to negotiate reform in China. 

An economy running at 6% in China is recession territory and makes them vulnerable to an uprising against the regime. And trade tariffs put more and more downward pressure on the growth number.  That’s why they’ve been willing to talk.  Here’s what President Xi said yesterday about the ruling party’s outlook for retaining power in China:  “The party is facing long-term and complex tests in terms of maintaining long-term rule, reform and opening-up, a market-driven economy, and within the external environment … The party is facing sharp and serious dangers of a slackness in spirit, lack of ability, distance from the people, and being passive and corrupt. This is an overall judgment based on the actual situation.”

Join me here to get my curated portfolio of 20 stocks that I think can do multiples of what broader stocks do, coming out of this market correction environment.

January 18, 5:00 pm EST

Stocks and crude oil have led the bounce back this month.  And we’re now getting more broad-based participation as market and economicsentiment rebounds.  Global stocks are rising, and commodities are rising.

Let’s take a look at some key charts as we end the week.

Here’s a look at stocks …

Stocks continue to make this V-shaped recovery.  A return to the December 3rd highs is another 5% from here.

Remember, oil and stocks have been in a synchronized decline since October 3.  The farther the fall (in both), the higher the rise in fears about deflationary pressures, prospects of an economic downturn and maybe even a financial crisis. But the tide has turned. And it was triggered by both Fed and Treasury actions.

With that, as we’ve observed in this oil chart in recent weeks, the big break of the downtrend has unleashed what could be a very sharp rebound (maybe a V-shaped recovery for oil). 

Keep in mind, at $76 oil we had an undersupplied market in a world with growing global demand.  At $42 oil (the low), the fundamentals for much higher oil prices had only strengthened, with OPEC coming back to the table with more production cuts.

Now, with reports that China is coming to the table with big trade concessions, commodities are beginning to reboot. 

As I said last week, “what if this chart on commodities tells us that the decade that followed the financial crisis was indeed a depression, and central banks were only able to manufacture enough economic activity to buffer the pain (not a real economic expansion)? And now, instead of at the tail end of one of the longest economic expansions on record, we’re in the early stages of a real expansion, driven by fiscal policies and structural reform that has started in the U.S. and will be implemented abroad (Europe, Japan, China).”

A trade deal may unlock a real global economic boom.  While it might appear that China will be a big loser in any trade deal with the U.S., relative to where they stood Pre-Trump, being forced to move toward a balanced domestic economy, and fair trade, would position China to be a legitimate long-term player in the global economy.

With that in mind, Chinese stocks look like a very compelling buy …

January 17, 5:00 pm EST

Stocks continue to recover from the wreckage of December.  From December 3rd to December 26th, the S&P 500 collapsed 16%.  That was over just 15 trading days. 
We’ve since had a 12% bounce over 15 days.  But we need another 7% to recoup the losses from December 3.The good news: The catalysts for a big recovery are in place — not only to recover the December 3rd levels, but to print new all time highs in the stock market. 

Remember, major turning points in markets are often driven by some form of intervention.  In this case, we’ve had it.  We had intervention from the U.S. Treasury on December 23/24, 1) calling out to the six largest U.S. banks, and then 2) calling a meeting with the President’s Working Group (which includes the Fed).

Just days later, the Fed sent a clear message to markets that they were there to promote market stability (that means higher stock prices).

Add to this, we’ve entered Q4 earnings season, and we’re getting plenty of positive surprises already, on expectations that were already dialed down substantially in the wake of the stock market decline of the fourth quarter.  As of last Friday, 90% of the companies that had reported beat Wall Street’s expectations.

So, where can stocks go from here?

Even with the sharp recovery over the past several weeks, the P/E on this year’s earnings estimate is just 15.  That’s cheap relative to history.  It’s very cheap relative to historical low interest rate environments.

If we apply Wall Street’s estimate on earnings for the S&P 500 (which is $172), to a P/E of 18 we get 3,096 on the S&P by the end of the year.  If we apply a 20 P/E, we get 3,440. That’s argues for anywhere from 18% to 31% higher for 2019.

Keep in mind, that’s if Wall Street hasn’t undershot on its estimate.  But they tend to undershoot often (to the tune of about 70% of the time).

Join me here to get my curated portfolio of 20 stocks that I think can do multiples of what broader stocks do, coming out of this market correction environment.

January 15, 5:00 pm EST

We now have Q4 earnings in from three of the country’s four largest banks.  Yesterday it was Citi.  Better earnings were driven by cost cuts not growth.  Still, the stock is up 8% in two days.

Today it was Wells Fargo and JP Morgan.  Wells, too, had soft revenues but beat on earnings driven by cost cuts.  JP Morgan missed on earnings and revenues.

Now, Jamie Dimon runs JP Morgan — the largest U.S. based global money center bank.  And he has been publicly positive on the economy and the market outlook, in the face of a lot of broad negativity and fear late last year.

Let’s take a look at what he had to say about JP Morgan’s earnings and the operating environment…

JP Morgan generated record earnings and record revenues for full year 2018.  And Dimon says they would have done it even without the tax cuts. He says his business shows the U.S. consumer to be healthy and engaged.  Consumers are spending, saving and investing.  And Dimon said they opened Chase branches in new states for the first time in nearly a decade.

This all in a year where the chatter about an impending recession grew by the month, for no other reason than the economic expansion has been running long.

According to the biggest bank in the country, things sound pretty good.

Importantly, last year, the blowout earnings were often met with selling in the broad stock market.  It’s looking like that dynamic is changing.  Stocks are rising, even on less than impressive numbers (thus far). That a good sign for the sustainability of the rebound.
Join me here to get my curated portfolio of 20 stocks that I think can do multiples of what broader stocks do, coming out of this market correction environment.

January 4, 5:00 pm EST

Stocks had a huge bounce today.

And it was driven by: 1) the central bank in China stepping in with an injection of over $100 billion in liquidity into the economy through a cut to the bank reserve requirement ration, and 2) the three most powerful central bankers in the world (over the past 10 years) sitting on stage together and massaging market sentiment on the path of interest rates.

We entered the year with the idea that the Fed would need to walk back on its rate hiking path this year (possibly even cutting, if the stock market environment persisted).  And today, just days into the new year, we get the Fed Chair Powell, former Fed Chairs Yellen and Bernanke telling us that the Fed is essentially done of the year, unless things improve.

Remember, last year was the first since 1994 that cash was the best producing major asset class (among stocks, real estate, bonds, gold).  The culprit for such an anomaly:  An overly aggressive Fed tightening cycle in a low inflation recovering economy.  The Fed ended up cutting rates in 1995 and spurring a huge run up in stocks (up 36%).  Now, we’re getting the Fed standing down, and committing to “responsiveness to the data and markets.”

Yellen voluntarily drew the comparison to today to early 2016 – where the Fed had to respond to sour markets that were beginning to feed into the economy.

In 2016, the oil price crash prompted a coordinated response by global central banks to avert another financial crisis.  For the Fed’s part, they took two of the four projected rate hikes they had guided for 2016 off of the table (effectively easing).  This coordinated easing from global policymakers put a bottom in stocks and oil in early 2016. Oil doubled by the end of the year.  Stocks finished 2016 up 25% from the oil-price crash induced lows.

Here’s a look at the chart on oil today…

jan4 oil

You can see this big trendline that represents the plunge from $76 has broken today.

And here’s a look at stocks …

jan4 stocks
We broke a big level today on the way up in the S&P 500 (2520) and it looks like a V-shaped recovery is underway, to take us back to where stocks broke down on December 3rd.  That would be 12% from current levels.
Join me here to get my curated portfolio of 20 stocks that I think can do multiples of what broader stocks do, coming out of this market correction environment.

January 2, 5:00 pm EST

Happy New Year! We are off to what promises to be a very important year for markets and the economy.

Contrary to what the growing narrative has been on the economy and stocks over the past several months, I think we’re in for a hot economy, a big bounce back in stocks and resumption of the bull market in commodities.

The pieces are in place.  The linchpin will be China.

On that note, Trump had been in the clear position of strength in the negotiations on China, until stocks began to melt.

A sour stock market can ultimately erode economic activity.  And that becomes the big risk heading into this new year.

The Trump agenda has had big wins on the economy.  But those wins are at risk of being undone if the stock market calamity continues.  This is the weakness I’ve suspected has been exploited by China.  The indiscriminate selling has had all of the appearances of liquidations and/or manipulation.  With few cards to play, this (hitting the stock market) was one they could play.

Now, if we look back through history, major turning points in markets have often been the result of some form of intervention.  With that in mind, to counter the indiscriminate selling of stocks, on December 23rd we had a response from the U.S. Treasury Secretary and (the next day) a meeting of the “President’s Working Group” on financial markets.  That was an intervention signal.  When stocks re-opened after Christmas the bottom was in — stocks rallied 7% over the last four days of the year.

Again, market followers like to have very clear, neat evidence to describe every tick in markets.  And that leads them to very wrong conclusions when markets are at extremes (as they force their worst case scenarios to fit the price).  They don’t factor in the influence of intervention and manipulation (both by policymakers and powerful market players).  Markets are made up of people (and their varying motivations), and the evidence isn’t always so clear.

Bottom line:   As I said in my last note before Christmas, the lower stock market has put pressure on the Trump agenda, which makes it more likely that concessions will be made on China demands. My bet is that a deal on China would unleash a massive global financial market rally for 2019, and lead to a big upside surprise in global economic growth.

Join me here to get my curated portfolio of 20 stocks that I think can do multiples of what broader stocks do, coming out of this market correction environment.

December 20, 5:00 pm EST

In recent days we’ve discussed the parallels between this year and 1994.  In ’94 the Fed was hiking rates into a low inflation, recovering economy.

The Fed has done the same this year, methodically raising rates into a low inflation, recovering economy.  And like in 1994, the persistent tightening of credit has sent signals that the Fed is threatening economic growth.  Asset prices have swooned, and we have a world where cash is the best performing asset class (just as we experienced in 1994).

But remember, the Fed was forced to stop and reverse by early 1995.  Stock prices exploded 36% higher that year.

With this in mind, over the past couple of weeks, several of the best investors in the world have publicly commented on the state of markets.

Among them, was billionaire Paul Tudor Jones.  Jones is one of the great global macro traders of all-time.  He’s known for calling the 1987 crash, where he returned over 125% (after fees).  And he’s done close to 20% a year (again, after fees) spanning four decades.

Let’s take a look at what Jones said in an interview on December 10th …

He said the Fed has gone too far (tightened too aggressively).  But he thinks the Fed is near the end of its tightening cycle.

With that, he expected to see more swings in stocks.  He said he thinks we could be down 10% or up 10% from the levels of December 10th. But historically when the Fed ends a tightening cycle, after going too far, he says it has been a great time to be in the stock market.

The sentiment that the Fed has gone “too far” increased dramatically across the market this week — in the days up to yesterday’s Fed meeting.  As such, because the Fed followed through with another hike yesterday, and telegraphed more next year, stocks continued to slide today.  In fact, stocks have now/already declined 9.4% from the levels where Paul Tudor Jones made his comments about down 10%/up 10%. Again, he made those comments just 10 days ago.

With the above in mind, here’s what he said he would do if he saw itdown 10%: “I’m going to buy the hell out of ten percent lower, for sure.  To me, that’s an absolute lay-up.”

Join me here to get my curated portfolio of 20 stocks that I think can do multiples of what broader stocks do, coming out of this market correction environment.

November 16, 5:00 pm EST

Stocks end the week on a strong note.

We’ve talked all week about the catalysts to fuel the continuation of recovery in the stock market.  The Fed’s signalling that their rate normalization program is in the final steps was a big one.  We’ve also possibly cleared the overhang of the potential for broad sanctions on the Saudi government.  And now we’re getting movement on the China/U.S. trade negotiations.

Again, just in the past few days we’ve cleared a lot of the fog that has been hanging over stocks.

With that, as we head into the weekend, let’s take a look at a few charts …

On Wednesday, we looked at this chart above.  This big retracement level was setting up nice, technically, for another leg higher in the post correction recovery for stocks.  It looks like we’re getting it.

And I continue to think this may all end in a sharp V-shaped recovery.  In the chart below, you can see what the slope of that move may look like.  

The stock market fears are driven by “what-ifs.”  Meanwhile the reality (the “what is”) is clearly supportive of much higher stock prices: strong economic growth, subdued inflation, strong corporate earnings and cheap valuations.
Have a great weekend!
Join me here to get all of my in-depth analysis on the big picture, and to get access to my carefully curated list of “stocks to buy” now.