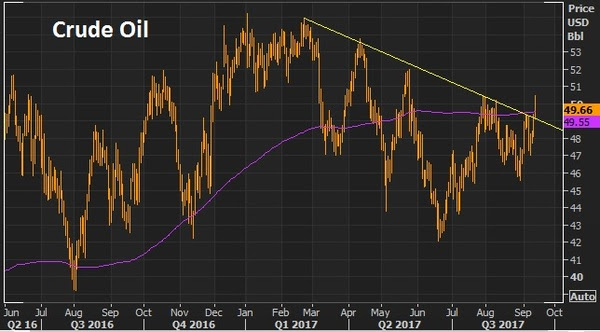
Yesterday we looked at the charts on oil and the U.S. 10 year yield. Both were looking poised to breakout of a technical downtrend. And both did so today.
Here’s an updated look at oil today.
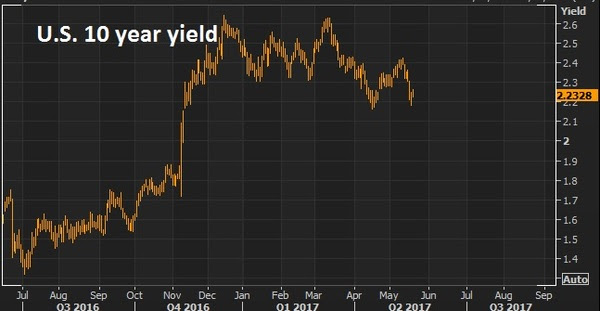
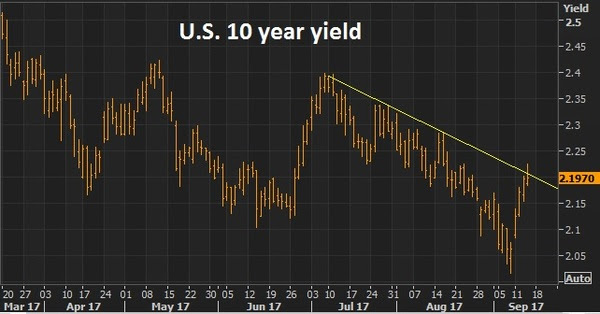
And here’s a look at yields.
We talked yesterday about the improving prospects that we will get some policy execution on the Trumponomics front (i.e. fiscal stimulus), which would lift the economy and start driving some wage pressure and ultimately inflation (something unlimited global QE has been unable to do).
No surprise, the two most disconnected markets in recent months (oil and interest rates) have been the early movers in recent days, making up ground on the divergence that has developed with other asset classes.
Now, oil will be the big one to watch. Yields have a lot to do, right now, with where oil goes.
Though the central banks like to say they look at inflation excluding food and energy, they’re behavior doesn’t support it. Oil does indeed play a big role in the inflation outlook – because it plays a huge role in financial stability, the credit markets and the health of the banking system. Remember, in the oil price bust last year the Fed had to reverse course on its tightening plan and other major central banks coordinated to come to the rescue with easing measures to fend off the threat of cheap oil (which was quickly creating risk of another financial crisis as an entire shale industry was lining up for defaults, as were oil producing countries with heavy oil dependencies).
So, if oil can sustain above the $50 level, watch for the inflation chatter to begin picking up. And the rate hike chatter to begin picking up (not just with the Fed, but with the BOE and ECB). Higher oil prices will only increase this divergence in the chart below, making the interest rate market a strong candidate for a big move.
Join our Billionaire’s Portfolio today to get your portfolio in line with the most influential investors in the world, and hear more of my actionable political, economic and market analysis. Click here to learn more.
Stocks are sliding more aggressively today. Wall Street and the media always have a need to assign a reason when stocks move lower. There have been plenty of negatives and uncertainties over the past seven months — none of which put a dent in a very strong opening half for stocks.
But markets don’t go straight up. Trends have retracements. Bull markets have corrections. And despite what many people think, you don’t need a specific event to turn markets. Price can many times be the catalyst.
If we look across markets, it’s safe to say it doesn’t look like a market that is pricing in nuclear war. Gold is higher, but still under the highs of a month ago. The 10 year yield is 2.21%. Two weeks ago, it was 2.22%. That doesn’t look like global capital is fleeing all parts of the world to find the safest parking place.
Now, on the topic of North Korea, the media has found a new topic to obsess about– and to obsessively denounce the administration’s approach. With that, let’s take a look at the Trump geopolitical strategy of calling a spade a spade.
As we know, Mexico was the target heading into the election. Trump’s tough talk against illegal immigration and drug trafficking drew plenty of scrutiny. People feared the protectionist threats, especially the potential of alienating the U.S. from its third biggest trading partner. We’re still trading with Mexico. And the U.S. is doing better. So is Mexico. Mexican stocks are up 11% this year. The Mexican currency is up 13% this year.
China has been a target for Trump. He’s been tough on China’s currency manipulation and, hence, the lopsided trade that contributed heavily to the credit crisis. Despite all of the predictions, a trade war hasn’t erupted. In fact, China has appreciated its currency by 5% this year. That’s a huge signal of compliance. That’s among the fastest pace of currency appreciation since they abandoned the peg against the dollar more than 12 years ago (which was China’s concession to threats of a 30% trade tariff that was threatened by two senators, Schumer and Graham, back in 2005). And even in the face of a stronger currency (which drags on exports, a key driver of the economy), stocks are up 5% in China through the first seven months of the year.
Bottom line: It’s fair to say, the tough talk has been working. There has been compromise and compliance. So now Trump has stepped up the pressure on North Korea, and he has been pressuring China, to take the side of the rest of the world, and help with the North Korea situation – and through China is how the North Korea threat will likely get resolved.
Join our Billionaire’s Portfolio and get my most recent recommendation – a stock that can double on a resolution on healthcare. Click here to learn more.
James Bullard, the President of the St. Louis Fed, said today that even if unemployment went to 3% it would have little impact on the current low inflationevironment. That’s quite a statement. And with that, he argued no need to do anything with rates at this stage.And he said the low growth environment seems to be well intact too — even though we well exceeded the target the Fed put on employment years ago. In the Bernanke Fed, they slapped a target on unemployment at 6.5% back in 2012, which, if reached, they said they would start removing accomodation, including raising rates. The assumption was that the recovery in jobs to that point would stoke inflation to the point it would warrant normalization policy. Yet, here we are in the mid 4%s on unemployment and the Fed’s favored inflation guage has not only fallen short of their 2% target, its trending the other way (lower).
As I’ve said before, what gets little attention in this “lack of inflation” confoundment, is the impact of the internet. With the internet has come transparency, low barriers-to-entry into businesses (and therefore increased competition), and reduced overhead. And with that, I’ve always thought the Internet to be massively deflationary. When you can stand in a store and make a salesman compete on best price anywhere in the country–if not world–prices go down.
And this Internet 2.0 phase has been all about attacking industries that have been built upon overcharging and underdelivering to consumers. The power is shifting to the consumer and it’s resulting in cheaper stuff and cheaper services. And we’re just in the early stages of the proliferation of consumer to consumer (C2C) business — where neighbors are selling products and services to other neighbors, swapping or just giving things away. It all extracts demand from the mainstream business and forces them to compete on price and improve service. So we get lower inflation. But maybe the most misunderstood piece is how it all impacts GDP. Is it all being accounted for, or is it possible that we’re in a world with better growth than the numbers would suggest, yet accompanied by very low inflation?
Join our Billionaire’s Portfolio and get my most recent recommendation – a stock that can double on a resolution on healthcare. Click here to learn more.
As we know, inflation has been soft. Yet the Fed has been moving on rates, assuming that they have room to move away from zero without counteracting the same data that is supposed to be driving their decision to increase rates.
Thus far, after four (quarter point) increases to the Fed funds rate, the moves haven’t resulted in a noticeable tightening of financial conditions. That’s mainly because the interest rate market that most key consumer rates are tied to have remained low. Because inflation has remained low.
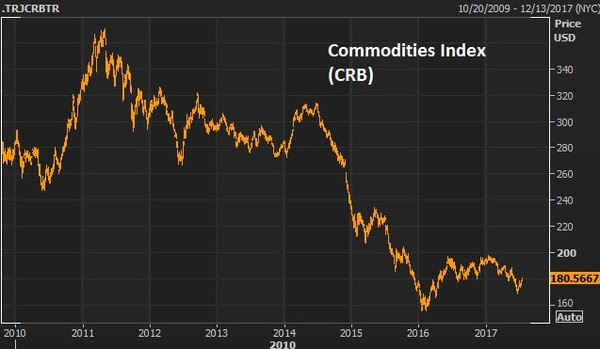
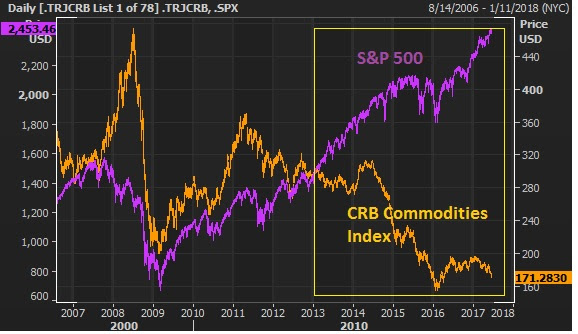
A key contributor to low inflation has been low oil prices (though the Fed doesn’t like to admit it) and commodity prices in general that have yet to sustain a recovery from deeply depressed levels (see the chart below).
But that may be changing.
Commodities have been lagging the rest of the “reflation” trade after the value of the index was cut in half from the 2011 highs. Remember, we looked at this divergence between the stocks and commodities last month. Commodities are up 6% since.
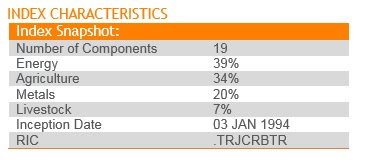
Things are picking up. Here’s the makeup of the broadly followed commodities index.
You can see, energy has a heavy weighting. And oil, with another strong day today, looks like a break out back to the $50 level is coming.With today’s inventory data, we’ve now had 12 out of the past 14 weeks that oil has been in a draw (drawing down on supply = bullish for prices). And with that backdrop, the CRB index, after being down as much as 13% this year, bottomed following the optimistic central bank commentary last month, and is looking like it may be in the early stages of a big catch-up trade. And higher oil (and commodity prices in general) will likely translate into higher inflation expectations.
Join our Billionaire’s Portfolio and get my most recent recommendation – a stock that can double on a resolution on healthcare. Click here to learn more.
With some global stock barometers hitting new highs this morning, there is one spot that might benefit the most from this recently coordinated central bank promotion of a higher interest environment to come. It’s Japanese stocks.
First, a little background: Remember, in early 2016, the BOJ shocked markets when it cut its benchmark rate below zero. Counter to their desires, it shook global markets, including Japanese stocks (which they desperately wanted and needed higher). And it sent capital flowing into the yen (somewhat as a flight to safety), driving the value of the yen higher and undoing a lot of the work the BOJ had done through the first three years of its QE program. And that move to negative territory by Japan sent global yields on a mass slide.
By June, $12 trillion worth of global government bond yields were negative. That put borrowers in position to earn money by borrowing (mainly you are paying governments to park money in the “safety” of government bonds).
The move to negative yields, sponsored by Japan (the world’s third largest economy), began souring global sentiment and building in a mindset that a deflationary spiral was coming and may not be leaving, ever—for example, the world was Japan.
And then the second piece of the move by Japan came in September. It was a very important move, but widely under-valued by the media and Wall Street. It was a move that countered the negative rate mistake.
By pegging its ten-year yield at zero, Japan put a floor under global yields and opened itself to the opportunity to doing unlimited QE. They had the license to buy JGBs in unlimited amounts to maintain its zero target, in a scenario where Japan’s ten-year bond yield rises above zero. And that has been the case since the election.
The upward pressure on global interest rates since the election has put Japan in the unlimited QE zone — gobbling up JGBs to push yields back down toward zero — constantly leaning against the tide of upward pressure. That became exacerbated late last month when Draghi tipped that QE had done the job there and implied that a Fed-like normalization was in the future.
So, with the Bank of Japan fighting a tide of upward pressure on yields with unlimited QE, it should serve as a booster rocket for Japanese stocks, which still sit below the 2015 highs, and are about half of all-time record highs — even as its major economic counterparts are trading at or near all-time record highs.
Without a doubt, there was a significant shift in the outlook on central bank monetary policy this week. In fact, the events of the week may represent the official market acceptance of the “end of the easy money” era.
Draghi told us deflation is over and reflation is on. Yellen told us we should not expect another financial crisis in our lifetimes. Carney at the Bank of England told us removal of stimulus is likely to become necessary, and up for debate “in the coming months.” And even the Finance Minister in Japan joined in, saying Japan was recovery from deflation.
With that, in a world where “reflation” is underway, rates and commodities lead the way.
Here’s a look at the chart on the 10-year yield again. We looked at this on Tuesday. I said, the “Bottom May Be In For Oil and Yields.” That was the dead bottom. Rates bounced hard off of this line we’ve been watching …
This reflation theme confirmed by central banks has put a bid under commodities…
That’s especially important for oil, which had been trading down to very dangerous levels, the levels that begin threatening the solvency of oil producers.
That’s a 9% bounce for oil from the lows of last week!
This all looks like the beginning of another leg of recovery for commodities and rates (with the catalyst of this central bank guidance). Which likely means a lower dollar (as we discussed earlier this week). And a quieter broad stock market (until growth data begins to reflect a break out of the sub 2% GDP funk).
Have a great weekend.
Join the Billionaire’s Portfolioto hear more of my big picture analysis and get my hand-selected, diverse stock portfolio following the lead of the best activist investors in the world.
Yesterday we talked about the Draghi remarks (head of the European Central Bank) that were intended to set expectations that the ECB might be moving toward the exit doors on QE and zero interest rate policy. That bottomed out global rates — which popped U.S. rates further today. The Bank of England piled on today, talking about rate normalization soon.
We’ve gone from 2.12% in the U.S. ten year yield to 2.25% in about 24 hours. These are big swings in the interest rate market – a big bounce and, as I’ve said, the bottom appears to be in for rates.
As importantly, this prepared speech by Draghi could very well cement the top in the dollar. It begins to tighten a very wide interest rate spread between the U.S. and global rates. We entered the year with the Fed going one way (tightening) while the rest of the world was going the other way (easing). That’s a recipe for capital to storm into U.S. assets — into the dollar. And now that may be over.
I’ve been researching long-term cycles in the dollar for a very long time and throughout the global financial crisis period, it these cycles in the world’s reserve currency have been my guidepost for drawing a lot of conclusions on markets and the outlook for capital flows over the past several years.
Despite the choppiness in the dollar for much of the crisis, if we look back at the cycles following the failure of the Bretton Woods system, we were able, very early on, to determine the dollar was in a bull cycle.
This view came in the face of all of the negative global sentiment toward the dollar in 2010. Foreign leaders were taking shots at the Fed, accusing the Fed of trying to destroy the dollar. People were calling for the end of the dollar as the world’s reserve currency. All the while, the dollar held firm and ultimately made an aggressive climb.
Take a look below at my chart on the long term dollar cycles…
I’ve watched this chart for quite some time, defining the five complete dollar cycles over the past nearly 40 years, and the most recent bull cycle.
If we mark the top of the most recent cycle in early January, this bull cycle has matched the longest cycle in duration (at 8.8 years) and comes in just shy of the long-term average performance of the five complete cycles. The most recent bull cycle added 47%. The average change over a long term cycle has been 56%. This all argues that the dollar bull cycle is over. And a weaker dollar is ahead. That should go over very well with the Trump administration.
Join the Billionaire’s Portfolioto hear more of my big picture analysis and get my hand-selected, diverse stock portfolio following the lead of the best activist investors in the world.
Join the Billionaire’s Portfolio to hear more of my big picture analysis and get my hand-selected, diverse stock portfolio following the lead of the best activist investors in the world.As we end the week, we have some remarkable market and economic conditions. U.S. stocks printing new record highs by the day. Yields today broke down. The 10 year yield now trades 2.15%. Oil is under $50.We’re set up to massively stimulative fiscal policies launch into an economic environment that is about as primed as it can possibly get.The stock market is at record highs. The unemployment rate is 4.3%. Inflation is low. Gas is cheap ($2.38), and stable. Mortgage rates are under 4%, and stable. You can borrow money at 2% (or less) to buy a car.
This has all put consumers in as healthy a position as they’ve been in a long time.
As I’ve said, the two key tools the Fed used to engineer a recovery was housing and stocks. That restores wealth, which restores confidence, which gets people spending, hiring and investing again. So stocks are at record highs. And housing (as you can see in the chart below) continues to climb back toward pre-crisis levels.
As a result, we have well recovered and surpassed pre-crisis levels in household net worth, and sit at record highs …
What is the key long-term driver of economic growth over time? Credit creation. In the next chart, you can see the sharp recovery in consumer credit (in orange) since the depths of the economic crisis. This excludes mortgages. And you can see how closely GDP (the purple line, economic output) tracks credit growth.
So credit is back on track. Meanwhile, consumers have never been so credit worthy. FICO scores in the U.S. have reached all-time highs.
With all of this said, the consumer looks strong, but the big missing link and structural drag on the economy in this story has been wage growth. What’s the solution? A corporate tax cut. The biggest winners in a corporate tax cut are workers. The Tax Foundation thinks a cut in the corporate tax rate would double the current annual change in wages.
So think about this backdrop. If I told you at any point in history that these were the conditions, you would probably tell me that the economy was already in, or will be in, an economic boom period. I think it’s coming. And it will drive earnings significantly, which will make the valuation on stocks cheap.
What stocks are cheap?Join me today to find out what stocks I’m buying in my Billionaire’s Portfolio. It’s risk-free. If for any reason you find it doesn’t suit you, just email me within 30-days.
We talked yesterday about run up in bitcoin. The price of bitcoin jumped another 14% today before falling back.
As I said yesterday, it looks like Chinese money is finding it’s way out of China (despite the capital controls) and finding a home in bitcoin (among other global assets). If you own it, be careful. The last time the price of bitcoin ran wild, was 2013. It took about 11 days to triple, and about 18 days to give it all back. This time around, it’s taken two months to triple (as of today).
If you’re looking for a warning signal on why it might not be sustainable (this bitcoin move), just look at the behavior across global markets. It’s not exactly an environment that would inspire confidence.
Gold is flat. Interest rates are soft. Stocks are constantly climbing. Commodities are quiet, except for oil — which fell back below $50 today on news that OPEC did indeed agree to extend its production cuts out to March of next year (bullish, though oil went south).
When the story is confusing, conviction levels go down, and cash levels go up (i.e. people de-risk). And maybe for good reason.
In looking at the bitcoin chart today, I thought back to the run up in Chinese stocks in early 2015. Here’s a look at the two charts side by side, possibly influenced by a lot of the same money.
The crash in Chinese stocks took global markets with it. It’s often hard to predict that catalyst that might prick a bubble and even harder to see the links that might lead to broader market instability. In this case, though, there are plenty of signs across markets that things are a little weird.
Invitation to my daily readers: Join my premium service members atBillionaire’s Portfolio to hear more of my big picture analysis and get my hand-selected, diverse stock portfolio where I follow the lead of the best activist investors in the world. Our goal is to do multiples of what broader stocks do. Our portfolio was up 27% in 2016. Join me today, risk-free. If for any reason you find it doesn’t suit you, just email me within 30-days.
Stocks continue to bounce back today. But the technical breakdown of the Trump Trend on Wednesday
still looks intact. As I said on Wednesday, this looks like a technical correction in stocks (even considering today’s bounce), not a fundamental crisis-driven sell-off.
With that in mind, let’s take a look at the charts on key markets as we head into the weekend.
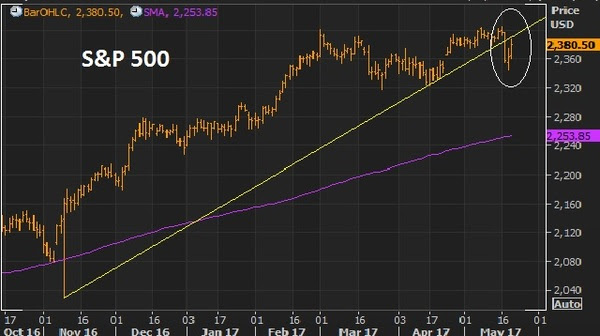
Here’s a look at the S&P 500 chart….
For technicians, this is a classic “break-comeback” … where the previous trendline support becomes resistance. That means today’s highs were a great spot to sell against, as it bumped up against this trendline.
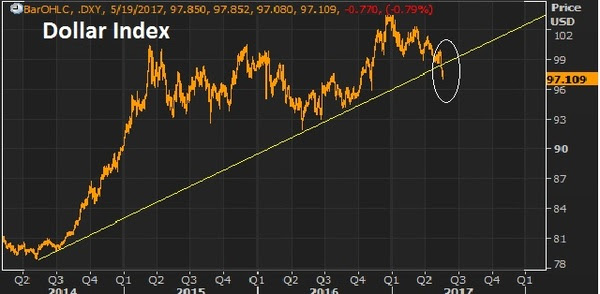
Very much like the chart above, the dollar had a big trend break on Wednesday, and then aggressively reversed Thursday, only to follow through on the trend break to end the week, closing on the lows.
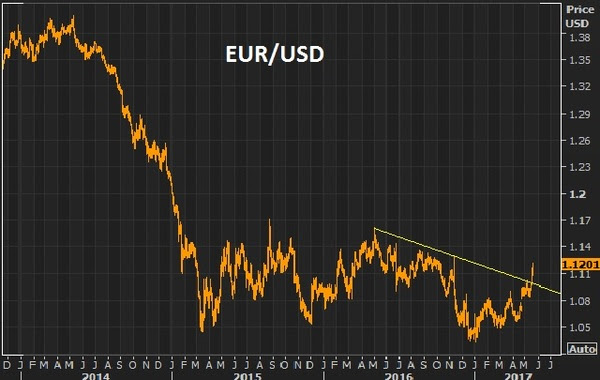
On that note, the biggest contributor to the weakness in the dollar index, is the strength in the euro (next chart).
The euro had everything including the kitchen sink thrown at it and it still could muster a run toward parity. If it can’t go lower with an onslaught of events that kept threatening the existence of the euro, then any sign of that clearing, it will go higher. With the French elections past, and optimism that U.S. growth initiatives will spur global growth (namely recovery in Europe), then the European Central Bank’s next move will likely be toward exit of QE and extraordinary monetary policies, not going deeper. With that, the euro looks like it can go much higher. That means a lower dollar. And it means, European stocks look like, maybe, the best buy in global stocks.
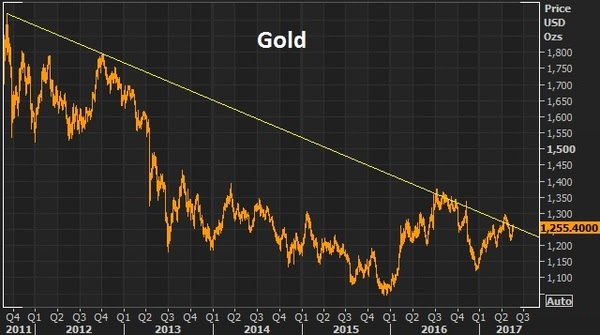
A lower dollar should be good for gold. As I’ve said, if Trump policies come to fruition, inflation could get a pop. And that’s bullish for gold. If Trump policies don’t come to fruition, the U.S. and global growth looks grim, as does the post-financial crisis recovery in general. That’s bullish for gold.
This big trendline in gold continues to look like a break is coming and higher gold prices are coming.
With all of the above, the most important chart of the week is probably this one …
The 10 year yield has come all the way back to 2.20%. The best reason to wish for a technical correction in stocks, is not to buy the dip (which is a good one), but so that the pressure comes out of the interest rate market (and off of the Fed). The run in the stock market has clearly had an effect on Fed policy. And the Fed has been walking rates up to a point that could choke off the existing economic recovery momentum and, worse, neutralize the impact of any fiscal stimulus to come. Stable, low rates are key to get the full punch out of pro-growth policies, given the 10 year economic malaise we’re coming out of.Invitation to my daily readers: Join my premium service members at Billionaire’s Portfolio to hear more of my big picture analysis and get my hand-selected, diverse portfolio of the most high potential stocks.


 With some global stock barometers hitting new highs this morning, there is one spot that might benefit the most from this recently coordinated central bank promotion of a higher interest environment to come. It’s Japanese stocks.


 Join the