Japanese stocks have been a huge mover over the past quarter, as we discussed earlier this week. That move extended to a new 25-year high overnight. And then we got this …
As you can see on the far right of this daily chart, the Nikkei had a very slippery reversal to post an 1,110 point range for the day (closing near the lows).
This was the biggest range in the Nikkei since exactly one year ago today. That was the night of the U.S. elections (the day, in Japan).
Now, despite the huge range of the day, today’s losses in Japanese stocks were only 1.7% (open to close). Let’s take a look back over the past two years, though, to other times we’ve had a 1,000+ point range and on a down day.
There was the Brexit surprise in June 2016 (-9%). And then when the Bank of Japan shocked world markets in a scheduled meeting by NOT upping its QE program in April 2016 (-7%). Prior to that, was the middle of January of 2016 when oil prices were crashing (-4% and -4% two out of three trading days). Then there was December 18, 2015, the day after the Fed made its first post-crisis Fed hike (-2%). And then we had a day in August 2015 (-6%) and into the first day of September (-5%). These were driven by a surprise devaluation of the Chinese yuan, which set off a global stock market slide on fears of a weaker China, than most thought.
Now, we’ve just looked at all of the days for Japanese stocks where the range has been greater than 1,000 points and stocks have finished down. As you might deduce, these days all share a common thread. There was a big event related to these moves. So what was the event that caused this last night?
Nothing, of note. That’s concerning. Is there something bigger going on, that has yet to present itself. Is it perhaps the news out of Saudi Arabia that is about to lead to a global event?
Keeping the focus on what happened in Japan: First, for market technicians, this is a perfect “outside day” reversal signal. This is when a new high is set in an uptrend, a buying climax, and the buying exhausts and weak speculative longs are quickly shaken out of positions forcing prices to lower lows than the prior day (closing near the lows). The wider the range, and the more significant the volume, the higher the likelihood that a trend reversal is underway.
With that in mind, to the far right, you can see the spike in volume for the day.
As far as the range is concerned, we discussed the significance of a 1,000 point range historically.
So technically, there’s a fair reason to bet on a reversal here for Japanese stocks here. That leaked over into European stocks today. German stocks were down 1.4%. And it looked like U.S. stocks might have the same fate today, but the “buy the dip” appetite was clearly strong. If history is any indication, we might have better levels to buy the dip. And the dips in recent history have been lucrative: sharp but quickly recovered.
Join our Billionaire’s Portfolio subscription service today to get your portfolio in line with the most influential investors in the world, and hear more of my actionable political, economic and market analysis. Click here to learn more.
Oil is up over 3% today, trading up to the highest levels since June of 2015.
We were already at new highs for the year as of Friday’s close, and then we get news over the weekend of the political shakeup and arrests in Saudi Arabia.
We’ve talked about the fundamental case for much higher oil prices throughout the recovery last year, and again this summer. You never know what catalyst may come in to accelerate the move in price. We may have had it with this Saudi news.
Among the reasons to expect a potential violent move in oil prices: OPEC has been cutting production into a (ex OPEC, ex U.S.) world that’s not producing (i.e. there’s negative production growth). Given the scars of last year’s oil price bust, oil producers haven’t been spending on new production.
Meanwhile, there’s U.S. supply that is supposed to fill that void, but U.S. supply has been in consistent draw down, 26 of the past 31 weeks, to the tune of 8% lower supply.
Add to this, we have a global economy that’s improving, and with that, demand is increasing. And we have U.S. fiscal stimulus entering to stoke those flames.
We looked at this chart last month.
Source: Billionaire’s Portfolio
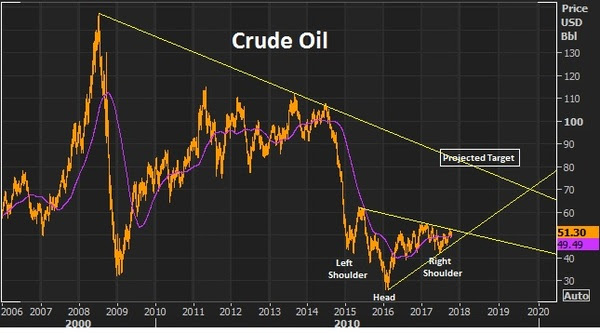
We had this this inverse head and shoulders (in the chart above) that projected a move back to the low $80s. And as part of that technical picture, we were setting up for a break of a big two-year trendline that would open the doors to a move back into the $70+ oil area.
That line broke at around $51.50, confirming that head and shoulders pattern, and the move has been aggressive since. We now have this chart …
Source: Billionaire’s Portfolio
This is beginning to play out according to script for the star commodity investors we talked about this summer, Leigh Goehring and Adam Rozencwajg. They’ve been wildly bullish oil calling for $75 to $110 oil. Earlier in the summer, they said “when inventory gets this low we run the risk of triple digit oil prices.” And they suspected a supply disruption could give us a sharp move higher.
Do the events in Saudi Arabia present a potential supply disruption? Earlier this year, Stratus Advisors, an energy research and consulting shop, projected potential oil-supply disruption scenarios. Among the scenarios, was “internal instability in Saudi Arabia.”
Join our Billionaire’s Portfolio subscription service today to get your portfolio in line with the most influential investors in the world, and hear more of my actionable political, economic and market analysis. Click here to learn more.
Over the past two weeks we’ve talked about the two big central bank events. The first was the ECB’s decision last week. As expected, they signaled they will be exiting QE. The second was the anticipated announcement of a new Fed chair. This is a high consequence decision.
I thought early on that the President would show Yellen the door, given that the rate hiking campaign she has been leading at the Fed poses a threat to choke off the impact of the big fiscal stimulus efforts that have been the hallmark of the Trump Presidency.
She stayed longer than I expected. But today we get her replacement: the current voting Fed governor Jerome Powell. Powell has voted with Yellen, along the way. So, it doesn’t appear to be a philosophical change and it doesn’t appear to be a person Trump can influence – but he offers the President party alignment.
I thought Neel Kashkari had postured perfectly to get the job. He has experience at the Treasury overseeing the TARP program through the ugliest period of the financial crisis. And he’s a newbie Fed governor, but one that has dissented on rate hikes and argued to wait for inflation to take hold before moving on rates (to ensure sustainability of the recovery). That view aligns much friendlier with the Trump administrations economic plan.
The Fed chair role was, arguably (unquestionably, to me), the most important role in the world under the Bernanke reign. Bernanke was the right guy, in the right place, at the right time. As a student of the Great Depression he led the Fed through decisions that pulled the world back from the edge of total collapse. At stages through the crisis, the Fed and Bernanke took a lot of heat – and a lot of it came from world leaders, and even global central banks. But had the Fed not swiftly acted to help foreign banks early on (that were frozen from the lack of access of U.S. dollars), the global financial system would have imploded.
Other central banks then underestimated the scale of the crisis and started hiking rates too early, in 2010 and 2011, which ultimately put them back in to recession (most notably, Europe). The Fed stayed put.
Over time, Bernanke’s Fed (and his aggressive QE) proved to be right, and ultimately provided the playbook for major central banks to follow.
Under the Yellen regime, the track record has been spotty, nearly killing the recovery last year, by continually telegraphing a much tighter credit environment ahead. But the policy course was bailed out by the election of a new President and administration that is hell-bent on pumping up the economy.
Now Powell takes over at a more critical juncture. The execution on fiscal stimulus is beginning to materialize, and we’ll get to see how he navigates it. Hopefully, he’ll let the economy run a little hot (chase inflation from behind), and not allow rates (or the perception of tighter credit) to kill the animal spirits that can accompany big tax cuts and government spending programs.
Join our Billionaire’s Portfolio subscription service today to get your portfolio in line with the most influential investors in the world, and hear more of my actionable political, economic and market analysis. Click here to learn more.
The Fed decision today was a snoozer, as expected. The market continues to think we get a third rate hike for the year in December (fourth since the election).
Thus far, with three hikes, we’ve had just about the equivalent (just shy of 75 basis points) priced-in to the 10-year Treasury market. Yields popped from about 1.70% on election night (just about a year ago) to a high of 2.64%. We’ve had some swings since, but we sit now at roughly 2.40% (70 basis points higher over the past year).
We revisited yesterday, the prospects for some significant wage growth (and therefore inflation), with the fuel of fiscal stimulus feeding into an already tight (but underemployed) labor market.
The Treasury market isn’t pricing that scenario in, at all.
In fact, the yield curve continues to look more like a world that doesn’t fully believe fiscal stimulus is happening (or will happen), and does believe the Fed is more likely damaging the economy through its rate “normalization.”
That’s a bet that continues to underprice the prospects of fiscal stimulus. And, therefore, that’s a bet that continues to be disconnected from the message other key markets are sending. Over the past six months, we’ve talked the case for stocks to go much higher. We’ve talked about the opportunities in European and Japanese stocks (German stocks hitting new record highs and Japanese stocks nearing new 26-year highs today). We’ve talked a lot about the building bull market in commodities. We’ve talked about the positive signals that copper has been sending, as the leading indicator of a global economic turning point. We’ve talked about the outlook for much higher oil prices – oil hit $55 today. (July 30: Explosive Move Coming For Oil And Commodities Stocks).
And oil prices, whether the central banks like to admit it or not, heavily impact inflation, inflation expectations and policy making decisions.
With that, this next chart suggests that market interest rates are about to make a move (higher).
Source: Billionaire’s Portfolio
Join our Billionaire’s Portfolio subscription service today to get your portfolio in line with the most influential investors in the world, and hear more of my actionable political, economic and market analysis. Click here to learn more.
Let’s take a look today at what fiscal stimulus might do to inflation.
The central banks have been able to boost asset prices. They’ve been able to restore stability so that people felt confident enough to hire, spend and invest again. But the scars from over-indebtedness have left demand weak. And because of that, despite the recovery of the unemployment to under 5%, the quality of jobs haven’t returned. And, therefore, the leverage to command higher wages hasn’t been there. That’s been the missing piece of the recovery puzzle.
And with that, we’ve had an ultra-low inflation recovery. That sounds great (low inflation).
But inflation at these low levels has had us (through much of the past decade) teetering on the edge of deflation. That’s bad news.
Among the many threats throughout the crisis period, a deflationary spiral was one of the Fed’s most feared. Central bankers can fight inflation (by raising rates). But they can’t fight deflation when consumer psychology takes over. When people hold on to their money thinking things will be cheaper tomorrowthan they are today, that mindset can bring the economy to a dead halt. It’s a formula that can become irreversible.
And that’s what has kept the Fed (and global central banks) sitting at ultra-low levels of interest rates – to keep the recovery momentum moving so that they don’t have to fight a deflationary spiral (as they have in Japan, unsuccessfully, for two decades).
Now, enter fiscal stimulus. We’re getting fiscal stimulus into an already tight employment market.
Real wages (employee purchasing power) has barely budged for two decades. Introducing big tax cuts and government spending into an economy that has low unemployment and the best consumer credit worthiness on record should pop demand. And that should finally give us some wage growth – maybe bigwage growth.
All of the inflationists that thought QE was going to cause hyper-inflation were wrong – they didn’t understand the severity and breadth of the crisis. Now, after global unlimited QE has barely moved the needle on inflation, the inflation hawks have been lulled to sleep. It may be time to wake them up.
Join our Billionaire’s Portfolio subscription service today to get your portfolio in line with the most influential investors in the world, and hear more of my actionable political, economic and market analysis. Click hereto learn more.
Yesterday we talked about the case for commodities and the opportunity for a rotation into commodities stocks.
The valuation of commodities relative to stocks has only been this disconnected (stocks strong, commodities weak) twice, historically over the past 100 years: at the depths of the Great Depression in the early 30s and toward the end of the Bretton Woods currency system.
That supports the case that we’re in the early days of a bull market in commodities, especially considering where we stand in the global economic recovery, underpinned by the “reflation” focus at both the monetary and fiscal policy levels. It’s a recipe for hotter demand for commodities.
With that, let’s take a look at a few charts as we close the week.
Copper
We talked about copper yesterday. This continues to ring the bell, alerting us that better economic growth is coming – maybe a boom.
Copper is up 6.5% in the past two weeks, back of $3 and closing in on the highs of the year – which is a three year high. And remember, we looked at the potential break of this big six-year downtrend back in August. That has broken, retested and confirms the trend change.
Crude Oil
We talked about the fundamental case for oil this week. And we looked at the technical case, as it made a brief test of the 200 day moving average and quickly bounced back. It’s up about 4% on the week.
We have this inverse head and shoulder (in the chart below) that projects a move back to the low $80s. And as part of that technical picture, we’re setting up for a break of a big two-year trendline that should open the doors to a move back into the $70+ oil area.
Iron Ore
Iron ore was the biggest mover of the day – up 6% today. This has been a deeply depressed market through the post-financial crisis era. In addition to the broad commodities weakness, iron ore prices have suffered from the dumping of poor quailty iron ore by Chinese producers. Those times seem to be changing.
This week there was a fraud claim on a big Japanese steel maker for fudging it’s quality data. Keep an eye on this one as it could lead to more, and could lead to a supply disruption in industrial metals.
Then today we had Chinese data that showed record imports of iron ore. This is a signal that there’s both an envirionmental movement and an anti-dumping movement against low grade iron ore that has been influencing supply and prices (and crushing producers). This big Chinese data point is also in line with the message copper is sending: perhaps the Chinese economy is doing better than most think.
With that, let’s take a look at a few charts as we close the week. The valuation of commodities relative to stocks has only been this disconnected (stocks strong, commodities weak) twice, historically over the past 100 years: at the depths of the Great Depression in the early 30s and toward the end of the Bretton Woods currency system.
Join our Billionaire’s Portfolio today to get your portfolio in line with the most influential investors in the world, and hear more of my actionable political, economic and market analysis. Click here to learn more.
Crude oil was the biggest mover of the day across global markets, up almost 3%, and back above the $50 level.
Though oil has been stuck, oscillating around this $50 mark for some time, we’ve talked about the prospects for much higher oil prices. So, when?
Remember, back in May I spoke with one of the best research-driven commodities funds on the planet, led by the star commodities investor Leigh Goehring and his long-time research head Adam Rozencwajg. They do some of the most thorough supply/demand work on oil and broader commodities.
Earlier this year, they were pounding the table on the fundamental case for $100 oil again. Since then, as oil prices haven’t complied. With that, we’ve seen Andy Hall’s departure from the market, of one of the biggest oil bulls, and one of the best and most successful tactical traders of oil in the world.
Meanwhile, the fundamentals have continued to build in favor of much
higher oil prices. We’ve seen supply drawdown for the better part of the past seven months – to the tune of more than $60 million barrels of oil taken out of the market.
I checked back in with Goehring and Rozencwajg and they are now more bullish than before. They say demand is raging, supply is faltering, and the world has overestimated what the shale industry is capable of producing – and the market is leaning, heavily, the wrong way (i.e. “maximum bearishness”). They think we’ve now hit the tipping point for prices – where we will see the price of oil accelerate.
They’re calling for $75-$110 oil by early next year, based on their historical analysis of price and inventory levels.
We’ll talk more about their work on the oil market in the coming days, and their very interesting work on the broader commodities markets – both of which support the themes we’ve been discussing in recent months.
As we head into the weekend, today I want to talk a bit about the 401k.
I’m looking today at a relatives 401k offering. Nothing has made Wall Street richer than the advent of the 401k. They get a constant monthly stream of fresh capital to skim fees and commissions from, and you get all of the market risk.
For the average person, selecting from the “options” in their 401k plan is a practice of picking the highest number. No surprise, the fund providers know that, and play plenty of games to show you the best numbers possible.
Here’s an example: As I’m looking through the limited choices in this particular 401k plan provider, there is a common theme in the “inception date” of most of the company’s mutual fund offerings. They tend to have track records that start in 2002 at or near the bottom of the internet bubble-induced stock market crash, OR they start in 2009 AFTER the 50% collapse in stocks, OR they start in late 1987 AFTER the crash.
Clearly the long-term returns will look quite a bit better when you’re starting from a bottom, after a crash. And clearly returns will look better without hanging a negative 30%-50% in 2008 and then another negative 30%-40% in the early 2000s.
Maybe they are newer, better strategies and had the good fortune of launching at the right time?
More often, they close them down and reopen them under a new, tweaked name. Add to that, they are constantly launching and running hundreds, if not thousands of funds, so that at any given time they can cherry pick the best performers over a certain period, to put them in front of a captive audience.
Bottom line: Big mutual fund giants are mass asset gatherers feeding on the passive 401k flow of capital, rather than astute investment managers. And the long term returns, after fees, prove it. People are locking their money up for a very long time, and getting a fraction of the market return.
When Congress invented the 401k in the 70s to transfer risk and obligations from the employer (traditional defined benefit pensions) to the employee (defined contributions), they didn’t do you any favors.
The media is giving more attention today to the potential change in power at the Fed. We talked about this on Monday. Remember, the President said last week that he expected an announcement to be made in the next two or three weeks on the future Fed Chair.
Along with any advancement on the fiscal stimulus front, the appointment of the next Fed Chair will be the most important news for markets and economy this year (though Yellen isn’t officially done until January of 2018).
Back in March I made the case for Trump ousting Yellen and hiring the Fed newbie, Neel Kashkari. Admittedly, I didn’t think Yellen would last this long. While Bernanke (the former Fed Chair) can be credited for averting a global apocalypse and keeping the patient alive, for as long as it took to bridge the gap to a real recovery. Under Yellen’s leadership, the Fed has been doing it’s best to kill the patient, at precisely the time the real recovery could be taking shape, with the assistance of fiscal stimulus finally in the works.
If the Fed continues on its path, borrowing costs (or, as importantly, the perception of where they may go) may strangle the economy before fiscal stimulus gets out of the gate. This is why I’ve said Kashkari should be the President’s best friend at the Fed. He’s the lone dissenter on the rate hiking path, and he’s been vocal about leaving monetary policy alone until the inflation data warrants a move.
Kashkari released an essay on Monday where he blames the Fed for creating its own low inflation surprise by tightening money and forecasting a tighter path for monetary policy, therefore creating a contractionary effect on the economy as consumers/businesses anticipated the negative effects of higher rates on the economy.
Guess who made this same case? Bernanke. He did so in a blog post last year, around this time. It was just as the world was spiraling into negative rates. He said the Fed shot itself in the foot by publishing an overly optimistic trajectory and timeline for normalizing rates. And that the communication alone resulted in an effective tightening.
This is why the ten year yield (still at just 2.34% after four rate hikes) is pricing in something that looks a lot more like recession than a hot economy.
With the above in mind, there has been a roster of candidates for Fed Chair floated today, which did not include Neel Kashkari. That was until word began to circulate that Jeff Gundlach, manager of the world’s biggest bond fund, said yesterday that he thinks Kashkari will get the nod, because he’s the most easy money guy. Still, it was refuted in the media that he was even a candidate.
With a Fed decision queued up for tomorrow, let’s take a look at how the rates picture has evolved this year.
The Fed has continued to act like speculators, placing bets on the prospects of fiscal stimulus and hotter growth. And they’ve proven not to be very good.
Remember, they finally kicked off their rate “normalization” plan in December of 2015. With things relatively stable globally, the slow U.S. recovery still on path, and with U.S. stocks near the record highs, they pulled the trigger on a 25 basis point hike in late 2015. And they projected at that time to hike another four times over the coming year (2016).
Stocks proceeded to slide by 13% over the next month. Market interest rates (the 10 year yield) went down, not up, following the hike — and not by a little, but by a lot. The 10 year yield fell from 2.33% to 1.53% over the next two months. And by April, the Fed walked back on their big promises for a tightening campaign. And the messaging began turning dark. The Fed went from talking about four hikes in a year, to talking about the prospects of going to negative interest rates.
That was until the U.S. elections. Suddenly, the outlook for the global economy changed, with the idea that big fiscal stimulus could be coming. So without any data justification for changing gears (for an institution that constantly beats the drum of “data dependence”), the Fed went right back to its hawkish mantra/ tightening game plan.
With that, they hit the reset button in December, and went back to the old game plan. They hiked in December. They told us more were coming this year. And, so far, they’ve hiked in March and June.
Below is how the interest rate market has responded. Rates have gone lower after each hike. Just in the past couple of days have, however, we returned to levels (and slightly above) where we stood going into the June hike.
But if you believe in the growing prospects of policy execution, which we’ve been discussing, you have to think this behavior in market rates (going lower) are coming to an end (i.e. higher rates).
As I said, the Hurricanes represented a crisis that May Be The Turning Point For Trump. This was an opportunity for the President to show leadership in a time people were looking for leadership. And it was a chance for the public perception to begin to shift. And it did. The bottom was marked in Trump pessimism. And much needed policy execution has been kickstarted by the need for Congress to come together to get the debt ceiling raised and hurricane aid approved. And I suspect that Trump’s address to the U.N. today will add further support to this building momentum of sentiment turnaround for the administration. With this, I would expect to hear a hawkish Fed tomorrow.
Join our Billionaire’s Portfolio today to get your portfolio in line with the most influential investors in the world, and hear more of my actionable political, economic and market analysis. Click here to learn more.


 Let’s take a look today at what fiscal stimulus might do to inflation.
 Yesterday we talked about the case for commodities and the opportunity for a rotation into commodities stocks.


 Iron Ore

 Oil is up over 3% today, trading up to the highest levels since June of 2015.

 The Fed decision today was a snoozer, as expected. The market continues to think we get a third rate hike for the year in December (fourth since the election).