
November 3, 2017, 4:00pm EST
|
 As we head into the weekend, we’re closing in on the holidays and year-end. The performance of stocks continue to reflect a world where companies are strong, and consumers are strong.
|

|
|
November 3, 2017, 4:00pm EST
|
|
|
|
|
|
|
By Bryan Rich
October 16, 2017, 4:00 pm EST
 On Friday we talked about the biggest market movers: oil, copper and iron ore.
Oil was up 5.3% on the week. Copper was up 4%. And iron ore reversed sharply on Friday to jump 6%.
All were stronger again today.
Remember, China is the world’s largest consumer of commodities. And the import data late last week out of China showed hotter imports in copper and copper products (26.5% growth, year over year), iron ore (record high imports, up 10% from a year earlier), and crude oil imports hit the second highest level on record (up 12% year over year).
This leaves us wondering: Is China’s economy doing better than most think? And/or is this China hoarding commodities again?
At the depths of the financial crisis, China opportunistically stepped in and started gobbling up global commodities on the cheap (at the time).

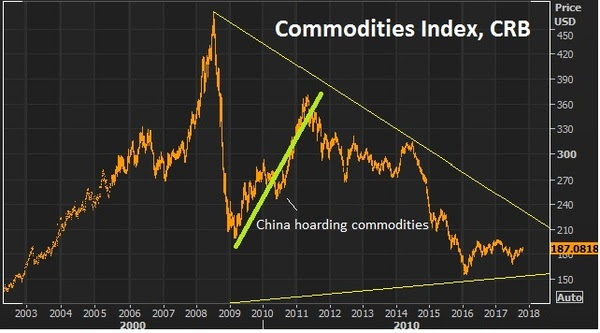
Remember, China has $3 trillion in currency reserves, about $2 trillion of which are in U.S. dollars. Commodities are a good way to put those dollars to work.
And there always seems to be currency play at work in China, to gain some sort of advantage. You can see in the chart below, as the PBOC has weakened the yuan, commodities prices have fallen. And as they’ve been strengthening the currency this year, we may be seeing commodities coming back as a result.

Join our Billionaire’s Portfolio today to get your portfolio in line with the most influential investors in the world, and hear more of my actionable political, economic and market analysis. Click here to learn more.
By Bryan Rich
October 12, 2017, 7:30 pm EST Invest Alongside Billionaires For $297/Qtr
For much of the summer, while the world has been obsessed with Trump tweets, we’ve talked about the sharp but under-acknowledged move in copper and the message it was sending about the global economy and China (the biggest consumer of commodities), specifically. As I’ve said, people should Stop Watching Trump And Start Watching Copper.
Why copper? It is often an early indicator of economic cycles. People love to say copper ‘has a Ph.D. in economics’ because it tends to top early at economic peaks and bottom early at economic troughs. And it tends to lead a bull market in broader commodities.
Well, copper bottomed on January 15. Fast forward to today; the most important industrial metal in the world is up 24% on the year and sniffing back toward three-year highs. While the world continues to focus on Washington drama, this continues to be the proverbial “bell” ringing to signal a pop in economic growth is coming, and a big run for commodities investors is ripe for the taking.
With that in mind, we’ve talked in recent days again about the research from the top minds in commodities investing, Leigh Goehring and Adam Rozencwajg (managers of the commodities funds, ticker GRHIX and GRHAX). We know they like oil. In fact they think we see triple-digit oil prices by early next year.
They love the commodities trade in general. They have one of the most compelling charts I’ve seen in my 20-year career, to support the view that there is a generational bull breaking lose in commodities.
Stocks minted billionaires in the 1980s. Currencies minted billionaires in the 1990s. Tech and housing (bust) minted billionaires in the early 2000s. Then it was equity activism (stocks). The next opportunity looks like commodities.
In this chart below you can see, as Goehring and Rozencwajg say, commodities are as cheap today as they have ever been. “Only in the depths of the Great Depression and at the end of the dying Bretton Woods Gold Exchange Standard did commodities reach this level of undervaluation relative to equities.”

With this, they say, for those that can block out the noise, “there is a proverbial fortune to be made if they invest today.”
Here’s an excerpt from their most recent investor letter on their work on the stocks to commodities valuation:
“When commodities are this cheap relative to stocks, the returns accruing to commodity investors have been spectacular. For example, had an investor bought the Goldman Sachs Commodity Index (or something equivalent) in 1970, by 1974 he would have compounded his money at 50% per year. From 1970 to 1980 commodities compounded anually in price by 20%. If the same investor had bought commodities in 2000, he would have also compounded his money at 20% for the next ten years–especially attractive considering the broad stock market indicies returned nothing over the same period.”
Join our Billionaire’s Portfolio today to get your portfolio in line with the most influential investors in the world, and hear more of my actionable political, economic and market analysis. Click here to learn more.
October 10, 2017, 3:00 pm EST
Crude oil was the biggest mover of the day across global markets, up almost 3%, and back above the $50 level.
Though oil has been stuck, oscillating around this $50 mark for some time, we’ve talked about the prospects for much higher oil prices. So, when?
Remember, back in May I spoke with one of the best research-driven commodities funds on the planet, led by the star commodities investor Leigh Goehring and his long-time research head Adam Rozencwajg. They do some of the most thorough supply/demand work on oil and broader commodities.
Earlier this year, they were pounding the table on the fundamental case for $100 oil again. Since then, as oil prices haven’t complied. With that, we’ve seen Andy Hall’s departure from the market, of one of the biggest oil bulls, and one of the best and most successful tactical traders of oil in the world.
Meanwhile, the fundamentals have continued to build in favor of much
higher oil prices. We’ve seen supply drawdown for the better part of the past seven months – to the tune of more than $60 million barrels of oil taken out of the market.
I checked back in with Goehring and Rozencwajg and they are now more bullish than before. They say demand is raging, supply is faltering, and the world has overestimated what the shale industry is capable of producing – and the market is leaning, heavily, the wrong way (i.e. “maximum bearishness”). They think we’ve now hit the tipping point for prices – where we will see the price of oil accelerate.
They’re calling for $75-$110 oil by early next year, based on their historical analysis of price and inventory levels.
We’ll talk more about their work on the oil market in the coming days, and their very interesting work on the broader commodities markets – both of which support the themes we’ve been discussing in recent months.
October 9, 2017, 4:00 pm EST
As we know, one of the pillars of the Trump administration’s growth policies has been deregulation. With that, today the head of the EPA signaled the withdrawal from the Clean Power Plan – an Obama regulation to fight climate change.
What does this mean for coal stocks?
Let’s take a look at the two largest American coal producers, both of which filed bankruptcy last year: Peabody Energy and Arch coal.
These are now two post-bankruptcy stocks! Peabody emerged from bankruptcy earlier this year after shedding about $5 billion in debt. Similar story for Arch coal. They filed early last year and emerged from bankruptcy late last year, eliminating $5 billion in debt in the process. So shareholders were wiped out and debt holders became stock holders in new low debt, cash flow positive companies with deregulation coming down the pike. With that, you would think the stocks would be screaming higher. That hasn’t been the case.
Here’s a look at the charts…


So we now have Peabody Energy, the leading coal producer in America with a $3 billion market cap. And Arch Coal, number two, has just a $1.7 billion market cap.
Are these cheap stocks?
Let’s take a look at who owns them…
The biggest shareholder in Peabody is billionaire Paul Singer’s hedge fund, Elliott Management. They own half a billion dollar’s worth of the stock and it’s a top ten position. As for ARCH – the top shareholder is the $5 billion hedge fund Monarch Alternative Capital. ARCH makes up 20% of their highly concentrated long equity portfolio (their biggest single stock position). If you’re going to dip your toe in the water on a post-bankruptcy stock, there are few better places to look for guidance than Paul Singer – a former attorney, turned one of the most influential and successful investors in the world.
October 6, 2017, 4:00 pm EST
As we head into the weekend, today I want to talk a bit about the 401k.
I’m looking today at a relatives 401k offering. Nothing has made Wall Street richer than the advent of the 401k. They get a constant monthly stream of fresh capital to skim fees and commissions from, and you get all of the market risk.
For the average person, selecting from the “options” in their 401k plan is a practice of picking the highest number. No surprise, the fund providers know that, and play plenty of games to show you the best numbers possible.
Here’s an example: As I’m looking through the limited choices in this particular 401k plan provider, there is a common theme in the “inception date” of most of the company’s mutual fund offerings. They tend to have track records that start in 2002 at or near the bottom of the internet bubble-induced stock market crash, OR they start in 2009 AFTER the 50% collapse in stocks, OR they start in late 1987 AFTER the crash.
Clearly the long-term returns will look quite a bit better when you’re starting from a bottom, after a crash. And clearly returns will look better without hanging a negative 30%-50% in 2008 and then another negative 30%-40% in the early 2000s.
Maybe they are newer, better strategies and had the good fortune of launching at the right time?
More often, they close them down and reopen them under a new, tweaked name. Add to that, they are constantly launching and running hundreds, if not thousands of funds, so that at any given time they can cherry pick the best performers over a certain period, to put them in front of a captive audience.
Bottom line: Big mutual fund giants are mass asset gatherers feeding on the passive 401k flow of capital, rather than astute investment managers. And the long term returns, after fees, prove it. People are locking their money up for a very long time, and getting a fraction of the market return.
When Congress invented the 401k in the 70s to transfer risk and obligations from the employer (traditional defined benefit pensions) to the employee (defined contributions), they didn’t do you any favors.
October 5, 2017, 4:00 pm EST
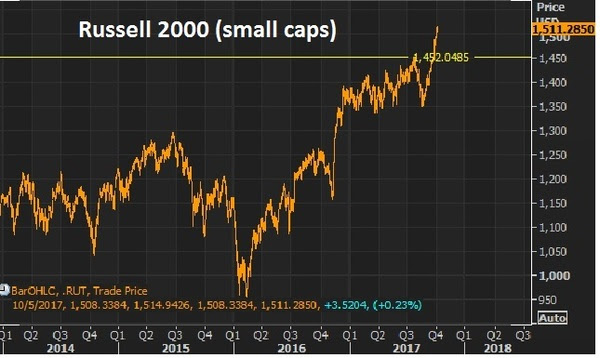
We looked at small caps last week when the the Russell 2000 broke to new highs.
Remember, at that point, small–caps had done only 9% on the year at this point. That’s against 13% for the S&P and Dow.
Here’s the chart now…

The Russell 2000 is now up 12% since the lows of August (up 11% ytd) and if you bought the small cap index on the Monday before the elections last year, you’re up 26%. But small caps continue to lag the bigger cap market. And that makes the last quarter a very intriguing opportunity to own small caps.
Bull markets tend to lift all boats. And with that, equal-dollar weighted small caps tend to outperform equal-dollar weighted large caps in bull markets (in some cases by a lot). This one (bull market) looks like plenty of room to go in that regard. And small cap companies should have more to gain from a corporate tax cut as the tend to have fewer ways to shelter income (relative to big multinationals).
Now, with that bull market assertion, let’s talk about the general uneasiness that seems to exist (and has for a while) from watching the continued climb in stocks.
As we’ve discussed, you often here the argument that the fundamentals don’t support the level of stocks. It’s just not true. The fundamental backdrop continues to justify and favor higher stocks. We have the prospects of fiscal stimulus building, which will be poured onto an already fertile economic backdrop — with low rates, cheap commodities, record consumer high credit worthiness and low unemployment.
As the old market adage goes, “bull markets are born on pessimism, grow on skepticism, mature on optimism and die on euphoria.” I don’t think anyone could argue we are currently in the state of euphoria for stocks. And as the great macro trader Paul Tudor Jones has said, “the last third of a great bull market is typically a blow-off, whereas the mania runs wild and prices go parabolic” (i.e. euphoria can last for a while).
Finally, let’s revisit this analysis from billionaire Larry Robbins on the influence of low interest rates, Fed policy and oil on markets. He says every time ONE of these (following) conditions has existed, the market has produced positive returns.
Here they are:
Again, his study showed that there has NEVER been a down year stocks, when any ONE of the above conditions is met.
It worked in 2015. It worked in 2016. And now, not only does ONE of these conditions exist, but ALL of these conditions are (or have been) met for 2017.
October 4, 2017, 4:00 pm EST
The media is giving more attention today to the potential change in power at the Fed. We talked about this on Monday. Remember, the President said last week that he expected an announcement to be made in the next two or three weeks on the future Fed Chair.
Along with any advancement on the fiscal stimulus front, the appointment of the next Fed Chair will be the most important news for markets and economy this year (though Yellen isn’t officially done until January of 2018).
Back in March I made the case for Trump ousting Yellen and hiring the Fed newbie, Neel Kashkari. Admittedly, I didn’t think Yellen would last this long. While Bernanke (the former Fed Chair) can be credited for averting a global apocalypse and keeping the patient alive, for as long as it took to bridge the gap to a real recovery. Under Yellen’s leadership, the Fed has been doing it’s best to kill the patient, at precisely the time the real recovery could be taking shape, with the assistance of fiscal stimulus finally in the works.
If the Fed continues on its path, borrowing costs (or, as importantly, the perception of where they may go) may strangle the economy before fiscal stimulus gets out of the gate. This is why I’ve said Kashkari should be the President’s best friend at the Fed. He’s the lone dissenter on the rate hiking path, and he’s been vocal about leaving monetary policy alone until the inflation data warrants a move.
Kashkari released an essay on Monday where he blames the Fed for creating its own low inflation surprise by tightening money and forecasting a tighter path for monetary policy, therefore creating a contractionary effect on the economy as consumers/businesses anticipated the negative effects of higher rates on the economy.
Guess who made this same case? Bernanke. He did so in a blog post last year, around this time. It was just as the world was spiraling into negative rates. He said the Fed shot itself in the foot by publishing an overly optimistic trajectory and timeline for normalizing rates. And that the communication alone resulted in an effective tightening.
This is why the ten year yield (still at just 2.34% after four rate hikes) is pricing in something that looks a lot more like recession than a hot economy.
With the above in mind, there has been a roster of candidates for Fed Chair floated today, which did not include Neel Kashkari. That was until word began to circulate that Jeff Gundlach, manager of the world’s biggest bond fund, said yesterday that he thinks Kashkari will get the nod, because he’s the most easy money guy. Still, it was refuted in the media that he was even a candidate.
October 2, 2017, 4:00 pm EST
Stocks open the week with another record high. The dollar continues to do better. And as we open the new month, yields are now up 32 basis points from the lows of early last month.
That’s a dramatic shift in the interest rate environment. And in recent days, underpinning that strength, is the idea that a hawk could be taking over for Janet Yellen when her term ends at the end of January.
Over the past few days the President has met with candidates for the Fed Chair job, and has said he will be announcing his decision in the next two to three weeks. That’s a big deal for markets and the economy — something to keep a close eye on.
His interview last Thursday was with a known hawk, former Fed governor Kevin Warsh – who has publicly criticized the Fed for keeping rates too low. He was also a hawk through some of the darkest days of the recovery – he’s been proven wrong for that view. As for Yellen: She has been among the most dovish Fed members throughout the crisis but has been leading the rate normalization phase (i.e. higher rates), which has proven to be questionable judgment, with missteps along the way resulting from the Fed’s overly optimistic and hawkish outlook.
Interestingly, though Trump criticized the Fed for keeping rates too low throughout the recovery, it’s higher rates, now, that are a significant threat to his growth policies. So he needs the Fed to step out of the way, and do no harm to the hand-off from a monetary policy-driven recovery, to a fiscal policy driven-recovery. Higher rates can choke off the positive effects of tax cuts and government spending.
On that note, his friend on monetary policy should be (and I think will be) Neel Kashkari (a new Fed member). Kashkari has been the lone dissenter on the Fed’s tightening path, arguing along the way to let the economy run hot, to ensure a robust recovery, before moving on rates.
Over the past two years, Yellen has blamed their pauses in their tightening program to the lack of evidence that the economy is overheating. It’s safe to say that the economy is not overheating (nor has it been), with both growth and inflation still undershooting long run averages.
 The Fed decision today was a snoozer, as expected. The market continues to think we get a third rate hike for the year in December (fourth since the election).