
|
December 5, 5:00 pm EST
I was away from the markets yesterday, on a big down day. With markets closed today to honor the 41st President, let’s take a look at what happened on Tuesday.
Why the ugly and persistent plunge in stocks?
Many of the reasons that have been attributed to the two stock market corrections this year, bubbled up again yesterday. But as we’ve discussed, the stock declines this year appear to have had everything to do with Saudi capital flows–and less to do with all of the hand-wringing issues you hear and read in the financial media. Same can be said for yesterday.
When prospects rise that Saudi assets may be threatened by sanctions(or seizures in the case earlier this year, related to the Crown Prince’s corruption crackdown) indiscriminate and aggressive selling of U.S. assets hit immediately (likely led by the Saudi sovereign wealth fund, which has assets over half a trillion dollars).
We had it again yesterday. Stocks had a big gap up on Monday on movement on U.S./China trade. It was after the close on Monday that the news hit that the CIA would brief the special Senate committee on Tuesday. Stocks immediately started moving lower. The Dow futures were down 250 points by midnight. And then of course, yesterday, when news hit that the briefing was underway (just after noon), the bottom immediately fell out of stocks. A little more than half an hour later, U.S. Senators were standing in front of cameras telling the world that the Crown Prince was involved in the murder and that Congress should invoke the Magnitsky Act. This law authorizes the government to sanction human rights offenders, freeze their assets, and ban them from entering the U.S.
With that, I suspect this was nothing more than grandstanding. Trump will not (can not) act for the reasons we discussed last month.
If he sanctioned the Saudi government over this, oil prices would probably explode and stocks would crash (not really an option).
We’ll see how stocks react tomorrow after a day of reflection. I suspect Tuesday created another buying opportunity.
|
|
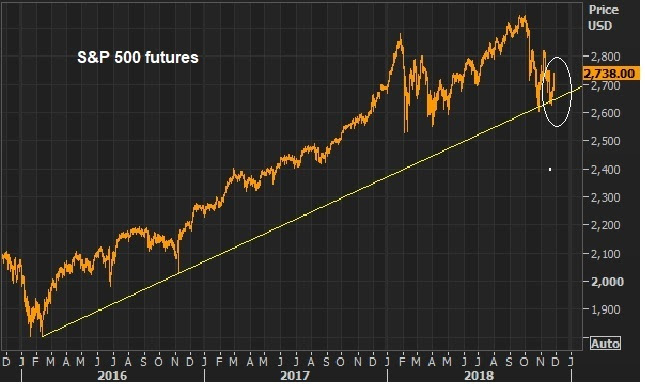
November 30, 5:00 pm EST As we close the week and month, let’s take a look at some key charts. Stocks have now bounced 5% since last Friday. And that bounce was technically supported by this big long-term trendline we’ve been watching … |
 |
|
And, as of this week, stocks now have the additional fuel of a more stable outlook for interest rates. |
 |
|
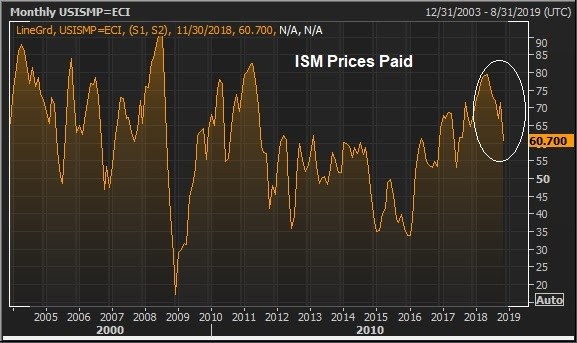
The surge above 3% on the ten-year yield sustained that level, even in the face of a stock market decline. That signal created fears that the Fed might be on course to choke-off economic momentum. But that has now been quelled by the Fed’s clear signal this week that they are near the end of their rate normalization program. The 10-year ends the week well off the highs of the past two months, and at the important 3% level. The dramatic adjustment lower in oil prices should also be additional fuel for stocks … |
 |
|
An overhang of risk to global markets has been the potential for sanctions on the Saudi government. But the issue seems to be now settled, with the sanctioning of Saudi individuals which do NOT include the Saudi Crown Prince and/or government. And as we’ve discussed, Trump has used the leverage over the Saudi Crown Prince to influence oil prices lower (for the moment). With that above in mind, stocks finish the week well bid. If we can get at least a standstill agreement on the U.S./China trade war from this weekends meetings between Presidents Trump and Xi, that may be enough to fuel a melt-UP to new highs on stocks by the end of December. It may be time for Trump to get a deal done, and solidify economic momentum to get him to a second term, where he may then re-address the more difficult structural issues with China/U.S. relations. What stocks do you buy? Join me here to get my curated portfolio of 20 stocks that I think can do multiples of what broader stocks do, coming out of this market correction environment.
|
|
THURSDAY, DECEMBER 7, 2017
With all that’s going on in the world, the biggest news of the day has been Bitcoin.
People love to watch bubbles build. And then the emotion of “fear of missing out” kicks in. And this appears to be one.
Bitcoin traded above $16,000 this morning. In one “market” it traded above $18,000 (which simply means some poor soul was shown a price 11% above the real market and paid it).
As we’ve discussed, there is no way to value Bitcoin. There is no intrinsic value. To this point, it has been bought by people purely on the expectation that someone will pay them more for it, at some point. So it’s speculation on human psychology.
Let’s take a look at what some of the most sophisticated and successful investors of our time think about it…
Billionaire Carl Icahn, the legendary activist investor that has the longest and best track record in the world (yes, better than Warren Buffett): “I don’t understand it… If you read history books about all of these bubbles…this is what this is.”
Billionaire Warren Buffett, the best value investor of all-time: “Stay away from it. It’s a mirage… the idea that it has some huge intrinsic value is a joke. It’s a way of transmitting money.”
Billionaire Jamie Dimon, head of one of the biggest global money center banks in the world: “It’s not a real thing. It’s a fraud.”
Billionaire Ray Dalio, founder of one of the biggest hedge funds in the world: “Bitcoin is a bubble… It’s speculative people, thinking they can sell it at a higher price…and so, it’s a bubble.”
Billionaire investor Leon Cooperman: “I have no money in Bitcoin. There’s euphoria in Bitcoin.”
Billionaire distressed debt and special situations investor, Marc Lasry: “I should have bought Bitcoin when it was $300. I don’t understand it. It might make sense to try to participate in it, but I can’t give you any analysis as to why it makes sense or not. I think it’s real, as it coming into the mainstream.”
Billionaire hedge funder Ken Griffin: “It’s not the future of currency. I wouldn’t call it a fraud either. Bitcoin has many of the elements of the Tulip bulb mania.”
Now, these are all Wall Streeters. And they haven’t participated. But this all started as another disruptive technology venture. So what do billionaire tech investors think about it…
Billionaire Jerry Yang, founder of Yahoo: “Bitcoin as a digital currency is not quite there yet. I personally am a believer that digital currency can play a role in our society, but for now it seems to be driven by the hype of investing and getting a return, as opposed to transactions.
Mark Cuban: He first called it a “bubble.” He now is invested in a cryptocurrency hedge fund but calls it a “Hail Mary.”
Michael Novagratz, former Wall Streeter and hedge fund manager. He once was a billionaire and may be again at this point, thanks to Bitcoin: “The whole market cap of all of the cryptocurrencies is $300 billion. That’s nothing. This is global. I have a sense this can go a lot further. He equates it to an alternative (or replacement) for the value of holding gold – which is an $8 trillion market… over the medium term, this thing is going to go a lot higher.” But he acknowledges it shouldn’t be more than 1% to 3% of an average persons net worth.
Now with all of this in mind, billionaire Thomas Peterffy, one of the richest men in America and founder of the largest electronic broker in the U.S., Interactive Brokers, has warned against creating exchange-traded contracts on Bitcoin. He says a large move in the price could destabilize the clearing organizations (the big futures exchanges), which could destabilize the real economy.
With that, futures launch on Bitcoin on Sunday at the Chicago Mercantile Exchange. This is about to get very interesting.
That was the top.
What stocks do you buy? Join me here to get my curated portfolio of 20 stocks that I think can do multiples of what broader stocks do, coming out of this market correction environment.
|
November 28, 5:00 pm EST Yesterday we talked about the perfect setup, coming into today’s scheduled speech by the Fed Chair, for Powell to signal a pause in the Fed’s rate normalization program. The sharp fall in oil prices in the past two months has taken some of the edge off of inflation concerns. And there has already been evidence that the speed at which rates have moved has caused a slowdown in housing. So this was the perfect opportunity for the Fed Chair to give a clear signal that they are near the end on rate normalization. Indeed, that’s what we got. And that did indeed provide a positive catalyst for stocks, and I suspect it will be a positive catalyst for what has been some deterioration of confidence in the economic outlook. That all aligns nicely with the technical picture we’ve been watching in stocks. Here’s another look at the bounce off of this big trendline for stocks, that continues to grow in scale. |
 |
|
So this adjustment in the market’s perception on the interest rate outlook is a catalyst for what could be a very aggressive rebound in stocks into the year end. More fuel would be a positive outcome from the Trump/Xi meetings on U.S./China trade, which will come toward the end of the week. With the above in mind, among the biggest rebounds in global markets should be emerging markets. |
 |
|
As of last month, the MSCI Emerging Markets Index was down 27% from the January highs.
What stocks do you buy? Join me here to get my curated portfolio of 20 stocks that I think can do multiples of what broader stocks do, coming out of this market correction environment.
|
November 27, 5:00 pm EST
Earlier this month, we talked about the big fall in oil prices.
If we look back over the past five years, the magnitude of that move is only matched (or exceeded) in cases where there was significant manipulation in the oil market and/or a systemically threatening oil price crash.
As we’ve discussed, the pressure on oil this time around seems to be about manipulation — and appears to have everything to do with Trump’s leverage over the Saudis (related to sanctioning the Kingdom over the Khashoggi murder).
But we’ve now traded down to the important $50 mark. That’s 35% from the highs of just October 3. And this is an inflection point where it could go bad, but it also could present a goldilocks scenario (a level that’s just right for the U.S. economy).
Sure, cheap oil is good for consumers. You save a few extra bucks at the pump. But in the current environment, it presents risks to the financial system. The shale industry’s break-even point on producing oil is said to be $50. Below that, they dial down production, lay off workers, stop investing and quickly become a default risk to their creditors (U.S. and global banks). We saw it back in 2016. The same can be said for those countries heavily dependent on oil revenues (i.e. they become default risks as oil prices move lower).
That’s the bad side. The good side to the oil price slide? As we’ve discussed, it should relieve some pressure on the Fed. The Fed likes totalk about their inflation readings excluding effects of volatile oil prices. But they have a record of acting on monetary policy when oil is moving.
The bottom line: Oil plays a big role in their view on inflation. And given the quick drop in oil prices, the Fed’s concerns about inflation should be cooling. Again, this opens up the door for the Fed Chair, tomorrow, to take the opportunity in a prepared speech at the Economic Club of New York, to signal a pause coming in the Fed’s rate normalization program. That would be a positive catalyst for economic and market confidence.
|
November 26, 5:00 pm EST After a down 7% October, the S&P 500 was down another 3% for November as we started the week. But stocks had a nice day, continuing to bounce from this big trendline we’ve been watching over the past week. |
 |
|
And the better news: We have potential positive catalysts on the docket for this week that could put a final stamp on this correction. Powell (Fed Chair) gives a prepared speech on Wednesday at the Economic Club of New York. Remember, we were looking for some signal a couple of weeks ago that the Fed might take a pause normalizing rates. We got it, but from the Atlanta Fed President. This week, any indication from the Fed Chair that rate hikes are nearing an end would be a greenlight for stocks. And then we get new information on U.S./China trade relations by the week’s end as Trump and Xi are scheduled for a sit down at the G20 meetings. Among all of the concerns that might be curbing risk appetite (both in markets and the economy) this one is among the biggest. Progress on that front should also trigger relief in stocks. The combination of a more dovish Fed and some clarity on trade would set up for what could be a very aggressive bounce for stocks into the year end. What stocks do you buy? Join me here to get my curated portfolio of 20 stocks that I think can do multiples of what broader stocks do, coming out of this market correction environment.
|
|
|
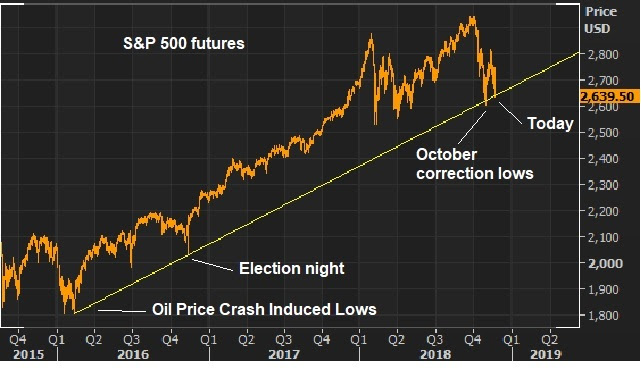
November 20, 5:00 pm EST Stocks hit this big trendline today and bounced. |
 |
|
This line comes in from the oil price crash-induced lows of 2016. And, as you can see, we have the bottom of the fallout in the futures market on election night, and the lows of last month. This area also puts the S&P 500 right at a 10% decline from the October highs. Is it the bottom of this sharp two-day slide? Maybe. Let’s talk about why stocks have gotten hit, again, this week. Last week, it looked like the fog had lifted. We were looking for the Fed to signal a pause on rates. We got it, to a degree, with the message that the ‘normalization phase’ for rates was in the “final days.” We had the U.S. Treasury name those Saudis to be sanctioned in the Khashoggi murder. The Crown Prince wasn’t one of them – which means the Kingdom was not being sanctioned. And we had news that progress was being made on U.S. China trade. That was all good news for stocks. But the latter two of these hurdles for stocks was reversed over the weekend. We had some confrontational talk from Pence and Xi. And we had news that the CIA investigation would implicate the Crown Prince in the murder of Khashoggi. Everyone is well aware of the U.S./China trade implications. As for the Saudi, implications, it’s more complicated. First, Trump has been trying to make the case for Saudi Arabia’s critical alliance in the fight to defeat ISIS and check of Iran. Maybe more importantly, pushing Saudi Arabia toward an alignment with China and Russia in the long-game would be a grave danger for the U.S. Taking action against the Crown Prince would jeopardize both. So, as I suggested earlier in the month, Trump seems to be leveraging the Saudi crisis to get oil prices lower. He said as much today. And to this point, it appears that he’s settled on the sanctions that have already been levied. If that holds, that’s good for stocks. The risk, given the amount of wealth Saudi Arabia has in U.S. capital markets, is any change in that stance that might mean broad sanctions on the Kingdom of Saudi Arabia. That’s where Saudi liquidations, in effort to secure assets, is dangerous for the stock market. Join me here to get all of my in-depth analysis on the big picture, and to get access to my carefully curated list of “stocks to buy” now.
|