
July 22, 2019
Thanks to the strategy reset that took place five years ago, Microsoft is part of the duopoly in cloud computing. And that has led Microsoft to stand alone (at the moment) as the only trillion-dollar company in the world. By the end of the week, we will likely see them joined (again) by the other half of the cloud computing duopoly, Amazon.
When we think about the great "disrupters" of the past decade, and how the industries that they've disrupted will be left, when it has all shaken out, I think this MSFT/AMZN story is a good analog.
The giants of industry, if they move aggressively with the disrupters, have the distribution to compete, if not beat, the disrupters.
The Walmart/Amazon battle is another great example. The market has priced
Amazon like a runaway monopoly — killer of all industries, especially retail. And the perception has been that Walmart was destined to become another rise and fall story of a dominant American retailer. Sears, Toys R Us and about 70 other retailers have gone under in the last four years.But Walmart has been transforming.
So Walmart is positioned well to take advantage of the growth in the middle class in China. Amazon has yet to find its way in China. It has about 1% market share. Add to this, Google came in last year with a $550 million investment to help position JD to challenge Alibaba and Amazon on a global scale. Walmart is still about a third of the value of Amazon, but the gap has been closing (slowly).
Lastly, let's look at Netflix and the response underway at Disney. In recent years, Netflix has been thought to be taking over the entertainment industry with its disruptive direct-to-consumer model.
Fox responded early and aggressively (thanks the activist investor, Jeff Ubben). They made an aggressive move to build the direct-to-consumer model (taking stakes in Hulu, Star India and Sky). That set the company up as an acquisition target. And now with the Disney acquisition of Fox, Disney is positioned with a dominant duel threat — among the world's deepest and most valuable library of content and the distribution to take it to the consumer. This makes the world's preeminent entertainment company.
The result? Disney's valuation has leapfrogged Netflix. Disney now has a market cap of $250 billion. And Netflix has plunged $50 billion in value, to a market cap of $135 billion, since the Disney/Fox marriage last year.
If you haven't signed up for my Billionaire's Portfolio, join now — get your risk free access here.
|
July 19, 5:00 pm EST This week, earnings have been a nice distraction from the market’s Fed watching obsession. Second quarter earnings have gotten off to a good start with very strong earnings from the big banks. And those earnings have been driven by strong consumer business. Today we heard from Microsoft. The company grew earnings by 20% year-over-year, and with 12% revenue growth. We talked about MSFT earnings back in April, when Microsoft became the third trillion-dollar company. The first was Apple. And then Amazon. But despite the market sitting on new record highs, Microsoft now stands alone as the only trillion-dollar company. Let’s revisit the story from my April note, on how Microsoft has transformed itself from a path of obsolescence to quadrupling in value in just six years. The CEO, Satya Nadella, gets the credit, but it has everything to do with a guy named Jeff Ubben. Back in April of 2013, an activist investor named Jeff Ubben took a $2 billion stake in MSFT. That same month Business Insider wrote a story titled: “Microsoft Could Be Obsolete By 2017.” The stock had gone nowhere for more than a decade. Ubben won a board seat and he pushed for stock buybacks and a strategy reset. He pushed out the CEO, Steve Balmer. He replaced him with Satya Nadella, who was running the Miscrosoft cloud business. His job was to turn Miscrosoft into a cloud computing company. He has done it.
Microsoft is now the number two cloud computing platform globally, behind Amazon. For perspective, Bottom line: Amazon and Microsoft have a duopoly in the high growth digital storage business (i.e. cloud Amazon’s retail business gets all of the attention, but it’s cloud business has been subsidizing it’s retail business for a long time. The hyper-growth in cloud and the market dominance held by Amazon and Microsoft are why their market value has gone to a trillion-dollars, and why their charts look so similar …
|
 |
|
If you haven’t signed up for my Billionaire’s Portfolio, join now — get your risk free access here. |
|
July 18, 5:00 pm EST With 12 days until the July Fed decision, the Trump administration has attempted to dial DOWN expectations of a China trade deal coming anytime soon. And today the Fed marched out two Fed officials (one of which is the vice chair) ramping UP the rhetoric to telegraph rate cuts at the end of the month. After the Fed comments, the market swung from expectations of just a 25 basis point cut to a near 80% chance (at one point in the day) of a 50 basis point cut coming on July 31. That was good enough to drive a technical breakout in gold. Gold finishes the day just shy $1,450. That’s the highest level since mid-2013. Let’s take a look at the chart …. |
 |
|
So, we’re about 32% away from the 2011 highs. Those highs were, of course, induced by fears that QE would lead to runaway inflation. That is, the gold trade was a hedge against inflation. Inflation didn’t materialize. And the price of gold was nearly cut in half over the next few years. After all, following massive global QE, deflation remains the bigger risk. But now money is moving into gold as a hedge against global currency devaluations. In both scenarios, the gold trade is about hedging against inflating away global buying power. With the above in mind, remember we’ve discussed the prospects that this trade war with China may end with a grand and coordinated currency agreement— perhaps with a big depreciation of the dollar, similar to the 1980s “Plaza Accord.” If you haven’t signed up for my Billionaire’s Portfolio, join now — get your risk free access here. |
|
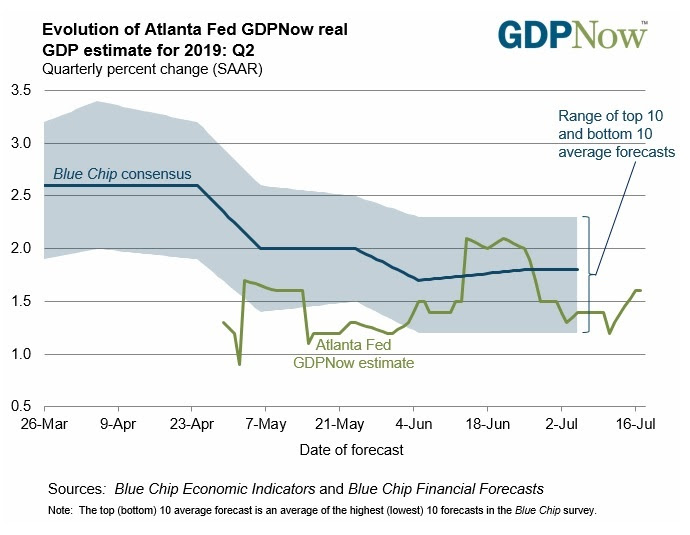
July 17, 5:00 pm EST With Bank of America earnings today, we’ve now heard from all of the big four banks (JPM, BAC, WFC and C). We’ve had positive earnings surprises in each, for an average earnings growth of 21% for the group. That’s 21% yoy earnings growth for the biggest banks in the country, in a quarter where the broader market is expected to shrink earnings by 3%. The positive surprises in bank earnings have been driven by the consumer business. And keep in mind, the consumer (personal consumption) makes up 70% of the U.S. economy. Perhaps Q2 will turn out better than the sub 2% growth expected by economists. The first reading on Q2 growth is due to be reported next Friday. Here’s what the Atlanta Fed model on GDP growth looks like, as we continue to get Q2 data incorporated, going into the first GDP reading … |
 |
|
Remember, back in April, the first look at Q1 GDP came in as a huge positive surprise (at 3.2%). Many were expecting it to be a terrible quarter. Goldman Sachs thought the quarter would produce just 0.7% growth. They were wrong, and they weren’t alone. At the end of the first quarter, the Atlanta Fed’s GDP model was estimating that the economy grew at only 0.3% in Q1.
If you haven’t signed up for my Billionaire’s Portfolio, join now — get your risk free access here.
|
July 16, 5:00 pm EST
Today we heard from two more of the “big four banks” on Q2 earnings.
Yesterday, Citi kicked it off with 11% earnings growth compared to the second quarter of last year. This morning, JP Morgan beat expectations, reporting 23% yoy earnings growth. Wells Fargo followed with an earnings beat, growing earnings by 32% yoy.
The banks continue to put up big numbers. And it’s, in large part, thanks to consumer banking. With record low unemployment, record high net worth and record high credit worthiness, the consumer business is strong.
Last year, one of the best value investors of the past twenty years, Jeff Ubben, said the U.S. banking system has the lowest risk profile “than any time in our investing lifetime.” A decade following the financial crisis, he thought the timing is finally right for major banks. He has been right.
With that in mind, if we look back at the sector weightings in the S&P 500, financials were the heaviest weighted sector in the years leading up to the financial crisis — at 22% of the index. The financials currently make up just 13% of the S&P 500. Meanwhile, the average P/E on the big four banks is just better than 10 – well below the long-term average on the broader market of 16. The banks are cheap (still).
July 15, 5:00 pm EST
Second quarter earnings kick into gear this week. It starts with the banks. Today we heard from the third largest bank in the country: Citigroup.
Let’s look at some key takeaways.
First, in Q1, the expectations were set for just 2% year-over-year earnings growth from the big banks. Instead, we had positive earnings surprises in each (Citi, Wells, JPM and Bank of America), for an average earnings growth of 11%. So, we had double-digit earnings
We’ll hear from JP Morgan and Wells Fargo tomorrow. And Bank of America will report on Wednesday.
What’s the best buy in the banks?
Citi is the cheapest of the four biggest U.S.-based global money center banks — still trading at a 30% discount to its peak market value (which was pre-financial crisis). Today it’s far better capitalized, better regulated and a more efficient business than it was in the pre-financial crisis days.
What about valuation? The average tangible book value of the big four banks is 1.4. Citi trades at just book value (i.e. 1x).
|
July 12, 5:00 pm EST Stocks will finish the week on new record highs, and up 20% for the year. With the catalysts lining up on a rate cut, and the potential for Trump to (then) pull the levers on trade and infrastructure, we have a path for a very big year in stocks. Remember, since December, we’ve talked about the comparisons between 1994-1995 and 2018-2019. The Fed was overly aggressive in raising rates back in the mid 90s, into a low inflation, recovering economy. In ’94, the fear that Fed policy would kill the recovery, led to a world where the best return on your money was in cash. Fast forward to 2018, the Fed also doubled interest rates in a short period of time and the fear set in that the Fed would kill the recovery. Cash, again, was the highest returning major asset class. By July of ’95 the Fed was forced to reverse course and cut rates. Stocks finished that year up 36%. Here we are, again, with a July rate cut coming to reverse the course on monetary policy. As we end the week, let’s take a look at broader market, style and asset class returns in ’95 compared to 2019, year-to-date. |
 |
|
If you haven’t signed up for my Billionaire’s Portfolio, join now — get your risk free access here. |
The markets have been obsessed with the Fed this week. Let’s talk about something else. How about earnings?
Second quarter earnings will kick into gear on Monday, starting with the big banks. And we are doing so with stocks on record highs, with the expectations of a rate cut coming down the pike for month end.
We’ll hear from Citi on Monday. JP Morgan and Wells Fargo report on Tuesday.
Remember, S&P 500 earnings grew by better than 20% in 2018, thanks to a corporate tax cut and the hottest economy of the past decade.
Then we had a sharp decline in stocks. That’s a shock to confidence. When confidence takes a hit, the expectations bar gets lowered. Before stocks unraveled in December, Wall Street was looking for 8.3% earnings growth for full year 2019. Now they are looking for just 2.6% growth for the year.
As I’ve said, never underestimate the
We saw it in Q1. The bar was low, and expectations were beat – both on earnings and economic growth. The stock market had the best first quarter in 20 years and Reuters called it the best first half for global financial markets ever.
As for Q2 earnings: The consensus view is for S&P 500 earnings to contract by 2.6%.
Interestingly, with three weeks until the Fed meeting, the softer the earnings season, the stronger the case is for a bigger rate cut. However, if we do indeed get positive surprises in the earnings, we still get a cut – so long as Trump continues to telegraph an indefinite trade war.
If you haven’t signed up for my Billionaire’s Portfolio, join now — get your risk free access here.
Jerome Powell was on Capitol Hill today, with another opportunity to set expectations on what the Fed may or may not do on July 31.
He didn’t disappoint. In the Fed Chair’s prepared remarks, he acknowledged that the “crosscurrents” (i.e. risks to the economic expansion) have reemerged (after moderating earlier in the year). That’s code for, we don’t know how long Trump is going to holdout on a trade deal, and we will give the markets (and Trump) what they are asking for: a rate cut at the month’s end.
The table was set in June for the Fed to cut rates. They held off, in anticipation of the big Trump/Xi meeting that took place at the end of June. A deal would have meant the Fed was off the hook – no rate cuts. As we know, they (Trump/Xi) kicked the can down the road. That reset the timeline on the trade war to indefinite.
And that sets the table for a response from the Fed.
In the absence of an indefinite trade war, are rates too tight in a 3% growth economy with unemployment under 4%. No.
But the Fed appears ready to capitulate in Trump’s game of chicken. The market is forcing its hand. With a 2% 10-year yield, the interest rate market is pricing in economic slowdown, deflationary pressures, aggressive monetary stimulus and maybe military war — all stemming from the perception of an indefinite trade war. Those signals are threats to business and consumer confidence, the linchpin of the economy.
Game of chicken? Remember, Trump
As we’ve discussed, with a rate cut under his belt, expect Trump to pull the trigger on ‘a’ deal, and then turn back to Congress to launch the next pillar in Trumponomics — a $2 trillion infrastructure spend. Who killed the infrastructure negotiations back in May? Trump. Who can turn it back on? Trump. Again, he creates fights where he can control the outcome.
If you haven’t signed up for my Billionaire’s Portfolio, join now — get your risk free access here.
|
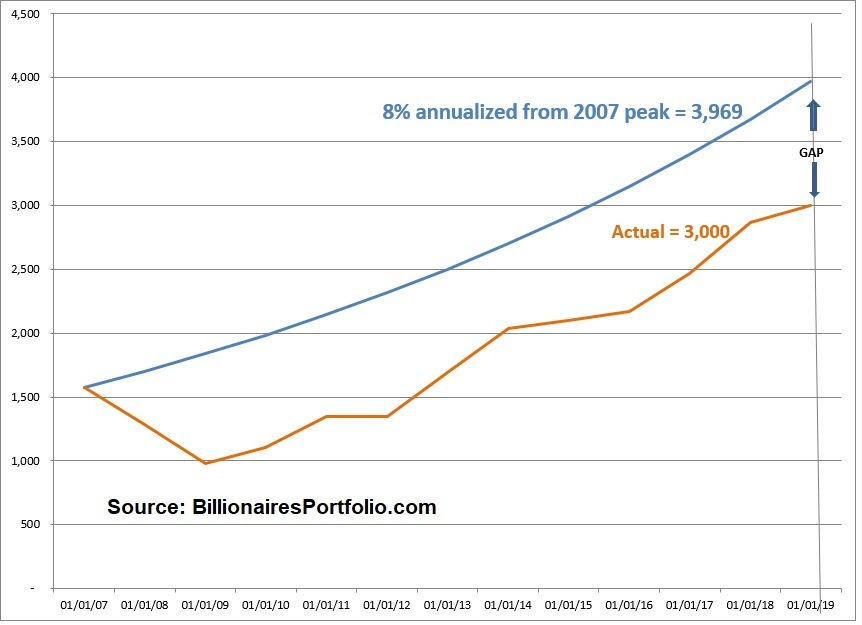
July 9, 5:00 pm EST As we are working through an important month for stocks and the economy, I want to revisit a chart I worked up early on in the financial crisis recovery (about seven years ago). We’ve looked at this chart quite a bit, but it’s been about a year since we’ve discussed it here in my daily Pro Perspectives note. In the chart below, the blue line represents what the S&P 500 would have looked like had it continued its long-run annualized growth rate of 8% from the 2007 (pre-crisis) peak. |
 |
|
This blue line gives us perspective on where we stand in this stock market recovery. Now, the orange line is the actual path of stocks (S&P 500). What’s the point? Even though we’re up more than four-fold from the 2009 bottom, and people continue to talk about how long this bull market has run, we still have not recovered the lost growth of the past decade. That is clearly displayed in the GAP between the orange line (the actual S&P 500) and the blue line (where stocks would be had we continued along the 8% annualized path). What can we attribute this gap to? Post-recession recoveries are typically driven by an aggressive bounce-back in growth. We didn’t get it. Instead, the post-recession growth environment of the past decade was dangerously shallow and slow. With that in mind, there is a similar gap in economic growth relative to trend. Historically, growth slowdowns are followed by big bounce-backs in growth, to return the the path of the economy to “trend growth.” We haven’t had it. |