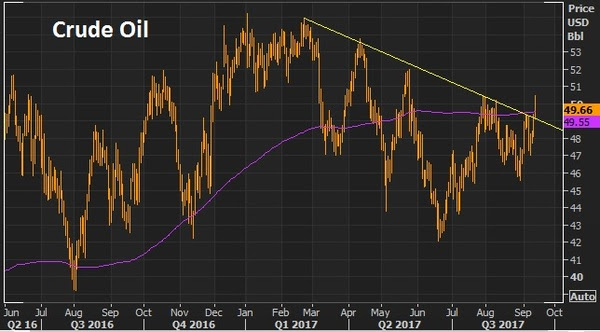
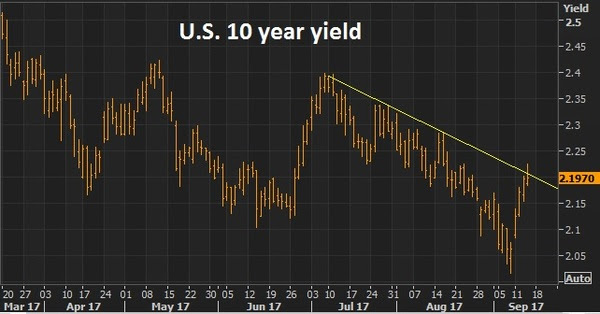
Yesterday we looked at the charts on oil and the U.S. 10 year yield. Both were looking poised to breakout of a technical downtrend. And both did so today.
Here’s an updated look at oil today.
And here’s a look at yields.
We talked yesterday about the improving prospects that we will get some policy execution on the Trumponomics front (i.e. fiscal stimulus), which would lift the economy and start driving some wage pressure and ultimately inflation (something unlimited global QE has been unable to do).
No surprise, the two most disconnected markets in recent months (oil and interest rates) have been the early movers in recent days, making up ground on the divergence that has developed with other asset classes.
Now, oil will be the big one to watch. Yields have a lot to do, right now, with where oil goes.
Though the central banks like to say they look at inflation excluding food and energy, they’re behavior doesn’t support it. Oil does indeed play a big role in the inflation outlook – because it plays a huge role in financial stability, the credit markets and the health of the banking system. Remember, in the oil price bust last year the Fed had to reverse course on its tightening plan and other major central banks coordinated to come to the rescue with easing measures to fend off the threat of cheap oil (which was quickly creating risk of another financial crisis as an entire shale industry was lining up for defaults, as were oil producing countries with heavy oil dependencies).
So, if oil can sustain above the $50 level, watch for the inflation chatter to begin picking up. And the rate hike chatter to begin picking up (not just with the Fed, but with the BOE and ECB). Higher oil prices will only increase this divergence in the chart below, making the interest rate market a strong candidate for a big move.
Join our Billionaire’s Portfolio today to get your portfolio in line with the most influential investors in the world, and hear more of my actionable political, economic and market analysis. Click here to learn more.
Remember when China devalued the yuan back in August of last year? The world went into a frenzied panic. Was China going to do a massive one-off devaluation? That was the fear that quickly triggered selling across global stock markets and bids in safe-havens (like bonds and gold).
Like the Brexit, not many could tell you why they were afraid of a yuan devaluation. In fact, most didn’t even know that it was a relatively minor adjustment (that day), and that the devaluation of the yuan had already been underway since early 2014.
For some context, it’s important to understand that China had been, since 2005, slowly allowing their currency (the yuan) to appreciate — mainly versus the dollar.
It was China’s weak currency policy (i.e. manipulation) that was a large contributor to the credit bubble and burst, and the mass global capital and trade imbalances that remain as a major structural flaw in the global economy that feeds cycles of credit booms and busts.
The currency was their tool to corner the world’s export market — to be the exporter to the world. They did it very successfully, and with little pushback for more than a decade. And they ascended to one of the largest economies in the world in the process, stockpiling the world’s largest currency reserves.
With that, back in 2005, the leading economies in the world, led by the U.S., finally began threatening China with draconian tariffs IF they didn’t abandon their unfair currency policies.
It was at that point that China finally made a concession, to ward off the political and economic backlash. They agreed to slowly allow the yuan to appreciate by abandoning their peg to the dollar, and creating a trading band around (primarily) the dollar.
In the chart below, you can see the peg (the straight line on the left side of the chart). And you can see the policy change – the declining line represents the dollar falling in value vs. the Chinese yuan.
Source: Billionaire’s Portfolio, Reuters
Who determines where the yuan trades in that band? China. So for 10 years, China allowed its currency to climb by only a meager 3% a year against the dollar. That was enough to keep all of the protectionist threats at bay. Meanwhile, their economy was growing at a double digit pace on average – which was a net big win, and that kept their global market share grab growing. Even in the early stages of the global economic crisis, people thought China could take the torch and carry on with breakneck economic growth (Wall Street was telling us to pour our money into China and other emerging markets). But soon China was exposed as heavily reliant on a healthy developed market world. A healthy global consumer and a weak currency happened to be the magic formula after all. And they’ve since been growing at about half the rate they were in the mid 2000s, which feels like recession, if not depression, in the Chinese economy.
Here’s a look at Chinese GDP growth …
Source: Billionaire’s Portfolio, Reuters
So now, with the Chinese economy in a rut, the Chinese have tried a variety of monetary and fiscal stimulus measures but none have reversed the decline in growth. Chinese growth at these levels is a real threat to
social stability – something the government is always very mindful of.
With that, enter the reversal of the yuan appreciation program of the past decade. As of today, the yuan is 10% cheaper against the dollar than it was in early 2014. Now, this path has been widely viewed as a signal of potential danger, raising such questions like: 1) Are things worse than we think in China? Or 2) Will this provoke more protectionist actions from Chinese trading partners and geopolitical tensions?
But it could actually be quite positive for the global economy, at least near term. If China devalues in a slow and orderly way, and it gets their economy going, it could be a much needed spark plug for global growth. If so, maybe it’s time to finally buy Chinese stocks. You can see in the chart below, a weaker yuan tends to mean higher stocks in China.
Source: Billionaire’s Portfolio, Reuters What Stocks Should You Buy? Follow The Lead Of Great Investors Like Warren Buffett In Our Billionaire’s Portfolio
In our Billionaire’s Portfolio, we’re positioned in deep value stocks that have the potential to do multiples of the broader market — all stocks that are owned and influenced by the world’s smartest and most powerful billionaire investors – which includes a high growth Chinese technology stock that is heavily owned by two top billionaire tech investors. Join us today and get yourself in line with our portfolio. Join us today, RISK-FREE, at BillionairesPortfolio.com.
The Brexit unknowns continue to dominate the market focus today. But by Friday, believe it or not, it may move down the list on the daily market narratives. We get the jobs numbers this Friday.
Last month’s payroll number was a big negative surprise, coming in at just 38k new jobs created. But the longer term average has been closer to 200k new jobs a month (fairly healthy). That’s closer to where the number is expected to come in this week.
For the Fed, the negative surprise last month took a June rate hike off of the table. And then came the Brexit. Now rate hike expectations have been moved out as far as 2018 in the minds of market participants – and the market has even begun pricing in slim chances of a cut.
With that, global rates have continued to slide to new record lows, including the U.S. 10-year yield. The 10-year traded as low as 1.35% today. That’s lower than the darkest days of the global financial crisis (much lower), and the darkest days of the European Debt Crisis.
So, the last time we were down here, what turned it? It was intervention – or at least the threat of intervention. It was the ECB stepping in and saying they would do “whatever it takes” to save the euro.
Despite all of the criticisms surrounding policymakers meddling in markets, intervention (in one shape or form) has determined many historic turning points in markets – something to keep in mind.
Still, the betting market on the timing of Fed hikes has been a wild swing of extremes for years now. And the current bet of just a 13% chance of a hike this year looks like a heck of an opportunity to be on the other side.
Keep in mind, there was a lot of damage to investor psychology in the early days of this decade-long economic downturn. That has created a contingent of investors that have feared another shoe to drop, hence the extremes.
That fear has also led to under participation in stocks, and it also leads to weak hands in the stock market. The “weak hands” are those that may own stocks, but have little conviction (and likely a lot of fear). This dynamic has created these episodes of market swings.
But U.S. stocks still remain not far from record highs. And as we said last week, there also remains an incredible number of stocks that trade at cheap valuations (amazingly). But when stocks go on sale, most choose to run for the exits rather than take advantage of the opportunity. And it’s common, in those scenarios, to find the best investors in the world taking the other side of the trade from the masses.
Warren Buffett has famously said a simple rule dictates his buying: “Be fearful when others are greedy, and be greedy when others are fearful.” He’s amassed one of the biggest fortunes in the world, largely on that philosophy – being the right place at the right time and acting.
With the above in mind, it’s no surprise that over the past few trading days, the 13D filings have been coming in fast and furious. A 13D filing is a public disclosure made to the SEC by investors managing $100 million or more. If these investors buy or build a stake in a public company that exceeds 5%, they are required to disclose it to the SEC within 10 days. These stakes generally give the investor a controlling interest in the company, and the shares are acquired with the intent of waging some influence on the company’s management. With that said, some of the best have been snapping up shares in new companies in recent weeks and/or adding to existing stakes on a dip.
What Stocks Should You Buy? Follow The Lead Of Great Investors Like Warren Buffett In Our Billionaire’s Portfolio
In our Billionaire’s Portfolio, we’re positioned in deep value stocks that have the potential to do multiples of the broader market — all stocks that are owned and influenced by the world’s smartest and most powerful billionaire investors. Join us today and get yourself in line with our portfolio. Join us today, RISK-FREE, at BillionairesPortfolio.com.
Yesterday we wrapped up the first half of 2016. Today we want to step back and take a look at how markets fared in the face of a lot of threats, if not chaos.
Even after Brexit, an early year correction surrounding the oil price bust, and an indecisive Fed, U.S stocks are UP for the year!
The old adage that stocks climb a wall of worry during a bull market continues to hold true.
The S&P 500 ended the first half of 2016 up 2.7%, while the blue chip Dow Jones Industrials Average rose 2.9%. The tech-growth heavy Nasdaq was the worst performer ending the first half of 2016 down 3.3%.
This tells us a couple of things: first the world is not falling apart (contrary to what most people think). In fact, U.S stocks are putting up nearly a 6% annualized return for the year (just shy of the S&P 500’s historical average — better than the long term average on an inflation adjusted basis).
Most interesting, value stocks are significantly outperforming growth stocks – for the first time in a long time. The Russell 1000 value index is up 6.1% for the first half of 2016 vs a 1.3% loss for the Russell 1000 growth index. So value stocks are outperforming growth stocks by more than 7 percentage points this year or around 14% on an annualized basis. Never have we seen more blue chip stocks trading at incredible, beaten down values – 7% of the S&P 500 is trading below book value.
Remember, in the past few months, we’ve talked about the similarities in stocks to 2010. Through the first half of this year, we’ve had the macro clouds of China and an oil price bust that shook market and economic confidence. Back in 2010, it was Greece and a massive oil spill in the Gulf of Mexico. When the macro clouds lifted in 2010, the Russell 2000 went on a tear from down 7% to finish up 27% for the year. This time around, the Russell has already bounced back from down 17% to up 2%.
With economic expectations in the gutter, global rates at record lows, and central banks continuing to ease and buffer potential shocks to the system, the opportunities for positive economic surprises have never been greater. We think positive economic surprises in the next half can be the catalyst for a surprisingly big second half for stocks.
What Stocks Should You Buy? Follow The Lead Of Great Investors Like Warren Buffett In Our Billionaire’s Portfolio
In our Billionaire’s Portfolio, we’re positioned in deep value stocks that have the potential to do multiples of the broader market — all stocks that are owned and influenced by the world’s smartest and most powerful billionaire investors. Join us today and get yourself in line with our portfolio. Join us today, RISK-FREE, at BillionairesPortfolio.com.
Yesterday we looked at some key markets, some that have recovered nicely following the Brexit news, and others that are still down on either safe-haven demand or speculation of economic drags due to the Brexit. One particular spot that hasn’t fared well in the past week is Japan.
Japan is three years into a bold plan to beat two decades of deflation and restore its economy to prominence. The data shows that their efforts haven’t translated so well just yet. Inflation is still dead, and economic growth — about the same.
Two key tools in the Bank of Japan’s QE program, which is designed to drive inflation and economic activity, is a weaker yen and a higher stock market. Since they telegraphed their intentions of big, bold QE in late 2012, Japanese stocks have risen by as much as 140%. And the yen has declined by as much as 38% against the dollar. But over the past 12 months, about half of those “policy gains” have been given back. And post-Brexit the attrition has only worsened.
Still, after three years and big moves in the yen and stocks, the inflation objective remains a distant target. What does it mean? The Bank of Japan has to do more. A lot more.
We think they can, and will, ultimately destroy the value of the yen — mass devaluation.
Unlike the U.S., which is constrained by “flight to safety” global capital flows and a world reserve currency, Japan has the ingredients to make QE work, to promote demand, and to promote growth. Japan has the largest government debt problem in the world. They have an undervalued currency. They have a stagnating economy with big demographic challenges. They have are in a deflationary vortex.
They have the perfect attributes for a mass scale currency printing campaign. Not only can it work for their domestic economies, but it serves as the liquidity engine and stability preserver for the global economy.
In normal times, the rest of the world wouldn’t stand for a country outright devaluing their way to prosperity. But in a world where every country is in economic malaise, everyone can benefit – everyone needs it to work. It can be the solution for returning the global economy to sustainable growth. We wouldn’t be surprised to see USDJPY return to the levels of the mid-80s (versus the dollar)in the not too distant future. That would be 250+. Currently, 103 yen buys a dollar.
To follow our big picture views and our hand selected portfolio of the best stocks owned by the best billionaire investors in the world, join us in our Billionaire’s Portfolio.
Yesterday we talked about the ECB’s projection on how the Brexit will impact on euro area GDP. And we looked at charts of Spanish and Italian sovereign debt. Both suggested that the market reaction, to the downside risk from Brexit, might be over-exaggerated.
Some markets have already fully recovered the Brexit-induced declines. But some key safe-haven assets continue to show healthy capital flows.
Let’s look at some charts.
Source: Reuters, Billionaire’s Portfolio
The chart above is a look at UK stocks. These are blue chip companies listed on the London Stock Exchange. You can see the 9% has been completely erased in just three trading days.
What about commodities? This is Goldman’s commodity index. It’s completed recovered declines, in large part to the reversal in oil and the continued surge in natural gas. Remember we talked about natural gas earlier in the month as it looks like it’s on a path to $4. It nearly hit $3 today.
Source: Reuters, Billionaire’s Portfolio
So we have some traditional “risk-on” assets sharply recovering losses.
But, the “risk-off” trade continues to hold in the traditional safe-haven assets. Bonds are being bought aggressively. You can see the U.S. 10-year yield is nearing levels of the peak of the European Debt Crisis, when Spain and Italy were on the precipice of blow-up.
Source: Reuters, Billionaire’s Portfolio
Interestingly, the 30-year yield is sliding too. This flattens the yield curve, which suggests bets on recession. But this extreme level is historically has been a bottom throughout the crisis period (2008-present).
Source: Reuters, Billionaire’s Portfolio
The dollar continues to hold post-Brexit gains — another sign of safe-haven flows.
Source: Reuters, Billionaire’s Portfolio
And next, the safe-haven flows continue to hold up in gold. But it’s not the runaway market gold bugs would hope for in a time of global stress.
Source: Reuters, Billionaire’s Portfolio
One could argue that the safe haven flows could be coming from core Europe, as Germany is most at risk in the Brexit for the ultimate bad outcome scenario (as we discussed yesterday, where the Brexit could create a spill over into European Monetary Union countries looking for the exit door). But as we reviewed yesterday, the sovereign debt markets in the vulnerable spots in Europe (Italy and Spain) aren’t giving that “bad outcome” signal.
Source: Reuters, Billionaire’s Portfolio
What about Japan? Japanese stocks have bounced sharply, but were among the worst hit given the sharp rise in the yen (a traditional safe-haven).
Source: Reuters, Billionaire’s Portfolio
And finally, U.S. stocks have come back aggressively, but haven’t fully recovered the decline.
Source: Reuters, Billionaire’s Portfolio
What do we make of it? If we consider that the biggest risk associated with Brexit is a destruction of global confidence, rising/recovering stocks go a long way toward defending against that risk. Since the central banks are in the business of defending stability and confidence in this environment, and they are clearly on patrol, they may have a little something to do with stock market recoveries (if not directly, than indirectly).
To follow our big picture views and our hand selected portfolio of the best stocks owned by the best billionaire investors in the world, join us in our Billionaire’s Portfolio.
We’ve talked about the Brexit effect the past couple of days. And we’ll continue on that theme today, as people continue to digest the results and come to grips with potential outcomes.
The knee-jerk reaction in markets has suggested that there is considerable fear of another global financial crisis. But as we’ve said, things today are very different than they were in 2008. The failure of Lehman triggered a global credit freeze. That brought global banks to their knees and, therefore, even massive Fortune 500 companies couldn’t access capital needed to operate.
Again, this time is different (typically dangerous words to say, but true). The financial system remains well functioning. Most importantly, central banks are pro-actively maintaining stability and confidence by offering liquidity to banks and have made it well known that they stand ready to act where ever else needed (i.e. intervention).
So now we’re seeing some projections of the economic implications of the Brexit coming in. The ECB thinks it will shave “as much as” ½ percentage point in GDP growth in Europe.
Here’s a look at euro area GDP…
Source: Tradingeconomics.com
You can see the damage to the economy in the global financial crisis. While Europe is still emerging from stagnation, lopping off ½ percentage point is far from a “Lehman moment.” Plus, if the euro weakens, as it should, on the outlook, that economic hit will be softened dramatically. When we think about the broad Brexit implications, Europe is probably the first place everyone should be looking, and the ECB’s projection doesn’t look so bad at all. With that, the market volatility we’re seeing seems to be over-exaggerating the Brexit effect.
Still, the biggest risk associated with the Brexit is that it becomes contagious. As we said on Friday, the potential Grexit (of last year) and the Brexit are most different for one simple reason. The British vote doesn’t involve a country leaving the common currency — the euro.
The British, of course, have their own currency, and among all of the EU countries, the British have probably retained the most sovereignty. It’s a fracturing of the euro, the second most widely held currency in the world, that would trigger a global financial and economic crisis. That’s the big danger. If other EU countries that are also part of the common currency (the monetary union – the EMU) took the lead of Britain, then it gets very ugly.
Perhaps the first place to look for that potential spillover, is in the sovereign debt markets of Spain and Italy — the two big EMU constituents that were close to default four years ago. When those countries were on the brink of collapse in 2012, the 10-year government bond yields were trading north of 7% (unsustainable levels).
Source: Reuters, Billionaire’s Portfolio
Source: Reuters, Billionaire’s Portfolio
Today, Spanish and Italian 10-year debt is yielding just 1.3%. In a post-Brexit world, where the real risk is contagion, both of these important market barometers are indicating no contagion danger.
To follow our big picture views and our hand selected portfolio of the best stocks owned by the best billionaire investors in the world, join us in our Billionaire’s Portfolio.
Over the past two trading days, we’re seeing the “risk-off” flow of global capital that we saw through the early stages of the global financial crisis.
For a long time, Wall Street sold us on the idea of sector and geographic diversification for stocks. That abruptly ended in 2008-2009. It was clear that in a global crisis, the correlations of sectors, geographies and many asset classes went to 1 (i.e. almost everything went down–a few things went up).
Our table below gives some perspective on how the swings in global risk appetite have affected financial markets since the onset of the financial crisis in 2008.
In a sense, the risk trade is an easy one to understand. When the world looks like a scary place, people pull back and look for protection. They pull money out of virtually everything, including banks, and plow money into the U.S. dollar, U.S. Treasurys and gold (the safest parking place for money in the world, on a relative basis).
At the depths of the global financial and economic crisis, there was a clear shift in investor focus, away from “return ON capital” toward one of “return OF capital.” Then, as sentiment improved about the outlook, people started taking on more risk, and that capital flow reversed. But with each economic threat that has bubbled up since, we’ve seen this risk-off dynamic quickly emerge again.
Two trading days following the Brexit vote, the market behavior is clearly back in the risk-off phase. The question is: Are we back into the risk-on/risk-off seesaw in markets that we dealt with for several years coming out of the worst part of the crisis?
As we said, there are huge differences between now and 2008. When Lehman failed, global credit froze. Today financial conditions globally have tightened a bit, but nothing remotely near the post-Lehman fallout. Most importantly, as we’ve said, we had no idea how policy makers might respond and how far they might go. Now we know, they will “do whatever it takes.”
When was the last time we had a huge sentiment shock for global financial markets and for the global economy? It was only a year ago, in Greece. The Greek people voted NO against more austerity and more loss of sovereignty to their European neighbors (namely Germany). That vote too, shocked the world. But all of the draconian outcomes for Greece, which were being threatened, with such a vote, didn’t transpire. Greece and Europe compromised.
Bottom line (and something to keep in mind): A bad outcome for anyone, at this stage in the global economic recovery, is a bad outcome for everyone.
To follow our big picture views and our hand selected portfolio of the best stocks owned by the best billionaire investors in the world, join us in our Billionaire’s Portfolio.
As we said yesterday, we’ve seen a slew of threatening events come and go over the course of the past seven years, and with each passing of those events, the heightened scrutiny of the economy comes and recession predictions. Each has been wrong. The Brexit vote is just the latest.
With the UK referendum results looming (as of this writing), today we want to revisit some of our bigger picture perspective on the U.S. economy. The data just doesn’t support the gloom and doom scenarios.
The Fed has manufactured a recovery by promoting stability. And they’ve relied on two key asset prices to do it: stocks and housing. Today we want to look at a few charts that show how important the stock and housing market recoveries have been.
While QE and the Fed’s ultra easy policy stance couldn’t directly create demand in a world of deleveraging, it did (and has) indirectly created demand by promoting stability, which restored confidence. Without the confidence that the world will be stable, people don’t spend, borrow, lend or hire, and the economy goes into a deflationary vortex.
But by promising that they stand ready to act against any futures shocks to the economy (and financial markets), investors feel comfortable investing again (stocks go higher). When stocks go higher and the environment proves stable, employers feel more confident to hire. This all fuels demand and recovery. And, of course, the Fed has pinned down mortgage rates at record lows, which promotes a housing recovery, and gives underwater homeowners (at one point, more than 25 million of them) a since that paper losses will at some point be overcome, and that gives them the confidence to spend money again, rather sit on it.
Along the path of the economic recovery, the Fed (and other key central banks) has been very sensitive to declines in stocks. Why? Because declining stocks has the ability to undo what they’ve done. And it confidence breaks again, it will be far harder to restore it.
The first chart here is the S&P 500. Stocks bottomed in March of 2009, when the Fed announced a $1 trillion QE program.
Sources: Reuters, Billionaire’s Portfolio
Stocks surpassed the pre-crisis highs in 2013 after six years in the hole. But even after the dramatic rise you can see in the chart the damage from the crisis is far from restored. If we applied the long term annual rate of growth of the S&P 500 (8%) to the pre-crisis highs of 1,576, the S&P 500 should be closer to 3,150.
How does housing look? Of course, bursting of the housing bubble was the pin that pricked the global credit bubble. Housing prices in the U.S. have been in recovery mode since 2012. Still, housing has a ways to go. This is a very important component for the Fed, for sustainable recovery.
Sources: Reuters, Billionaire’s Portfolio
Housing prices have bounced 37% off of the lows (for 20 major cities in the index) – but remains about 10% off of the pre-crisis highs.
How has the recovery in stocks and housing reflected in the broader economy?
As stocks surpassed pre-crisis highs in 2013, so did U.S. per capita GDP.
Sources: Reuters, Billionaire’s Portfolio
While debt continues to be a big structural problem for the U.S and the rest of the world, growth goes a long way toward fixing that problem.
And growth, low interest rates, higher stocks and higher housing prices goes a long way toward restoring household net worth. As you can see in the chart below, we have well recovered and surpassed pre-crisis levels in household net worth…
Sources: Reuters, Billionaire’s Portfolio
What is the key long-term driver of economic growth overtime? Credit creation. In the next chart, you can see the sharp recovery in consumer credit since the depths of the economic crisis (in orange). This excludes mortgages. And you can see how closely GDP (economic output) tracks credit growth (the purple line).
Sources: Reuters, Billionaire’s Portfolio
What about deleveraging? It took 10 years to build the global credit bubble that erupted in 2007. Based on historical credit bubbles, it typically takes about as long to de-lever. So 10-years of deleveraging would put us at year 2017.
You can see in the chart below, the average annual growth rate of consumer credit over the past 55 years is 7.9%. Over the past five years, consumer credit growth has been solid, just under the long term average. Meanwhile, FICO scores in the U.S. have reached an all-time high.
Sources: Reuters, Fed
With any volatility in stocks, there comes increased scrutiny on the economy and people like to wave the red flag anywhere they find soft economic data. But consumption makes up more than 2/3 of the U.S. economy. And you can see from the charts above, the consumer is in a solid position. Still, stocks and housing remain key drivers of the recovery. The Fed is well aware of that. With that, don’t expect the Fed, in the current economic environment, to do anything to alter the health of the housing and stock markets.
Have a great night.
To follow our big picture views and our hand selected portfolio of the best stocks owned by the best billionaire investors in the world, join us in our Billionaire’s Portfolio.
Tomorrow is the UK vote, where UK citizens will vote on whether to ‘stay’ or to ‘leave’ the European Union. In this post-Lehman (failure) era, we’ve had no shortage of fear and doubt. Remember the Fiscal Cliff, Sequestration, Cyprus, several chapters of the drama in Greece, Italy and Spain were threatening default, China’s slowdown – the list could go on.
Along the way, the message in the media has always had little substance, but one very common word to promote and validate fear: the word, “uncertainty.”
But throughout this entire post-Lehman era, the world has been a very uncertain place. Whether times have been relatively good or not so good, given the state of the world seven years ago, and given the unprecedented policies it has taken to get us here, uncertainty is the new normal. But what is certain, following the near apocalypse of the global economy, is how policy makers will respond. We know, without a question, they will do ‘whatever it takes’ — their own words. And they’ve proven that their actions can avert disasters and promote confidence and recovery.
With all of this in mind, let’s dig in a little bit and talk about the UK vote.
First, to be clear, there are a lot of comparisons made to the Greek vote last year (the “Grexit”). The UK vote (the “Brexit”) is very different.
The notion of Grexit threatened the existence of the second most widely held currency in the world, the euro. That was a much, much bigger deal. The UK, of course, is part of the European Union, but not part of the currency union. They did not adopt the euro. They have their own currency and their own monetary policy. The UK vote is about trade, immigration, ability to work and live in other EU countries — perhaps mostly about control and politics.
The polls have been broadly building the story for an exit, though they are also broadly deemed unreliable. Meanwhile the bookmakers have had the chances of an exit, along much of the way, as slim (at about 70/30 favoring the ‘stay’ camp). Still, at the peak of the frenzy last week, that number had narrowed to 56/44 favoring ‘stay.’ But when the pendulum of sentiment swung, so did the bookmakers odds of a ‘leave’ vote winning. They are putting the chances of an exit at just 25% as we head into tomorrow’s vote.
As we said, we’ve seen a number of events over the course of the past several years that have introduced fear and doubt into the minds of investors (and especially the media). Something to keep in mind: Any and all of the dips in markets associated with those flare-ups have proven to be extremely valuable buying opportunities. As we noted yesterday, some of the best spots to buy the dip this time around will likely be German and Japanese stocks.
Have a great night.
To follow our big picture views and our hand selected portfolio of the best stocks owned by the best billionaire investors in the world, join us in our Billionaire’s Portfolio.