We’ve past yet another hurdle of concern for markets this past week. Last Friday this time, we had a potential catastrophic category 5 hurricane projected to decimate Florida.
Though there was plenty of destruction in Irma’s path, the weakening of the storm through the weekend ended in a positive surprise relative what could have been.
So we end with stocks on highs. And remember, we’ve talked over past month about the quiet move in copper (and other base metals) as a signal that the global economy (and especially China) might be stronger than people think. Reuters has a piece today where they overlay a chart of economist Ed Yardeni’s “boom-bust barometer” over the S&P 500. It looks like the same chart.
What does that mean? The boom-bust barometer measures the strength of industrial commodities relative to jobless claims. Higher commodities prices and lower unemployment claims equals a rising index as you might suspect (i.e. suggesting economic boom conditions, not bust). And that represents the solid fundamental back drop that is supporting stocks.
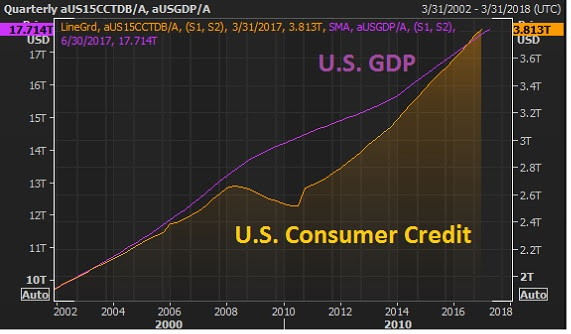
With that in mind, consider this: In the recent earnings quarter, earnings and revenue growth came in as good as we’ve seen in a long time for S&P 500 companies. We have 4.4% unemployment. The rise in equities and real estate have driven household net worth to $94 trillion – new record highs and well passed the pre-crisis peaks (chart below).
Now, people love to worry about debt levels. It’s always an eye-catching headline.
But what happens to be the key long-term driver of economic growth over time? Credit creation (debt). The good news: The appetite for borrowing is back. And you can see how closely GDP (the purple line, economic output) tracks credit growth.
Meanwhile, and importantly, consumers have never been so credit worthy. FICO scores in the U.S. have reached all-time highs. So despite what the media and some of Wall Street are telling us, things look pretty darn good. Low interests have produced recovery, without a ramp up in inflation.
But as I’ve said, it has proven to have its limits. We need fiscal stimulus to get us over the hump – on track for a sustainable recovery. And we now have, over the past two weeks, improving prospects that we will see fiscal stimulus materialize — i.e. policy execution in Washington.
To sum up: People continue to look for what could bust the economy from here, and are missing out on what looks like the early stages of a boom.
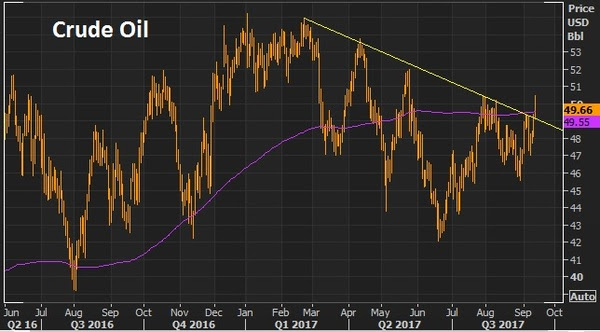
Yesterday we looked at the charts on oil and the U.S. 10 year yield. Both were looking poised to breakout of a technical downtrend. And both did so today.
Here’s an updated look at oil today.
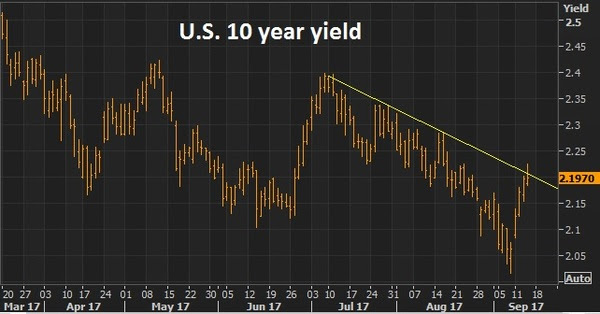
And here’s a look at yields.
We talked yesterday about the improving prospects that we will get some policy execution on the Trumponomics front (i.e. fiscal stimulus), which would lift the economy and start driving some wage pressure and ultimately inflation (something unlimited global QE has been unable to do).
No surprise, the two most disconnected markets in recent months (oil and interest rates) have been the early movers in recent days, making up ground on the divergence that has developed with other asset classes.
Now, oil will be the big one to watch. Yields have a lot to do, right now, with where oil goes.
Though the central banks like to say they look at inflation excluding food and energy, they’re behavior doesn’t support it. Oil does indeed play a big role in the inflation outlook – because it plays a huge role in financial stability, the credit markets and the health of the banking system. Remember, in the oil price bust last year the Fed had to reverse course on its tightening plan and other major central banks coordinated to come to the rescue with easing measures to fend off the threat of cheap oil (which was quickly creating risk of another financial crisis as an entire shale industry was lining up for defaults, as were oil producing countries with heavy oil dependencies).
So, if oil can sustain above the $50 level, watch for the inflation chatter to begin picking up. And the rate hike chatter to begin picking up (not just with the Fed, but with the BOE and ECB). Higher oil prices will only increase this divergence in the chart below, making the interest rate market a strong candidate for a big move.
Join our Billionaire’s Portfolio today to get your portfolio in line with the most influential investors in the world, and hear more of my actionable political, economic and market analysis. Click here to learn more.
Last week we discussed the building support for a next leg higher in commodities prices. China is clearly a very important determinant in where commodities go. And with the news last week about cooperation between the Trump team and China, on trade, we may have the catalyst to get commodities moving higher again.It just so happens that oil (the most traded commodity in the world) is rebounding too, on the catalyst of prospects of an OPEC extension to the production cuts they announced last November.In fact, overnight, Saudi Arabia and Russia said they would do “whatever it takes” to cut supply (i.e. whatever it takes to get oil prices higher). Oil was up big today on that news.When you hear these words spoken from policy-makers (those that can dictate outcomes), it should get everyone’s attention. Those are the exact words uttered by ECB head Mario Draghi, that ended the bond market assault in Spain and Italy that were threatening the existence of the euro and euro zone. The Spanish 10-year yield collapsed from 7.8% (unsustainable borrowing rate for the Spanish government, and threatening imminent default) to 1% over the next three years — and the ECB, while threatening to buy an unlimited amount of bonds to push those yields lower, didn’t have to buy a single bond. It was the mere threat of ‘whatever it takes’ that did the trick.
As for oil: From the depths of the oil price crash last year, remember, we discussed the prospects for a huge bounce. Oil prices at $26 were threatening to undo the trillions of dollars of work central banks and governments had done to stabilize the global economy. Central banks couldn’t let it happen. After a series of coordinated responses (from the BOJ, China, ECB and the Fed), oil bottomed and quickly doubled.
Also at that time, two of the best oil traders in the world were calling the bottom and calling for $70-$80 oil by this year (Pierre Andurand and Andy Hall). Another commodities king that called the bottom: Leigh Goehring.
Goehring, one of the best commodities investors on the planet, has also laid out the case for $100 oil by next year. He says he’s “wildly bullish” oil in his recent quarterly investor letter at his new fund, Goehring & Rozencwajg.
Goehring argues that the IEA inventory numbers are flawed. He thinks oil the market is already over-supplied and is in a draw, as of May of last year. With that, he thinks the OPEC cuts will ultimately exacerbate the deficit and send prices aggressively higher. He says “we remain ‘wildly’ bullish and believe that there is a very high probability of oil prices reaching triple digits in the first half of 2018.”
Follow This Billionaire To A 172% WinnerIn our Billionaire’s Portfolio, we have a stock in our portfolio that is controlled by one of the top billion dollar activist hedge funds on the planet. The hedge fund manager has a board seat and has publicly stated that this stock is worth 172% higher than where it trades today. And this is an S&P 500 stock!Even better, the company has been constantly rumored to be a takeover candidate. We think an acquisition could happen soon as the billionaire investor who runs this activist hedge fund has purchased almost $157 million worth of this stock over the past year at levels just above where the stock is trading now.So we have a billionaire hedge fund manager, who is on the board of a company that has been rumored to be a takeover candidate, who has adding aggressively over the past year, on a dip.
With today marking eight years from the bottom in the stock market, let’s talk about why it bottomed. And then take look at the run up in stocks since 2008.
First, why did stocks (the S&P 500) turn at 666 on March 9th, 2009?
Policymakers were scrambling to stop the bleeding in banks, trying to unfreeze global credit, and stop the dominos from continuing to fall.
The Fed had already launched a program a few months earlier to buy up mortgage back securities, to push down mortgage rates and stop the implosion in housing. Global central banks had already slashed interest rates in attempt to stimulate the economy. The U.S. had announced a $787 fiscal stimulus package a few weeks earlier. And then finance ministers and central bankers from the top 20 countries in the world met in London on March 14.
Here’s what they said in the opening of their communique: “We have taken decisive, coordinated and comprehensive action to boost demand and jobs, and are prepared to take whatever action is necessary until growth is restored.”
The key words here are “coordinated” and “whatever action is necessary.”
The Fed met four days later and rolled out bigger purchases of mortgages, and for the first time announced they would be buying government debt. This was full bore QE. And it was with the full support of global counterparts, which later followed that lead.
What wasn’t known to that point, was to what extent policymakers were willing to intervene to avert disaster. This statement by G20 finance heads and the action by the Fed let it be known that all options are on the table (devaluation, monetization, etc) — and they were all-in and all together in the fight to stave off an apocalypse. With that, the asset reflation period started. And it started with QE.
With that said, let’s take a look at the chart on stocks and the impact QE has had along the way.
The baton has now been passed to fiscal stimulus in the U.S. But we have the benefit of QE still full bore in Europe and Japan. The question is, can that continue to anchor interest rates in the U.S. and keep that variable from stifling the impact of growth policies.
In our Billionaire’s Portfolio, we’re positioned in a portfolio of deep value stocks that all have the potential to do multiples of what broader stocks do — all stocks owned and influenced by the world’s smartest and most powerful billionaire investors. Join us today and we’ll send you our recently recorded portfolio review that steps through every stock in our portfolio, and the opportunities in each.
Stocks were down a bit today, for the first day in the past six days. Yields were lower, following two days of Janet Yellen on Capitol Hill. Gold was higher on the day. And the dollar was lower.
Of the market action of the day, the dollar and yields are the most interesting. The freshly confirmed Treasury Secretary, Steven Mnuchin, held a call with Japan’s Finance Minister last night, early morning Japan time.
What did USD/JPY do? It went down (lower dollar, stronger yen). Just as it did the week leading up to the visit between President Trump and Japan’s Prime Minister Abe.
Remember, the yen has been pulled into the fray on Trump’s tough talk on trade fairness and currency manipulation. The subject has cooled a bit, but with the new Treasury Secretary now at his post, the world will be looking for the official view on the dollar.
As I said before, I think the remarks about currency manipulation are (or should be) squarely directed toward China. And I suspect Abe may have conveyed to the president, in their round of golf, that Japan’s QE is quite helpful to the U.S. economy and policy efforts, even if it comes with a weaker yen (stronger dollar). Among many things, Japan’s policy on keeping its ten-year yield pegged at zero (which is stealth unlimited QE) helps put a lid on U.S. market interest rates. And that keeps the U.S. housing market recovery going, consumer credit going and U.S. stocks climbing, and that all fuels consumer confidence.
Yesterday we talked about the fourth quarter portfolio disclosures from the world’s biggest investors. With that in mind, let’s talk about the porfolio of the man that’s best position to benefit from the Trump administration: the legendary billionaire investor, Carl Icahn.
Icahn was an early supporter for Trump. He was an advisor throughout the campaign and helped shape policy plans for the president.
What has been the sore spot for Icahn’s underperforming portfolio in recent years? Energy. It has been heavily weighted in his portfolio the past two years and no surprise, it’s contributed to steep declines in the value of his portfolio over the past three years. Icahn’s portfolio is volatile, but over time it has produced the best long run return (spanning five decades) of anyone alive, including Buffett. And he’s worth $17 billion as a result.
Here’s a look at what I mean: In 2009 he returned +33%, +15% in 2010, +35% in 2011, +20% in 2012 and +31% in 2013. That’s quite a run, but he’s given a lot back–down 7% in 2014, down 20% in 2015 and down 20% last year.
Even with this drawdown, Icahn doesn’t see his energy stakes as bad investments. Rather, he thinks his stocks have been unfairly harmed by reckless regulation. And he’s been fighting it.
He penned a letter to the EPA last year saying its policies on renewable energy credits are bankrupting the oil refinery business and destroying small and midsized oil refiners.
And now that activism is positioned to pay off handsomely.
The new Trump appointee to run the EPA was first vetted by Icahn–it’s an incoming EPA chief that was suing the EPA in his role as Oklahoma attorney general. Safe to assume he’ll be friendly to energy, which will be friendly to Icahn’s portfolio.
And as we know, Icahn has since been appointed as an advisor to the president on REGULATION.
To get peek inside the portfolio of Trump’s key advisor, join me our Billionaire’s Portfolio. When you do, I’ll send you my special report with all of the details on Icahn, and where he’s investing his multibillion-dollar fortune to take advantage of Trump policies.
Our Billionaire’s Portfolio is the way investing should be. Its top-shelf intelligence, in an easy to understand format, delivered to your inbox. If you can read a weekly note, and push a button, this service is for you whether you’re a novice investor or a Wall Street titan. This is your opportunity to align your portfolio with the world’s smartest and most powerful investors. To learn from the best and ride their coattails to success.
You get access to the full gamut of billionaire intelligence. Join us now, get this special report, and get your portfolio in line with the richest, most powerful investors in the world.
The S&P 500 traded up to new record highs today. This morning the new President had three more big American business leaders (the car makers) in the White House for a face-to-face.
The three big American car makers all had big stock performance on the day, and their leaders walked away with very positive remarks (not dismay). It turns out that logical business operators like the prospects of doing business with the tailwinds of pro-growth economic policies.
Now, with Obamacare on the chopping block for the new administration, today let’s take a look what healthcare stocks might do.
Healthcare stocks in general have been beaten up since July of 2015, when a Republican Congress brought a vote to repeal Obamacare. The S&P 500 is up 7% from that date. The XLF (the ETF that tracks healthcare stocks) is down 9% in the same period.
Before that, Obamacare had been a money printing machine for much of the healthcare industry.
In this chart below, of the health insurance provider, Aetna, you can see the impact of Obamacare on the stock.
And here’s a look at the hospital company, HCA, also a big winner under Obamacare.
So what happens under Trump care? Trump has said he wants to keep people insured. It sounds like a rework to a more competitive system, rather than a tear down and rebuild. The first sign of visibility on a new plan is probably the greenlight to buy the healthcare ETF, and maybe the under performers in the Obamacare era.
For help building a high potential portfolio, follow me in our Billionaire’s Portfolio, where you look over my shoulder as I follow the world’s best investors into their best stocks. Our portfolio more than doubled the return of the S&P 500 in 2016. You can join me here and get positioned for a big 2017.
As we discussed on Friday, the dominant theme last week was the big run-up in global yields. This week, we have four central banks queued up to decide on rates/monetary policy.
With that, let’s take a look at the key economic measures that have been dictating the rate path or, rather, the emergency policy initiatives of the past seven years. Do the data still justify the policies?
First up tonight is Australia. The RBA was among the last to slash rates when the global economic crisis was unraveling. They cut from 7.25% down to a floor of just 3% (while other key central banks were slashing down to zero). And because China was quick to jump on the depressed commodities market in 2009, gobbling up cheap commodities, commodities bounced back aggressively. And the outlook on the commodity-centric Australian economy bounced back too. Australia actually avoided official recession even at the depths of the global economic crisis. With that, the RBA was quick to reverse the rate cuts, heading back up to 4.75%. But the world soon realized that emerging market economies could survive in a vacuum. They (including China) relied on consumers from the developed world, which were sucking wind for the foreseeable future.
The RBA had to, again, slash rates to respond to another downward spiral in commodities market, and a plummet in their economy. Rates are now at just 1.5% – well below their initial cuts in the early stages of the crisis.
But the Australian economy is now growing at 3.3% annualized. The best growth in four years. But inflation remains very low at 1.7%. Doesn’t sound bad, right? The August data was running fairly close to these numbers, and the RBA CUT rates in August – maybe another misstep.
The Bank of Japan is tonight. Remember, last month the BOJ, in a surprising move, announced they would peg the 10 year yield at zero percent. That has been the driving force behind the swing in global market interest rates. At one point this summer $12 trillion worth of negative yielding government bonds. The negative yield pool has been shrinking since. Japan has possibly become the catalyst to finally turn the global bond market. But pegging the rate at zero should also serve as an anchor for global bond yields (restricting the extent of the rise in yields). That should, importantly, keep U.S. consumer rates in check (mortgages, auto loans, credit card rates, etc.). Also, importantly, the BOJ’s policy move is beginning to put downward pressure on the yen again, which the BOJ needs much lower — and upward pressure on Japanese stocks, which the BOJ needs much higher.
With that, the Fed is next on the agenda for the week. The Fed has been laying the groundwork for a December rate hike (number two in their hiking campaign). As we know, the unemployment rate is well into the Fed’s approval zone (around 5%). Plus, we’ve just gotten a GDP number of 2.9% annualized (long run average is just above 3%). But the Fed’s favorite inflation gauge is still running below 2% (its target) — but not much (it’s 1.7%). Janet Yellen has all but told us that they will make another small move in December. But she’s told us that she wants to let the economy run hot — so we shouldn’t expect a brisk pace of hikes next year, even if data continues to improve.
Finally, the Bank of England comes Thursday. They cut rates and launched another round of QE in August, in response to economic softness/threat following the Brexit vote. There were rumors over the weekend that Mark Carney, the head of the BOE, was being pushed out of office. But that was quelled today with news that he has re-upped to stay on through 2019. The UK economy showed better than expected growth in the third quarter, at 2.3%. And inflation data earlier in the month came in hotter than expected, though still low. But inflation expectations have jumped to 2.5%. With rates at ¼ point and QE in process, and data going the right direction, the bottom in monetary policy is probably in.
So the world was clearly facing deflationary threats early in the year, which wasn’t helped by the crashing price of oil. But the central banks this week, given the data picture, should be telling us that the ship is turning. And with that, we should see more hawkish leaning views on the outlook for global central bank policies and the global rate environment.
Our Billionaire’s Porfolio is up over 15% this year — three times the return of the broader market. And each of the billionaire-owned stocks in the portfolio continues to have the potential to do multiples of what the broader market does — all led by the influence of our billionaire investors. If you haven’t joined yet, please do. Click here to get started.
The world was stirring today over the UK decision to leave the European Union. Here are a few things to keep in mind. As we discussed earlier in the week, the repercussions of the Brexit are very different than those that were feared over the potential “Grexit.” Greece was threatening to leave the euro. It would have had major and immediate financial complications, which could have quickly paralyzed the financial system.
The Brexit is more political than economic (not financial). And any retrenchment in the banking system because of uncertainty can be immediately quelled by central bank intervention. Not only were the central banks out in front of the potential exit outcome, promising to provide liquidity to the banking system, but they were also in last night stabilizing currencies, and likely bond yields as well.
As we said, there are also huge differences between now and 2008. When Lehman failed and global credit froze, we had no idea how policy makers might respond and how far they might go. Now we know, they will “do whatever it takes.”
The market volatility surrounding the Brexit may actually be a positive for the global economy. Seven years into the global economic recovery, global central banks have thrown the kitchen sink at the crisis, and they’ve proven to be able to stabilize the financial system and the global economy, and restore confidence. And that has all indirectly created an economic recovery, albeit a slow and sluggish one. But they haven’t been able to directly stimulate meaningful economic growth (the kind you typically see coming out of recession) because of the nature of the crisis.
Fiscal stimulus has been the missing piece of the puzzle.
Governments have been reluctant to spend, given the scars of the debt crisis. This may give policy makers an excuse to green light fiscal stimulus. After all, growth (or the lack thereof) is the primary driver of the public discontent – not just in the UK, but globally. Growth has a way of solving a lot of problems.
To follow our big picture views and our hand selected portfolio of the best stocks owned by the best billionaire investors in the world, join us in our Billionaire’s Portfolio.
Buffett’s famed annual letter is due to be released this weekend. With that, today we want to talk a bit about his record, his philosophy on markets and successful investing and the high conviction stocks that he has in his $130 billion plus Berkshire Hathaway stock portfolio.
First, only one living investor has a length of track record that can compare to Buffett’s. That’s fellow billionaire Carl Icahn. Icahn actually has a better record than Buffett, and it spans a little longer. But he gets a fraction of the attention of the man they call the Oracle of Omaha.(more…)
When housing prices stalled in 2006 and then collapsed over the next three years, the subprime lending schemes quickly became exposed.
Mortgage defaults led to a banking crisis. Due to the highly interconnectedness of banks globally, the problems quickly spread to banks around the world. A banking crisis led to a global credit freeze. When people can’t access credit, that’s when it all hits the fan. Companies can’t meet payroll, don’t have the liquidity to make new orders. Jobs get cut. Companies go bust. Finally, the microscope on overindebtedness of consumers and corporates, turns to countries. Deficits leads to debt. Debt leads to downgrades. Downgrades leads to defaults.
For the most part, defaults were averted because central banks and governments stepped in, in a coordinated way, to backstop failing banks, failing companies and failing countries. From that point, continued central bank stimulus has 1) enabled banks to recapitalize, 2) foiled additional shock events, and 3) restored confidence to employers (to hire), to investors (to invest) and to consumers (to spend again).
As we’ve discussed in the past two weeks, persistently low oil prices represent a risk on par with the housing bust. And in recent days we’re seeing the signs of another global financial and economic crisis creeping uncomfortably closer to a “part two.”
As we’ve said, this time would be much worse because governments and central banks have exhausted the resources to bailout failing banks, companies and countries. But central banks, namely the Bank of Japan and/or the European Central Bank do have the opportunity to step-in here, become an outright buyer of commodities (particularly oil), as part of their QE programs, to avert disaster. But time is the oil industries worst enemy and therefore a big threat to the global economy. The longer policymakers drag their feet, the closer we get to the edge of global crisis — a crisis manufactured by OPEC’s price war.
Unfortunately, there are the building signs that the market is beginning to position for the worst outcome…
Key bank stocks in Europe are trading at levels lower than in the depths of both the global financial crisis (2009) and the European sovereign debt crisis (2012).
Source: Reuters, Billionaire’s Portfolio
The credit default swap market for key industries is sending up flares. This is where default insurance can be purchased against a company or country – and the place speculators bet on a company’s demise. Billionaire John Paulson famously made billions betting against the housing market via credit default swaps. Now the fastest deteriorating companies in Europe are banks. And the fastest deteriorating companies in North America are insurance companies (a sector that tends to have investments in high yield debt … in this case, exposure to the high yield debt of the oil and gas industry).
Source: Markit
The early signal for the 2007-2008 financial crisis was the bankruptcy of New Century Financial, the second largest subprime mortgage originator. Just a few months prior the company was valued at around $2 billion.
On an eerily similar note, a news report hit this morning that Chesapeake Energy, the second largest producer of natural gas and the 12th largest producer of oil and natural gas liquids in the U.S., had hired counsel to advise the company on restructuring its debt (i.e. bankruptcy). The company denied that they had any plans to pursue bankruptcy and said they continue to aggressively seek to maximize the value for all shareholders. However, the market is now pricing bankruptcy risk over the next five years at 50% (the CDS market).
Still, while the systemic threat looks similar, the environment is very different than it was in 2008. Central banks are already all-in. On the one hand, that’s a bad thing for the reasons explained above (i.e. limited ammunition). On the other hand, it’s a good thing. We know, and they know, where they stand (all-in and willing to do whatever it takes). With QE well underway in Japan and Europe, they have the tools in place to put a floor under oil prices.
In recent weeks, both the heads of the BOJ and the ECB have said, unprompted, that there is “no limit” to what they can buy as part of their asset purchase program. Let’s hope they find buying up dirt-cheap oil and commodities, to neutralize OPEC, an easier solution than trying to respond to a “part two” of the global financial crisis.

 We’ve past yet another hurdle of concern for markets this past week. Last Friday this time, we had a potential catastrophic category 5 hurricane projected to decimate Florida.

 Last week we discussed the building support for a next leg higher in commodities prices. China is clearly a very important determinant in where commodities go. And with the news last week about cooperation between the Trump team and China, on trade, we may have the catalyst to get commodities moving higher again.It just so happens that oil (the most traded commodity in the world) is rebounding too, on the catalyst of prospects of an OPEC extension to the production cuts they announced last November.In fact, overnight, Saudi Arabia and Russia said they would do “whatever it takes” to cut supply (i.e. whatever it takes to get oil prices higher). Oil was up big today on that news.When you hear these words spoken from policy-makers (those that can dictate outcomes), it should get everyone’s attention. Those are the exact words uttered by ECB head Mario Draghi, that ended the bond market assault in Spain and Italy that were threatening the existence of the euro and euro zone. The Spanish 10-year yield collapsed from 7.8% (unsustainable borrowing rate for the Spanish government, and threatening imminent default) to 1% over the next three years — and the ECB, while threatening to buy an unlimited amount of bonds to push those yields lower, didn’t have to buy a single bond. It was the mere threat of ‘whatever it takes’ that did the trick.


