With a Fed decision queued up for tomorrow, let’s take a look at how the rates picture has evolved this year.
The Fed has continued to act like speculators, placing bets on the prospects of fiscal stimulus and hotter growth. And they’ve proven not to be very good.
Remember, they finally kicked off their rate “normalization” plan in December of 2015. With things relatively stable globally, the slow U.S. recovery still on path, and with U.S. stocks near the record highs, they pulled the trigger on a 25 basis point hike in late 2015. And they projected at that time to hike another four times over the coming year (2016).
Stocks proceeded to slide by 13% over the next month. Market interest rates (the 10 year yield) went down, not up, following the hike — and not by a little, but by a lot. The 10 year yield fell from 2.33% to 1.53% over the next two months. And by April, the Fed walked back on their big promises for a tightening campaign. And the messaging began turning dark. The Fed went from talking about four hikes in a year, to talking about the prospects of going to negative interest rates.
That was until the U.S. elections. Suddenly, the outlook for the global economy changed, with the idea that big fiscal stimulus could be coming. So without any data justification for changing gears (for an institution that constantly beats the drum of “data dependence”), the Fed went right back to its hawkish mantra/ tightening game plan.
With that, they hit the reset button in December, and went back to the old game plan. They hiked in December. They told us more were coming this year. And, so far, they’ve hiked in March and June.
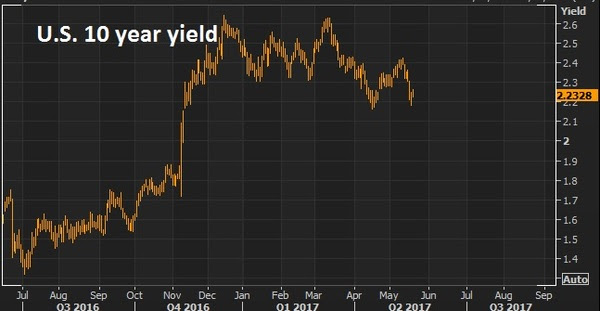
Below is how the interest rate market has responded. Rates have gone lower after each hike. Just in the past couple of days have, however, we returned to levels (and slightly above) where we stood going into the June hike.
But if you believe in the growing prospects of policy execution, which we’ve been discussing, you have to think this behavior in market rates (going lower) are coming to an end (i.e. higher rates).
As I said, the Hurricanes represented a crisis that May Be The Turning Point For Trump. This was an opportunity for the President to show leadership in a time people were looking for leadership. And it was a chance for the public perception to begin to shift. And it did. The bottom was marked in Trump pessimism. And much needed policy execution has been kickstarted by the need for Congress to come together to get the debt ceiling raised and hurricane aid approved. And I suspect that Trump’s address to the U.N. today will add further support to this building momentum of sentiment turnaround for the administration. With this, I would expect to hear a hawkish Fed tomorrow.
Join our Billionaire’s Portfolio today to get your portfolio in line with the most influential investors in the world, and hear more of my actionable political, economic and market analysis. Click here to learn more.
As we know, inflation has been soft. Yet the Fed has been moving on rates, assuming that they have room to move away from zero without counteracting the same data that is supposed to be driving their decision to increase rates.
Thus far, after four (quarter point) increases to the Fed funds rate, the moves haven’t resulted in a noticeable tightening of financial conditions. That’s mainly because the interest rate market that most key consumer rates are tied to have remained low. Because inflation has remained low.
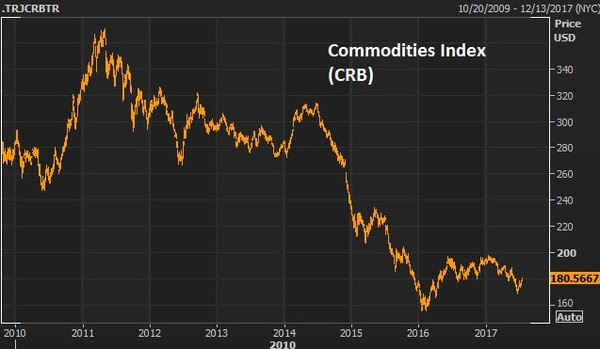
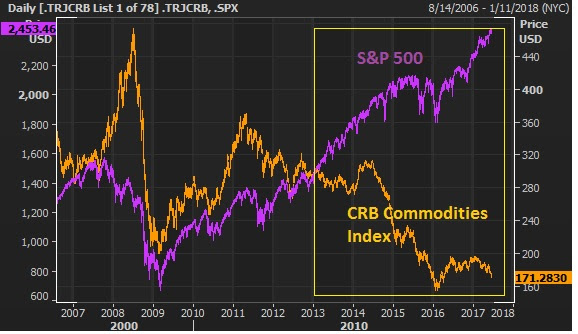
A key contributor to low inflation has been low oil prices (though the Fed doesn’t like to admit it) and commodity prices in general that have yet to sustain a recovery from deeply depressed levels (see the chart below).
But that may be changing.
Commodities have been lagging the rest of the “reflation” trade after the value of the index was cut in half from the 2011 highs. Remember, we looked at this divergence between the stocks and commodities last month. Commodities are up 6% since.
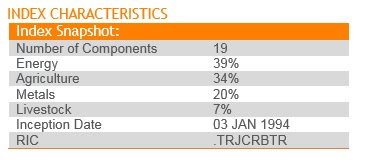
Things are picking up. Here’s the makeup of the broadly followed commodities index.
You can see, energy has a heavy weighting. And oil, with another strong day today, looks like a break out back to the $50 level is coming.With today’s inventory data, we’ve now had 12 out of the past 14 weeks that oil has been in a draw (drawing down on supply = bullish for prices). And with that backdrop, the CRB index, after being down as much as 13% this year, bottomed following the optimistic central bank commentary last month, and is looking like it may be in the early stages of a big catch-up trade. And higher oil (and commodity prices in general) will likely translate into higher inflation expectations.
Join our Billionaire’s Portfolio and get my most recent recommendation – a stock that can double on a resolution on healthcare. Click here to learn more.
Without a doubt, there was a significant shift in the outlook on central bank monetary policy this week. In fact, the events of the week may represent the official market acceptance of the “end of the easy money” era.
Draghi told us deflation is over and reflation is on. Yellen told us we should not expect another financial crisis in our lifetimes. Carney at the Bank of England told us removal of stimulus is likely to become necessary, and up for debate “in the coming months.” And even the Finance Minister in Japan joined in, saying Japan was recovery from deflation.
With that, in a world where “reflation” is underway, rates and commodities lead the way.
Here’s a look at the chart on the 10-year yield again. We looked at this on Tuesday. I said, the “Bottom May Be In For Oil and Yields.” That was the dead bottom. Rates bounced hard off of this line we’ve been watching …
This reflation theme confirmed by central banks has put a bid under commodities…
That’s especially important for oil, which had been trading down to very dangerous levels, the levels that begin threatening the solvency of oil producers.
That’s a 9% bounce for oil from the lows of last week!
This all looks like the beginning of another leg of recovery for commodities and rates (with the catalyst of this central bank guidance). Which likely means a lower dollar (as we discussed earlier this week). And a quieter broad stock market (until growth data begins to reflect a break out of the sub 2% GDP funk).
Have a great weekend.
Join the Billionaire’s Portfolioto hear more of my big picture analysis and get my hand-selected, diverse stock portfolio following the lead of the best activist investors in the world.
Yesterday we talked about the Draghi remarks (head of the European Central Bank) that were intended to set expectations that the ECB might be moving toward the exit doors on QE and zero interest rate policy. That bottomed out global rates — which popped U.S. rates further today. The Bank of England piled on today, talking about rate normalization soon.
We’ve gone from 2.12% in the U.S. ten year yield to 2.25% in about 24 hours. These are big swings in the interest rate market – a big bounce and, as I’ve said, the bottom appears to be in for rates.
As importantly, this prepared speech by Draghi could very well cement the top in the dollar. It begins to tighten a very wide interest rate spread between the U.S. and global rates. We entered the year with the Fed going one way (tightening) while the rest of the world was going the other way (easing). That’s a recipe for capital to storm into U.S. assets — into the dollar. And now that may be over.
I’ve been researching long-term cycles in the dollar for a very long time and throughout the global financial crisis period, it these cycles in the world’s reserve currency have been my guidepost for drawing a lot of conclusions on markets and the outlook for capital flows over the past several years.
Despite the choppiness in the dollar for much of the crisis, if we look back at the cycles following the failure of the Bretton Woods system, we were able, very early on, to determine the dollar was in a bull cycle.
This view came in the face of all of the negative global sentiment toward the dollar in 2010. Foreign leaders were taking shots at the Fed, accusing the Fed of trying to destroy the dollar. People were calling for the end of the dollar as the world’s reserve currency. All the while, the dollar held firm and ultimately made an aggressive climb.
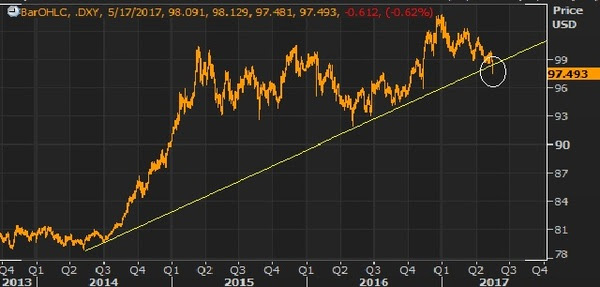
Take a look below at my chart on the long term dollar cycles…
I’ve watched this chart for quite some time, defining the five complete dollar cycles over the past nearly 40 years, and the most recent bull cycle.
If we mark the top of the most recent cycle in early January, this bull cycle has matched the longest cycle in duration (at 8.8 years) and comes in just shy of the long-term average performance of the five complete cycles. The most recent bull cycle added 47%. The average change over a long term cycle has been 56%. This all argues that the dollar bull cycle is over. And a weaker dollar is ahead. That should go over very well with the Trump administration.
Join the Billionaire’s Portfolioto hear more of my big picture analysis and get my hand-selected, diverse stock portfolio following the lead of the best activist investors in the world.
Last week we looked at the some of the clear evidence that the economy is as primed as it can possibly get for a catalyst to come in and pop growth.That catalyst, despite all of the scrutiny, will be Trumponomics.
At the very least, a corporate tax cut will directly hit the bottom line of corporate America. And one of the huge drags on demand, structurally, is the lack of wage growth. And as we discussed, the big winner in a corporate tax cut will be workers/wage growth — a non-partisan tax think tank thinks it can pop wage growth, by as much as doublethe current growth rate. That would be huge, especially for one of the key pillars of the recovery — housing.Remember, the two biggest drivers of recovery have been: 1) stocks, and 2) housing. Those two assets have done the lion’s share of work when it comes to restoring confidence. And a lot of other key pieces fall into place when confidence comes back.
On the housing front, over the past year, both mortgage rates and house prices have gone UP – a new dynamic in the post crisis recovery (adding higher rates into the mix). So owning a house has become more expensive over the past year. But how much?
Let’s take a look at how that has affected the monthly outlay for new homeowners over the course of the past year.
From March 2016 to March 2017, the average 30 year fixed mortgage went from 3.70% to 4.20%.
The Case-Shiller housing price index of the top 20 markets in the U.S. is up 6% over that twelve month period (the most recent data). That’s increased the monthly outlay (principal and interest) for new homeowners by 11% over the past year.
Now, with that said, we look at the recent behavior of the 10 year note (the benchmark government bond yield that heavily influences mortgage rates). It’s been in world of its own — sliding back to seven month lows, while stocks are hitting record highs. Manipulation? Likely. As I’ve said before, don’t underestimate the value of QE that is still in full force around the world — namely in Japan and Europe. That’s freshly printed money that can continue to buy our Treasuries, keeping a cap on interest rates, which keeps a cap on mortgage rates, which keeps the housing recovery and the recovery in consumer credit demand intact.
What stocks are cheap?Join me today to find out what stocks I’m buying in my Billionaire’s Portfolio. It’s risk-free. If for any reason you find it doesn’t suit you, just email me within 30-days.
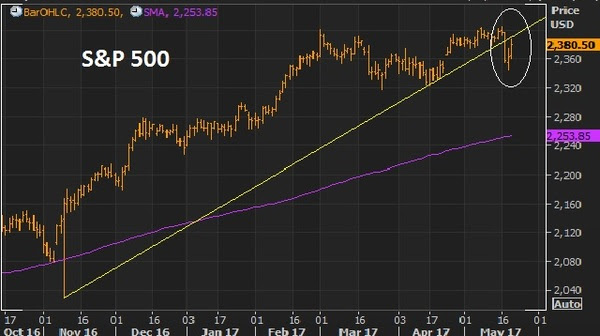
Stocks continue to bounce back today. But the technical breakdown of the Trump Trend on Wednesday
still looks intact. As I said on Wednesday, this looks like a technical correction in stocks (even considering today’s bounce), not a fundamental crisis-driven sell-off.
With that in mind, let’s take a look at the charts on key markets as we head into the weekend.
Here’s a look at the S&P 500 chart….
For technicians, this is a classic “break-comeback” … where the previous trendline support becomes resistance. That means today’s highs were a great spot to sell against, as it bumped up against this trendline.
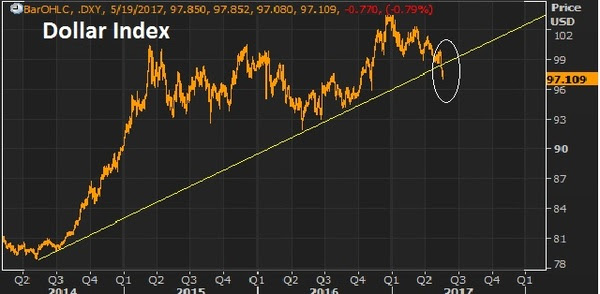
Very much like the chart above, the dollar had a big trend break on Wednesday, and then aggressively reversed Thursday, only to follow through on the trend break to end the week, closing on the lows.
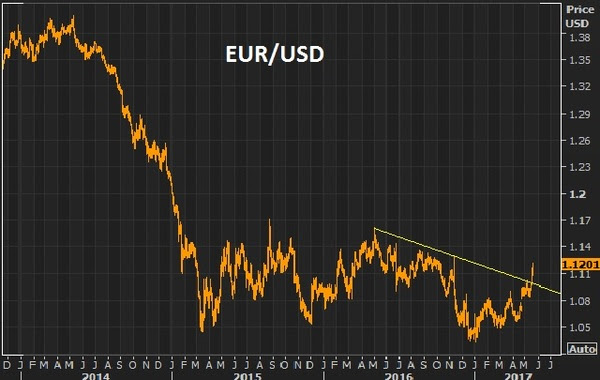
On that note, the biggest contributor to the weakness in the dollar index, is the strength in the euro (next chart).
The euro had everything including the kitchen sink thrown at it and it still could muster a run toward parity. If it can’t go lower with an onslaught of events that kept threatening the existence of the euro, then any sign of that clearing, it will go higher. With the French elections past, and optimism that U.S. growth initiatives will spur global growth (namely recovery in Europe), then the European Central Bank’s next move will likely be toward exit of QE and extraordinary monetary policies, not going deeper. With that, the euro looks like it can go much higher. That means a lower dollar. And it means, European stocks look like, maybe, the best buy in global stocks.
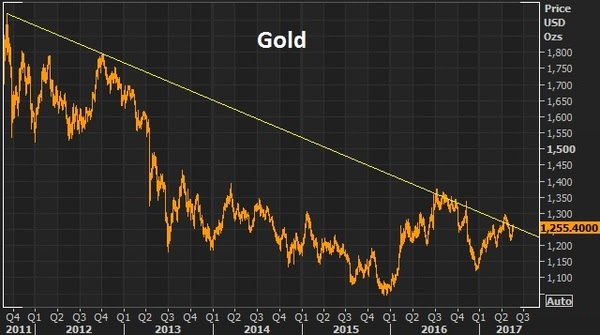
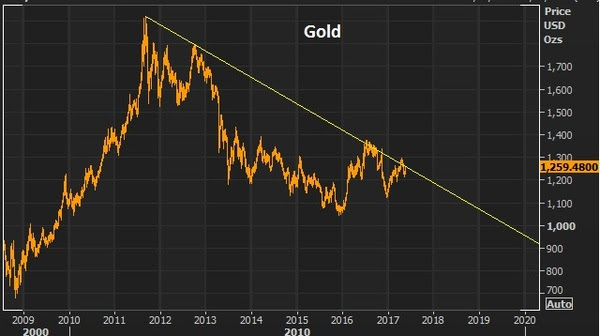
A lower dollar should be good for gold. As I’ve said, if Trump policies come to fruition, inflation could get a pop. And that’s bullish for gold. If Trump policies don’t come to fruition, the U.S. and global growth looks grim, as does the post-financial crisis recovery in general. That’s bullish for gold.
This big trendline in gold continues to look like a break is coming and higher gold prices are coming.
With all of the above, the most important chart of the week is probably this one …
The 10 year yield has come all the way back to 2.20%. The best reason to wish for a technical correction in stocks, is not to buy the dip (which is a good one), but so that the pressure comes out of the interest rate market (and off of the Fed). The run in the stock market has clearly had an effect on Fed policy. And the Fed has been walking rates up to a point that could choke off the existing economic recovery momentum and, worse, neutralize the impact of any fiscal stimulus to come. Stable, low rates are key to get the full punch out of pro-growth policies, given the 10 year economic malaise we’re coming out of.Invitation to my daily readers: Join my premium service members at Billionaire’s Portfolio to hear more of my big picture analysis and get my hand-selected, diverse portfolio of the most high potential stocks.
Yesterday we talked about the disconnect between the daily drama from the media in Washington (doom and gloom), and what the markets have been communicating (an economic expansion is underway). Today, you might think that connection is happening — the doom and gloom scenario is finally being realized in markets. Probably not.
For perspective: As of the close yesterday, the Nasdaq was up 18% year to date (just five months in). Gold was in the middle of a three year range. Market interest rates (the U.S. 10-year government bond yield) was just above the middle of the range of the past four years. The dollar was not far off its strongest levels in 15 years.
Today the media has explicitly printed the headline of impeachment for Trump (actually, they’ve run those headlines a various times over the past several months). Nonetheless, stocks (the S&P 500) today are off by 1.6%.
This gets the bears very excited. I saw the story about consumer debt, surpassing 2008 levels, floating all over the internet today. People tried to make the bubble connection — implying another debt crisis was coming.
The real story: Total household indebtedness finally surpassed the previous peak from 2008. That’s precisely what the Fed was attempting to do with zero interest rates. Make existing debt cheaper to manage, and at some point, break the psychology of the debt burden and get people borrowing (at ultra-cheap rates), investing and spending again. Otherwise, our economy and the world economy would have gone into a deflationary spiral.
That said, as I’ve found in my 20 years in this business, people tend to find a story to fit the price. The story hadn’t been fitting the price for much of the past six months. Today, it seems pretty easy. See the chart below of stocks ….
We had the first breakdown of the Trump trend in March, but all it could muster was about a 3% correction. This looks much more like a technical correction (a double top, and trend break today) – than a Trump impeachment trade. I suspect with the earnings catalyst behind us, this is the start of a deeper technical correction, which is healthy in a bull market. And it may take significant progress made in tax reform to see new highs in the broad stock indicies. We shall see.This next chart is the dollar index. This too had a significant trend break today. This translates into a higher euro, which would spell out a story where Europe is improving and the ECB is able in start discussing exit from QE.
What about the Trump/Comey saga? Aren’t people dumping dollars because of that? Not likely. If that were potentially destabilizing to the U.S., it would be destabilizing to the global economy, and people would buy dollars not sell them.
With that in mind, here’s gold. Gold sits on the brink of a big trend break (higher). When looking at gold and the dollar, it’s important to remember this: back in the heat of the crisis, gold and the dollar moved together, higher! That’s opposite of the traditional correlation. They moved higher together because people bought gold and they bought dollars (and dollar denominated assets, like Treasuries) as they viewed it the safest alternative in the world to park money – with the chance of getting it back.
With a break higher in gold looking imminent, and the dollar looking lower, it looks like a more traditional relationship. It’s not communicating crisis.
Follow This Billionaire To A 172% Winner
In our Billionaire’s Portfolio, we have a stock in our portfolio that is controlled by one of the top billion dollar activist hedge funds on the planet. The hedge fund manager has a board seat and has publicly stated that this stock is worth 172% higher than where it trades today. And this is an S&P 500 stock!
Even better, the company has been constantly rumored to be a takeover candidate. We think an acquisition could happen soon as the billionaire investor who runs this activist hedge fund has purchased almost $157 million worth of this stock over the past year at levels just above where the stock is trading now.
So we have a billionaire hedge fund manager, who is on the board of a company that has been rumored to be a takeover candidate, who has adding aggressively over the past year, on a dip.
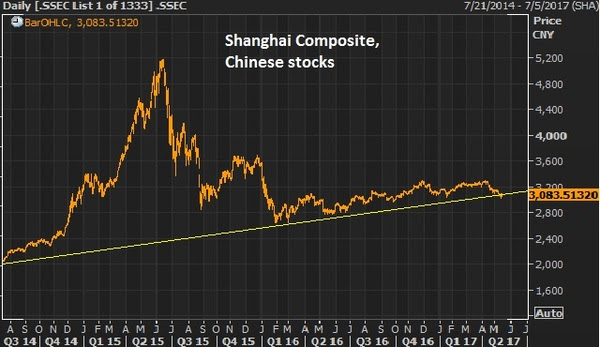
As we ended this past week, stocks remain resilient, hovering near highs. The Nasdaq had a visit to the 200-day moving average intraweek for a slide of a whopping (less than) 1%, and quickly it bounced back.It’s a Washington/Trump policies-driven market now, and while the media carries on with narratives about Russia and the FBI, the market cares about getting health care done (which there was progress made last week), getting tax reform underway, and getting the discussion moving on an infrastructure spend.We looked at oil and commodities yesterday. Chinese stocks look a lot like the chart on broader commodities. With that, the news overnight about some cooperation between the Trump team and China on trade has Chinese stocks looking interesting as we head into the weekend.
Let’s take at the chart…
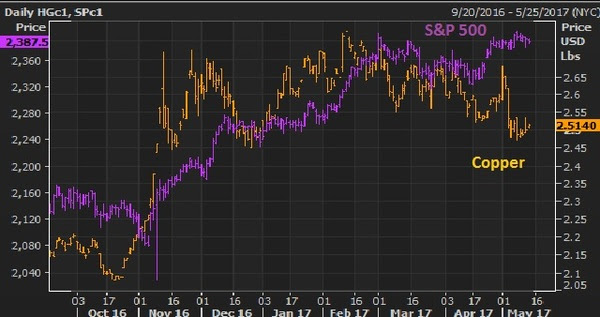
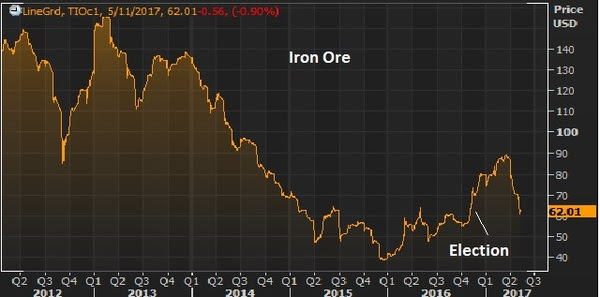
While the agreements out of China were said not to touch on steel and industrial metals, the first steps of cooperation could put a bottom in the slide in metals like copper and iron ore. These are two commodities that should be direct beneficiaries in a world with better growth prospects, especially with prospects of a $1 trillion infrastructure spend in the U.S. With that, they had a nice run up following the election but have backed off in the past couple of months, as the infrastructure spend appeared not to be coming anytime soon.
Here’s copper and the S&P 500…
Trump policies are bullish for both. Same said for iron ore…
This is right in the wheelhouse of Wilbur Ross, Trump’s Secretary of Commerce. He’s made it clear that he will fight China’s dumping of steel on the U.S. markets, which has driven steel prices down and threatened the livelihood of U.S. steel producers. Keep an eye on these metals next week, and the stocks of producers.
Follow This Billionaire To A 172% Winner
In our Billionaire’s Portfolio, we have a stock in our portfolio that is controlled by one of the top billion dollar activist hedge funds on the planet. The hedge fund manager has a board seat and has publicly stated that this stock is worth 172% higher than where it trades today. And this is an S&P 500 stock!
Even better, the company has been constantly rumored to be a takeover candidate. We think an acquisition could happen soon as the billionaire investor who runs this activist hedge fund has purchased almost $157 million worth of this stock over the past year at levels just above where the stock is trading now.
So we have a billionaire hedge fund manager, who is on the board of a company that has been rumored to be a takeover candidate, who has adding aggressively over the past year, on a dip.
Today we heard from Janet Yellen in the first part of her semi-annual testimony to Congress. She gave prepared remarks to the Senate today and took questions. Tomorrow it will be the House. The prepared statement will be the same, with maybe a few different questions.
Remember, just four months ago, the most important actor in the global economy was the Fed. Central banks were in control (as they have been for the better part of 10 years), with the Fed leading the way.
The Fed was the ultimate puppet master. By keeping rates ultra-low and standing ready to act against anything that might destabilize the global economy and threaten to kill the dangerously slow recovery, they (along with the help other major central banks) restored confidence, and created the stability and incentives to drive hiring, investing and spending — which created economic recovery.
When Greece bubbled up again, when oil threatened to shake the financial system, when China’s slowdown created uncertainty, central banks were quick to step in with more easing, bigger QE, promises of low rates for a very long time, etc.. And in some cases, they outright intervened, like when the ECB averted disaster in Italy and Spain by promising to buy unlimited amounts of Italian and Spanish government bonds to stop speculators from inciting a bond market collapse and a collapse of the euro and European Union.
This dynamic of central bank activism has changed. The Fed, and central bank intervention in general, is no longer the only game in town. We have fiscal stimulus coming and structural change underway that has the chance to finally mend the decade long slump of the global economy. That’s why today’s speech by the Fed Chair was no longer the biggest event of the week — not even the day.
The scripts has flipped. Where the Fed had been driver of recovery, they now have become the threat to recovery. So the interest in Fedwatching today is only to the extent that they may screw things up.
Moving too fast on interest rate hikes has the potential weaken or even undo the gains that stand to come from the pro-growth policies efforts from the new administration.
Remember, the Fed told us in December that they projected THREE hikes this year. But keep in mind, they projected FOUR in December of 2015, for 2016, and we only got one. And that was only AFTER the election, and the swing in sentiment regarding the prospects of pro-growth policies.
Remember, Bernanke himself has criticized the Fed for stalling momentum in the recovery by showing too much tightening (i.e. over optimism) in their forecasts. And he argued that the Fed should give the economy some room to run and sustain momentum, fighting inflation from behind.
On that note, the Fed has now witnessed the bumpy path that the new administration is dealing with, and will be traveling, in implementing policy. I would think they would be less aggressive now in their view on rate hikes UNTIL they see evidence of policy execution, and a lot more evidence in the data. Let’s hope that’s the case.
For help building a high potential portfolio for 2017, follow me in our Billionaire’s Portfolio, where you look over my shoulder as I follow the world’s best investors into their best stocks. Our portfolio more than doubled the return of the S&P 500 in 2016. You can join me here and get positioned for a big 2017.
We’ve talked a lot about the set ups for big moves in Japanese and German stocks, as these major stock markets have lagged the recovery in the U.S.
Many have yet to come to the realization that a higher growth, healthier U.S. economy is good for everyone — starting with developed marketeconomies. And it unquestionably applies to emerging market economies, despite the fears of trade constraints.
A trillion dollars of U.S. money to be repatriated, has the dollar on a run that will likely end with USDJPY dramatically higher, and the euro dramatically lower (maybe all-time lows of 0.83 cents, before it’s said and done). This is wildly stimulative for those economies, and inflation producing for two spots in the world that have been staring down the abyss of deflation.
This currency effect, along with the higher U.S. growth effect on German and Japanese stocks will put the stock markets in these countries into aggressive catch up mode. I think the acceleration started this week.
As I said last week, Japanese stocks still haven’t yet taken out the 2015 highs. Nor have German stocks, though both made up significant ground this week. Yen hedged Nikkei was up 4.5% this week. The euro hedged Dax was up 7.6%.
What about U.S. stocks? It’s not too late. As I’ve said, it’s just getting started.
We’ve talked quite a bit about the simple fundamental and technical reasons stocks are climbing and still have a lot of upside ahead, but it’s worth reiterating. The long-term trajectory of stocks still has a large gap to close to restore the lost gains of the past nine-plus years, from the 2007 pre-crisis highs. And from a valuation standpoint, stocks are still quite cheap relative to ultra-low interest rate environments. Add to that, a boost in growth will make the stock market even cheaper. As the “E” in the P/E goes up, the ratio goes down. It all argues for much higher stocks. All we’ve needed is a catalyst. And now we have it. It’s the Trump effect.
But it has little to do with blindly assuming a perfect presidential run. It has everything to do with a policy sea change, in a world that has been starving (desperately needing) radical structural change to promote growth.
Not only is this catch up time for foreign stocks. But it’s catch up time for the average investor. The outlook for a sustainable and higher growth economy, along with investor and business-friendly policies is setting the table for an era of solid wealth creation, in a world that has been stagnant for too long. That stagnation has put both pension funds and individual retirement accounts in mathematically dire situations when projecting out retirement benefits. So while some folks with limited perspective continue to ask if it’s too late to get off of the sidelines and into stocks, the reality is, it’s the perfect time. For help, follow me and look over my shoulder as I follow the world’s best investors into their best stocks. Our portfolio is up more than 27% this year. You can join me here and get positioned for a big 2017.

 With a Fed decision queued up for tomorrow, let’s take a look at how the rates picture has evolved this year.


 Yesterday we talked about the disconnect between the daily drama from the media in Washington (doom and gloom), and what the markets have been communicating (an economic expansion is underway). Today, you might think that connection is happening — the doom and gloom scenario is finally being realized in markets. Probably not.
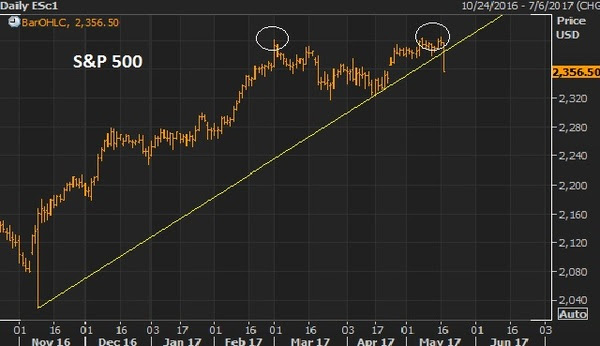
 As we ended this past week, stocks remain resilient, hovering near highs. The Nasdaq had a visit to the 200-day moving average intraweek for a slide of a whopping (less than) 1%, and quickly it bounced back.It’s a Washington/Trump policies-driven market now, and while the media carries on with narratives about Russia and the FBI, the market cares about getting health care done (which there was progress made last week), getting tax reform underway, and getting the discussion moving on an infrastructure spend.We looked at oil and commodities yesterday. Chinese stocks look a lot like the chart on broader commodities. With that, the news overnight about some cooperation between the Trump team and China on trade has Chinese stocks looking interesting as we head into the weekend.