After some broad selling across markets yesterday, stocks bounced back today. With that, you might expect interest rates to push up and commodities to be rising too. That was not the case, which continues the trend of the past week (or so) of odd market behavior.
About a tenth of the strength in the S&P 500 can be attributed to Wal-Mart. Wal-Mart had a big earnings beat today with the best sales growth since before the financial crisis.
With that, let’s take a look at how Amazon’s war on traditional retail has affected Wal-Mart.
It wasn’t long ago that Wal-Mart was the biggest company in the world. It topped the Fortune 500 list from 2002 through 2005, and then again in 2007 (with a more than $300 billion market cap). At that time, Amazon was a $25 billion company. And then the financial crisis hit. Wal Mart was almost put out of business because of the global credit freeze. And then we had massive intervention to get credit moving again and to save the economy. With that intervention came a massive fiscal stimulus package. A huge chunk of it flooded into Silicon Valley (pension money followed it).
And, since then, although Amazon was a decade old company at the time, Amazon has had a trajectory similar to the other big tech giants of today. It’s more than 20 times as big today.
For perspective, in 2006, Wal-Mart was a $315 billion company. Today, the U.S. economy is 34% bigger than it was in 2006 (about $5 trillion bigger). And Wal-Mart is 15% smaller than it was in 2006 (at a market cap of $268 billion).
But Wal-Mart has finally started fighting for its life.
They bought a controlling stake in JD.com in the middle of last year to access the growing middle class in China. JD.com is the number two e-commerce site in China, but is rapidly closing the gap between itself and Alibaba (number 1). And JD has competitive advantages over Alibaba, in that, like Amazon, it owns its distribution centers and has control over quality (unlike an ebay and Alibaba). They’ve since upped the stake to 20% and may ultimately buy all of it. And Wal-Mart bought the startup Jet.com in the U.S. in August of last year. If they continue to win share in China through JD.com, this gap between Amazon and Wal-Mart may begin to start closing.
Join our Billionaire’s Portfolio today to get your portfolio in line with the most influential investors in the world, and hear more of my actionable political, economic and market analysis. Click here to learn more.
As we’ve discussed, in the post-election world (of last year) we’ve had a passing of the baton from a global economy driven by monetary policy, to a global economy driven by structural reform and fiscal stimulus.
With the anticipation of fiscal stimulus, the election represented the end of the QE-era. With that, the top central bankers in the world (Fed, ECB, BOJ, BOE) met today and had a coordinated message to that effect. Just as they coordinated their QE programs to stabilize the world and manufacture recovery, they vowed to coordinate on the exit of QE.
Still, Europe has more work to do before following the Fed’s lead on “normalizing” rates. And Japan will be far behind Europe in ending QE. But that message of coordination should keep global (market) interest rates moving higher.
We’ve talked in recent days about the pockets of selling in global markets. Last week it was junk bonds, then Japanese stocks, then Treasurys and then gold. Today it was commodities, led by oil. Oil was down 2.4% on the day. And the dollar was lower (not higher, as some might expect with commodities moving lower).
Meanwhile, the big U.S. market indices couldn’t be shaken and the Treasury market was very quiet. These intermarket relationships haven’t been normal. And that should raise some eyebrows about elevating risk.
We’ve talked in recent days about the influence that we may be seeing in markets from Saudi Arabia’s move to investigate (potentially seize) up to $800 billion of wealth from high profile officials accused of fleecing the country.
The proxy for global market stability, throughout the past decade (the crisis and post-crisis era), has been U.S. stocks. So as long as U.S. stocks are holding up, people continue to ignore some of these “risk” signs. But give it a 2% down day and suddenly the observables may become observed.
Join our Billionaire’s Portfolio subscription service today to get your portfolio in line with the most influential investors in the world, and hear more of my actionable political, economic and market analysis. Click here to learn more.
Into the latter part of last week, we had some indiscriminate selling in some key markets. First it was Japanese stocks that followed a new 25-year high with a 1,100 point drop. Then we had some significant selling in junk bonds and U.S. Treasuries. And then four million ounces of gold was sold in about a 10 minute period on Friday.
Markets were tame today, but as I said on Friday, the potential ripples from the political shakeup and related asset freeze in Saudi Arabia is a risk that still doesn’t seem to be given enough attention. I often talk about the many fundamental reasons to believe stocks can go much higher. But experience has shown me that markets don’t go in a straight line. There are corrections along the way, and we haven’t had one in a while.
With that said, since 1946, the S&P 500 has had a 10% decline about once a year (according to American Funds research).
The largest decline this year has been only 3.4%.
I could see a scenario play out, with forced selling related to the Saudi events, that looks a lot like this correction in 2014.
This chart was fear driven – when the Ebola fears were ramping up. You can see how quickly the slide accelerated. The decline hit 10% on the nose, and quickly reversed. Fear and forced selling are great opportunities to buy-into. This decline was completely recovered in 30 trading days.
We constantly hear predictions of impending corrections, pointing to all of the clear evidence that should drive it, but corrections are often caused by events that are less pervasive in the market psyche. The Saudi story would qualify. And we’re in a market that is underpricing volatility at the moment – with the VIX sitting only a couple of points off of record lows (i.e. little to no fear). Forced liquidations can create some fear.
Join our Billionaire’s Portfolio subscription service today to get your portfolio in line with the most influential investors in the world, and hear more of my actionable political, economic and market analysis. Click here to learn more.
Japanese stocks have been a huge mover over the past quarter, as we discussed earlier this week. That move extended to a new 25-year high overnight. And then we got this …
As you can see on the far right of this daily chart, the Nikkei had a very slippery reversal to post an 1,110 point range for the day (closing near the lows).
This was the biggest range in the Nikkei since exactly one year ago today. That was the night of the U.S. elections (the day, in Japan).
Now, despite the huge range of the day, today’s losses in Japanese stocks were only 1.7% (open to close). Let’s take a look back over the past two years, though, to other times we’ve had a 1,000+ point range and on a down day.
There was the Brexit surprise in June 2016 (-9%). And then when the Bank of Japan shocked world markets in a scheduled meeting by NOT upping its QE program in April 2016 (-7%). Prior to that, was the middle of January of 2016 when oil prices were crashing (-4% and -4% two out of three trading days). Then there was December 18, 2015, the day after the Fed made its first post-crisis Fed hike (-2%). And then we had a day in August 2015 (-6%) and into the first day of September (-5%). These were driven by a surprise devaluation of the Chinese yuan, which set off a global stock market slide on fears of a weaker China, than most thought.
Now, we’ve just looked at all of the days for Japanese stocks where the range has been greater than 1,000 points and stocks have finished down. As you might deduce, these days all share a common thread. There was a big event related to these moves. So what was the event that caused this last night?
Nothing, of note. That’s concerning. Is there something bigger going on, that has yet to present itself. Is it perhaps the news out of Saudi Arabia that is about to lead to a global event?
Keeping the focus on what happened in Japan: First, for market technicians, this is a perfect “outside day” reversal signal. This is when a new high is set in an uptrend, a buying climax, and the buying exhausts and weak speculative longs are quickly shaken out of positions forcing prices to lower lows than the prior day (closing near the lows). The wider the range, and the more significant the volume, the higher the likelihood that a trend reversal is underway.
With that in mind, to the far right, you can see the spike in volume for the day.
As far as the range is concerned, we discussed the significance of a 1,000 point range historically.
So technically, there’s a fair reason to bet on a reversal here for Japanese stocks here. That leaked over into European stocks today. German stocks were down 1.4%. And it looked like U.S. stocks might have the same fate today, but the “buy the dip” appetite was clearly strong. If history is any indication, we might have better levels to buy the dip. And the dips in recent history have been lucrative: sharp but quickly recovered.
Join our Billionaire’s Portfolio subscription service today to get your portfolio in line with the most influential investors in the world, and hear more of my actionable political, economic and market analysis. Click here to learn more.
This trajectory for stocks was not an outcome that Wall Street was looking for.
I looked back at an article on market forecasts published by Fortune in December of last year. Here’s how they saw it…
So the group with access to the best information didn’t do a good job of interpreting that information. And you can see in the forecasts, they were pretty much in agreement. They were looking for just better than 2,300 for the year. They saw a +3.7% year for the S&P 500. They undershot by 12.2 percentage points thus far.
They should have listened to billionaire Larry Robbins. Remember, he did a study on the influence of low interest rates, Fed policy and oil on markets. He says every time ONE of these (following) conditions has existed, the market has produced positive returns.
When the 30-year bond yield begins the year below 4%, stocks go up 22.1%.
When investment grade bonds yield below 4%, stocks go up 16%.
When high-yield bonds yield below 8%, stocks go up 11.6%.
When cash as a percent of asset for non-financials is above 10%, stocks go up 17.6%.
When the Fed tightens 0-75 basis points in the year, stocks go up 22%.
When oil falls more than 20%, stocks go up 27.5%.
All of these conditions have been met this year. And stocks are up 16% with about seven weeks remaining in the year.
Add to this, the idea that a regime shift was underway, moving from a QE-driven economy, to an economy to be driven by structural reform and fiscal stimulus (under the incoming Trump administration this year), should have bumped up even the most conservative of forecasts on stocks for the year. With the economy still performing under potential, yet with the momentum of low interest rates, cheap gas, low unemployment and solid balance sheets, the pieces have been in place for a pop in growth. The idea of feeding fiscal stimulus into that mix should have had Wall Street forecasting the rise of all asset prices. They didn’t see it coming.
Join our Billionaire’s Portfolio subscription service today to get your portfolio in line with the most influential investors in the world, and hear more of my actionable political, economic and market analysis. Click here to learn more.
Oil is up over 3% today, trading up to the highest levels since June of 2015.
We were already at new highs for the year as of Friday’s close, and then we get news over the weekend of the political shakeup and arrests in Saudi Arabia.
We’ve talked about the fundamental case for much higher oil prices throughout the recovery last year, and again this summer. You never know what catalyst may come in to accelerate the move in price. We may have had it with this Saudi news.
Among the reasons to expect a potential violent move in oil prices: OPEC has been cutting production into a (ex OPEC, ex U.S.) world that’s not producing (i.e. there’s negative production growth). Given the scars of last year’s oil price bust, oil producers haven’t been spending on new production.
Meanwhile, there’s U.S. supply that is supposed to fill that void, but U.S. supply has been in consistent draw down, 26 of the past 31 weeks, to the tune of 8% lower supply.
Add to this, we have a global economy that’s improving, and with that, demand is increasing. And we have U.S. fiscal stimulus entering to stoke those flames.
We looked at this chart last month.
Source: Billionaire’s Portfolio
We had this this inverse head and shoulders (in the chart above) that projected a move back to the low $80s. And as part of that technical picture, we were setting up for a break of a big two-year trendline that would open the doors to a move back into the $70+ oil area.
That line broke at around $51.50, confirming that head and shoulders pattern, and the move has been aggressive since. We now have this chart …
Source: Billionaire’s Portfolio
This is beginning to play out according to script for the star commodity investors we talked about this summer, Leigh Goehring and Adam Rozencwajg. They’ve been wildly bullish oil calling for $75 to $110 oil. Earlier in the summer, they said “when inventory gets this low we run the risk of triple digit oil prices.” And they suspected a supply disruption could give us a sharp move higher.
Do the events in Saudi Arabia present a potential supply disruption? Earlier this year, Stratus Advisors, an energy research and consulting shop, projected potential oil-supply disruption scenarios. Among the scenarios, was “internal instability in Saudi Arabia.”
Join our Billionaire’s Portfolio subscription service today to get your portfolio in line with the most influential investors in the world, and hear more of my actionable political, economic and market analysis. Click here to learn more.
For much of the summer, while the world has been obsessed with Trump tweets, we’ve talked about the sharp but under-acknowledged move in copper and the message it was sending about the global economy and China (the biggest consumer of commodities), specifically. As I’ve said, people should Stop Watching Trump And Start Watching Copper.
Why copper? It is often an early indicator of economic cycles. People love to say copper ‘has a Ph.D. in economics’ because it tends to top early at economic peaks and bottom early at economic troughs. And it tends to lead a bull market in broader commodities.
Well, copper bottomed on January 15. Fast forward to today; the most important industrial metal in the world is up 24% on the year and sniffing back toward three-year highs. While the world continues to focus on Washington drama, this continues to be the proverbial “bell” ringing to signal a pop in economic growth is coming, and a big run for commodities investors is ripe for the taking.
With that in mind, we’ve talked in recent days again about the research from the top minds in commodities investing, Leigh Goehring and Adam Rozencwajg (managers of the commodities funds, ticker GRHIX and GRHAX). We know they like oil. In fact they think we see triple-digit oil prices by early next year.
They love the commodities trade in general. They have one of the most compelling charts I’ve seen in my 20-year career, to support the view that there is a generational bull breaking lose in commodities.
Stocks minted billionaires in the 1980s. Currencies minted billionaires in the 1990s. Tech and housing (bust) minted billionaires in the early 2000s. Then it was equity activism (stocks). The next opportunity looks like commodities.
In this chart below you can see, as Goehring and Rozencwajg say, commodities are as cheap today as they have ever been. “Only in the depths of the Great Depression and at the end of the dying Bretton Woods Gold Exchange Standard did commodities reach this level of undervaluation relative to equities.”
With this, they say, for those that can block out the noise, “there is a proverbial fortune to be made if they invest today.”
Here’s an excerpt from their most recent investor letter on their work on the stocks to commodities valuation:
“When commodities are this cheap relative to stocks, the returns accruing to commodity investors have been spectacular. For example, had an investor bought the Goldman Sachs Commodity Index (or something equivalent) in 1970, by 1974 he would have compounded his money at 50% per year. From 1970 to 1980 commodities compounded anually in price by 20%. If the same investor had bought commodities in 2000, he would have also compounded his money at 20% for the next ten years–especially attractive considering the broad stock market indicies returned nothing over the same period.”
Join our Billionaire’s Portfolio today to get your portfolio in line with the most influential investors in the world, and hear more of my actionable political, economic and market analysis. Click here to learn more.
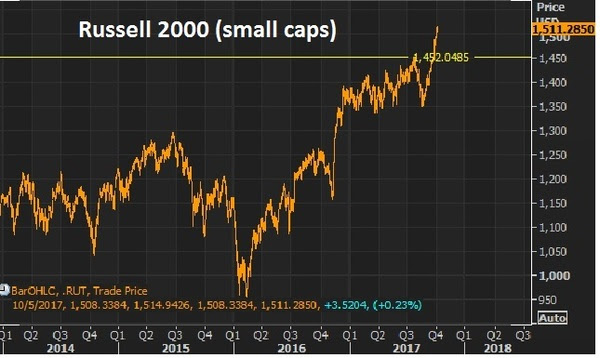
We looked at small caps last week when the the Russell 2000 broke to new highs.
Remember, at that point, small–caps had done only 9% on the year at this point. That’s against 13% for the S&P and Dow.
Here’s the chart now…
The Russell 2000 is now up 12% since the lows of August (up 11% ytd) and if you bought the small cap index on the Monday before the elections last year, you’re up 26%. But small caps continue to lag the bigger cap market. And that makes the last quarter a very intriguing opportunity to own small caps.
Bull markets tend to lift all boats. And with that, equal-dollar weighted small caps tend to outperform equal-dollar weighted large caps in bull markets (in some cases by a lot). This one (bull market) looks like plenty of room to go in that regard. And small cap companies should have more to gain from a corporate tax cut as the tend to have fewer ways to shelter income (relative to big multinationals).
Now, with that bull market assertion, let’s talk about the general uneasiness that seems to exist (and has for a while) from watching the continued climb in stocks.
As we’ve discussed, you often here the argument that the fundamentals don’t support the level of stocks. It’s just not true. The fundamental backdrop continues to justify and favor higher stocks. We have the prospects of fiscal stimulus building, which will be poured onto an already fertile economic backdrop — with low rates, cheap commodities, record consumer high credit worthiness and low unemployment.
As the old market adage goes, “bull markets are born on pessimism, grow on skepticism, mature on optimism and die on euphoria.” I don’t think anyone could argue we are currently in the state of euphoria for stocks. And as the great macro trader Paul Tudor Jones has said, “the last third of a great bull market is typically a blow-off, whereas the mania runs wild and prices go parabolic” (i.e. euphoria can last for a while).
Finally, let’s revisit this analysis from billionaire Larry Robbins on the influence of low interest rates, Fed policy and oilon markets. He says every time ONE of these (following) conditions has existed, the market has produced positive returns. Here they are:
When the 30 year bond yield begins the year below 4%, stocks go up 22.1%.
When investment grade bonds yield below 4%, stocks go up 16%.
When high yield bonds yield below 8%, stocks go up 11.6%.
When cash as a % of asset for non-financials is above 10%, stocks go up 17.6%.
When the Fed tightens 0-75 basis points in the year, stocks go up 22%.
When oil falls more than 20%, stocks go up 27.5%.
Again, his study showed that there has NEVER been a down year stocks, when any ONE of the above conditions is met.
It worked in 2015. It worked in 2016. And now, not only does ONE of these conditions exist, but ALL of these conditions are (or have been) met for 2017.
The media is giving more attention today to the potential change in power at the Fed. We talked about this on Monday. Remember, the President said last week that he expected an announcement to be made in the next two or three weeks on the future Fed Chair.
Along with any advancement on the fiscal stimulus front, the appointment of the next Fed Chair will be the most important news for markets and economy this year (though Yellen isn’t officially done until January of 2018).
Back in March I made the case for Trump ousting Yellen and hiring the Fed newbie, Neel Kashkari. Admittedly, I didn’t think Yellen would last this long. While Bernanke (the former Fed Chair) can be credited for averting a global apocalypse and keeping the patient alive, for as long as it took to bridge the gap to a real recovery. Under Yellen’s leadership, the Fed has been doing it’s best to kill the patient, at precisely the time the real recovery could be taking shape, with the assistance of fiscal stimulus finally in the works.
If the Fed continues on its path, borrowing costs (or, as importantly, the perception of where they may go) may strangle the economy before fiscal stimulus gets out of the gate. This is why I’ve said Kashkari should be the President’s best friend at the Fed. He’s the lone dissenter on the rate hiking path, and he’s been vocal about leaving monetary policy alone until the inflation data warrants a move.
Kashkari released an essay on Monday where he blames the Fed for creating its own low inflation surprise by tightening money and forecasting a tighter path for monetary policy, therefore creating a contractionary effect on the economy as consumers/businesses anticipated the negative effects of higher rates on the economy.
Guess who made this same case? Bernanke. He did so in a blog post last year, around this time. It was just as the world was spiraling into negative rates. He said the Fed shot itself in the foot by publishing an overly optimistic trajectory and timeline for normalizing rates. And that the communication alone resulted in an effective tightening.
This is why the ten year yield (still at just 2.34% after four rate hikes) is pricing in something that looks a lot more like recession than a hot economy.
With the above in mind, there has been a roster of candidates for Fed Chair floated today, which did not include Neel Kashkari. That was until word began to circulate that Jeff Gundlach, manager of the world’s biggest bond fund, said yesterday that he thinks Kashkari will get the nod, because he’s the most easy money guy. Still, it was refuted in the media that he was even a candidate.
With a Fed decision queued up for tomorrow, let’s take a look at how the rates picture has evolved this year.
The Fed has continued to act like speculators, placing bets on the prospects of fiscal stimulus and hotter growth. And they’ve proven not to be very good.
Remember, they finally kicked off their rate “normalization” plan in December of 2015. With things relatively stable globally, the slow U.S. recovery still on path, and with U.S. stocks near the record highs, they pulled the trigger on a 25 basis point hike in late 2015. And they projected at that time to hike another four times over the coming year (2016).
Stocks proceeded to slide by 13% over the next month. Market interest rates (the 10 year yield) went down, not up, following the hike — and not by a little, but by a lot. The 10 year yield fell from 2.33% to 1.53% over the next two months. And by April, the Fed walked back on their big promises for a tightening campaign. And the messaging began turning dark. The Fed went from talking about four hikes in a year, to talking about the prospects of going to negative interest rates.
That was until the U.S. elections. Suddenly, the outlook for the global economy changed, with the idea that big fiscal stimulus could be coming. So without any data justification for changing gears (for an institution that constantly beats the drum of “data dependence”), the Fed went right back to its hawkish mantra/ tightening game plan.
With that, they hit the reset button in December, and went back to the old game plan. They hiked in December. They told us more were coming this year. And, so far, they’ve hiked in March and June.
Below is how the interest rate market has responded. Rates have gone lower after each hike. Just in the past couple of days have, however, we returned to levels (and slightly above) where we stood going into the June hike.
But if you believe in the growing prospects of policy execution, which we’ve been discussing, you have to think this behavior in market rates (going lower) are coming to an end (i.e. higher rates).
As I said, the Hurricanes represented a crisis that May Be The Turning Point For Trump. This was an opportunity for the President to show leadership in a time people were looking for leadership. And it was a chance for the public perception to begin to shift. And it did. The bottom was marked in Trump pessimism. And much needed policy execution has been kickstarted by the need for Congress to come together to get the debt ceiling raised and hurricane aid approved. And I suspect that Trump’s address to the U.N. today will add further support to this building momentum of sentiment turnaround for the administration. With this, I would expect to hear a hawkish Fed tomorrow.
Join our Billionaire’s Portfolio today to get your portfolio in line with the most influential investors in the world, and hear more of my actionable political, economic and market analysis. Click here to learn more.

 After some broad selling across markets yesterday, stocks bounced back today. With that, you might expect interest rates to push up and commodities to be rising too. That was not the case, which continues the trend of the past week (or so) of odd market behavior.
 As we’ve discussed, in the post-election world (of last year) we’ve had a passing of the baton from a global economy driven by monetary policy, to a global economy driven by structural reform and fiscal stimulus.
 Into the latter part of last week, we had some indiscriminate selling in some key markets. First it was Japanese stocks that followed a new 25-year high with a 1,100 point drop. Then we had some significant selling in junk bonds and U.S. Treasuries. And then four million ounces of gold was sold in about a 10 minute period


 Oil is up over 3% today, trading up to the highest levels since June of 2015.

 For much of the summer, while the world has been obsessed with Trump tweets, we’ve talked about the sharp but under-acknowledged move in copper and the message it was sending about the global economy and China (the biggest consumer of commodities), specifically. As I’ve said, people should