Yesterday we looked at the slide in yields (U.S. market interest rates — the 10-year Treasury yield). That continued today, in a relatively quiet market.
Let’s take a look at what may be driving it.
If you take a look at the chart below, you can see the moves in yields and gold have been tightly correlated since election night: gold down, yields up.
As markets began pricing in a wave of U.S. growth policies, in a world where negative interest rates were beginning to emerge, the benchmark market-interest-rate in the U.S. shot up and global interest rates followed. The German 10-year yield swung from negative territory back into positive territory. Even Japan, the leader of global negative interest rate policy early last year, had a big reversal back into positive territory.
And as growth prospects returned, people dumped gold. And as you can see in the chart above of the “inverted price of gold,” the rising line represents falling gold prices.
Interestingly, gold has been bouncing pretty aggressively since mid December. Why? To an extent, it’s pricing in some uncertainty surrounding Trump policies. And that would also explain the slow down and (somewhat) slide in U.S. yields. In fact, based on that chart above and the gold relationship, it looks like we could see yields back below 2.10%. That would mean a break of the technical support (the yellow line) in this next chart …
Another reason for higher gold, lower yields (i.e. higher bond prices), might be the capital flight in China. Where do you move money if you’re able to get it out in China? The dollar, U.S. Treasuries, U.S. stocks, Gold.
The data overnight showed the lowest levels reached in the countries $3 trillion currency reserve stash in 6 years. That, in large part, comes from the Chinese central banks use of reserves to slow the decline of their currency, the yuan. Of course a weakening yuan only inflames U.S. trade rhetoric.
For help building a high potential portfolio for 2017, follow me in our Billionaire’s Portfolio, where you look over my shoulder as I follow the world’s best investors into their best stocks. Our portfolio more than doubled the return of the S&P 500 in 2016. You can join me here and get positioned for a big 2017.
Over the past year we’ve had a wild ride in global yields. Today I want to take a look at the dramatic swing in yields and talk about what it means for the inflation picture, and the Fed’s stance on rates.
When oil prices made the final leg lower early last year, the Japanese central bank responded to the growing deflationary forces with a surprise cut of their benchmark interest rate into negative territory.
That began the global yield slide. By mid-year, more than $12 trillion dollars with of government bond yields across the world had a negative interest rate. Even Janet Yellen didn’t close the door to the possibility of adopting NIRP (negative interest rate policies).
So investors were paying the government for the privilege of loaning it their money. You only do that when 1) you think interest rates will go even further negative, and/or 2) you think paying to park your money is the safest option available.
And when you’re a central banker, you go negative to force people out of savings. But when people think the world is dangerous and prices will keep falling, they tend to hold tight to their money, from the fear a destabilized world.
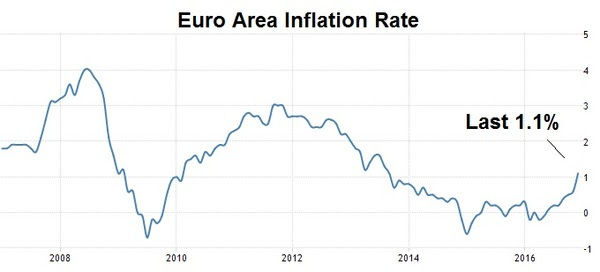
But this whole dynamic was very quickly flipped on its head with the election of a new U.S. President, entering with what many deem to be inflationary policies. But as you can see in the chart below, the U.S. inflation rate had already been recovering, and since November is now nudging closer to the Fed’s target of 2%.
Still, the expectations of much hotter U.S. inflation are probably over done. Why? Given the divergent monetary policies between the U.S. and the rest of the world, capital has continued to flow into the dollar (if not accelerated). That suppresses inflation. And that should keep the Fed in the sweet spot, with slow rate hikes.
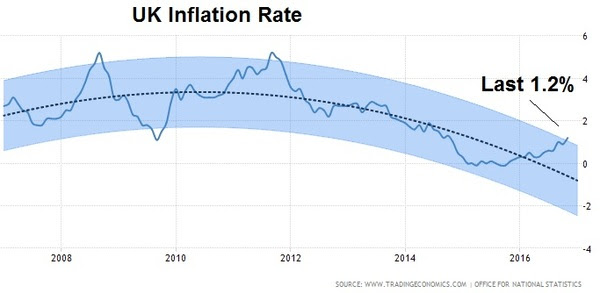
Meanwhile, there’s more than enough room for inflation to run in other developed economies. You can see in Europe, inflation is now back above 1% for the first time in three years. That, too, is in large part because of its currency. In this case, a stronger dollar has meant a weaker euro. This (along with the UK and Japan) is where the real REflation trade is taking place. And it’s where it’s needed most, because it also means growth is coming with it, finally.
You can see, following Brexit, the chart looks similar in the UK – prices are coming back, again fueled by a sharp decline in the pound, which pumps up exports for the economy.
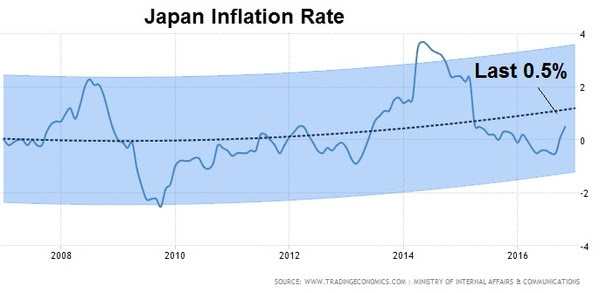
And, here’s Japan.
Japan’s deflation fight is the most noteworthy, following the administrations 2013 all-out assault to beat 2 decades of deflation. It hasn’t worked, but now, post-Trump, the stars may be aligning for a sharp recovery.
For help building a high potential portfolio, follow me in our Billionaire’s Portfolio, where you look over my shoulder as I follow the world’s best investors into their best stocks. Our portfolio more than doubled the return of the S&P 500 in 2017. You can join me here and get positioned for a big 2017.
With the Dow within a fraction of 20,000 today, and with the first week of 2017 in the books, I want to revisit my analysis from last month on why stocks are still cheap.
Despite what the media may tell you, the number 20,000 means very little. In fact, it’s amusing to watch interviewers constantly probe the experts on TV to get an anwer on why 20,000 for the Dow is meaningful. They demand an answer and they tend to get them when the lights and a camera are locked in on the interviewee.
Remember, if we step back and detach from the emotions of market chatter, speculation and perception, there are simple and objective reasons to believe the broader stock market can go much higher from current levels.
I want to walk through these reasons again for the new year.
Reason #1: To return to the long-term trajectory of 8% annualized returns for the S&P 500, the broad stock market would still need to recovery another 49% by the middle of next year. We’re still making up for the lost growth of the past decade.
Reason #2: In low-rate environments, the valuation on the broad market tends to run north of 20 times earnings. Adjusting for that multiple, we can see a reasonable path to a 16% return for the year.
Reason #3: We now have a clear, indisputable earnings catalyst to add to that story. The proposed corporate tax rate cut from 35% to 15% is estimated to drive S&P 500 earnings UP from an estimated $132 per share for next year, to as high as $157. Apply $157 to a 20x P/E and you get 3,140 in the S&P 500. That’s 38% higher.
Reason #4: What else is not factored into all of this simple analysis, nor the models of economists and Wall Street strategists? The prospects of a return of ‘animal spirits.’ This economic turbocharger has been dead for the past decade. The world has been deleveraging.
Reason #5: As billionaire Ray Dalio suggested, there is a clear shift in the environment, post President-elect Trump. The billionaire investor has determined the election to be a seminal moment. With that in mind, the most thorough study on historical debt crises (by Reinhardt and Rogoff) shows that the deleveraging of a credit bubble takes about as long as it took to build. They reckon the global credit bubble took about ten years to build. The top in housing was 2006. That means we’ve cleared ten years of deleveraging. That would argue that Trumponomics could be coming at the perfect time to amplify growth in a world that was already structurally turning. A pop in growth, means a pop in corporate earnings–and positive earnings surprises is a recipe for higher stock prices.
For these five simple reasons, even at Dow 20,000, stocks look extraordinarily cheap.
For help building a high potential portfolio, follow me in our Billionaire’s Portfolio, where you look over my shoulder as I follow the world’s best investors into their best stocks. Our portfolio more than doubled the return of the S&P 500 in 2017. You can join me here and get positioned for a big 2017.
We talked yesterday about the bad start for global markets in 2016. It was led by China. Today, it was a move in the Chinese currency that slowed the momentum in markets. Yields have fallen back. The dollar slid. And stocks took a breather.
China’s currency is a big deal to everyone. It’s the centerpiece of the tariff threats that have been levied from the U.S. President-elect. I’ve talked quite a bit about that posturing (you can see it again here: Why Trump’s Tough Talk On China May Work).
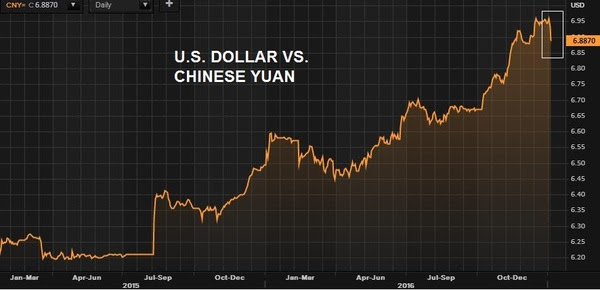
As we know, China, itself, sets the value of its currency every day. It’s called a managed float. They determine the value. And for the past two years, they’ve been walking it lower — weakening the yuan against the dollar. That’s an about face to the trend of the prior nine years. In 2005, in agreement with their major trading partners (primarily the U.S.), they began slowly appreciating their currency, in an effort to allay trade tensions, and threats of trade sanctions (tariffs).
So what happened today? The Chinese revalued its currency — pegged ithigher by a little more than a percent against the dollar. That doesn’t sound like a lot, but as you can see in the chart, it’s a big move, relative to the average daily volatility. That became big news and stoked a little bit of concern in markets, mostly because China was the sore spot at the open of last year, and the PBOC made a similar move around this time, when global marketswere spiraling.
Why did they do it? This time around, the Chinese have complained about the threat of capital flowing out of the country – it’s a huge threat to their economy in its current form. That’s where they’ve laid the blame, on the two year slide in the value of the yuan. With that, they’ve allegedly been fighting to keep the yuan stable and have been stepping up restrictions on money leaving the country. Today’s move, which included a spike in the overnight yuan borrowing rate, was a way to crush speculators that have been betting against the currency, putting further downward pressure on the currency. But it also likely Trump related – the beginning of a crawl higher in the currency as we head toward the inauguration of the new President Trump. It’s very typical for those under the gun for currency manipulation to make concessions before they meet with trade partners.
So, should we be concerned about the move today in China? No. It’s not another January 2016 moment. But the move did drive profit taking in twobig trends of the past two months: the dollar and U.S. Treasuries. With that, the first jobs report of the year comes tomorrow. It should provide more evidence that the Fed will hike a few times this year. And that should restore the climb in the dollar and in rates.
For help building a high potential portfolio, follow me in our Billionaire’s Portfolio, where you look over my shoulder as I follow the world’s best investors into their best stocks. Our portfolio more than doubled the return of the S&P 500 in 2017. You can join me here and get positioned for a big 2017.
Remember this time last year? The markets opened with a nosedive in Chinese stocks. By the time New York came in for trading, China was already down 7% and trading had been halted. That started, what turned out to be, the worst opening stretch of a New Year in the history of the U.S. stock market.
The sirens were sounding and people were gripping for what they thought was going to be a disastrous year. And then, later that month, oil slid from the mid $30s to the mid $20s and finally people began to realize it wasn’t China they should be worried about, it was oil. The oil price crash was a ticking time bomb, about to unleash mass bankruptcies on the energy industry and threaten a “round two” of global financial crisis.
What happened? Central banks stepped in. On February 11th, the Bank of Japan intervened in the currency markets, buying dollars/selling yen. What did they do with those dollars? They must have bought oil, in one form or another. Oil bottomed that day. China soon followed with a move to boost bank lending, relieving some fears of a global liquidity crunch. The ECB upped its QE program and cut rates. And then the Fed followed up by taking two of their projected four rate hikes off of the table (of which they ended up moving just once on the year).
What a difference a year makes.
There’s a clear shift in the environment, away from a world on liquidity-driven life support/ and toward structural, growth-oriented change.
With that, there’s a growing sense of optimism in the air that we haven’t seenin ten years. Even many of the pros that have constantly been waiting for the next “shoe to drop” (for years) have gone quiet.
Global markets have started the year behaving very well. And despite the near tripling from the 2009 bottom in the stock market, money is just in the early stages of moving out of bonds and cash, and back into stocks. Following the election in November, we are coming into the year with TWO consecutive record monthly inflows into the U.S. stock market based on ETF flows from November and December.
The tone has been set by U.S. markets, and we should see the rest of the world start to play catch up (including emerging markets). But this development was already underway before the election.
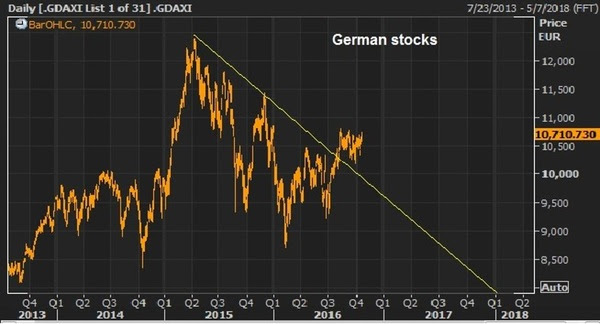
Remember, I talked about European stocks quite a bit back in October. While U.S. stocks have soared to new record highs, German stocks have lagged dramatically and have offered one of the more compelling opportunities.
Here’s the chart we looked at back in October, where I said “after being down more than 20% earlier this year, German stocks are within 1.5% of turning green on the year, and technically breaking to the upside“…
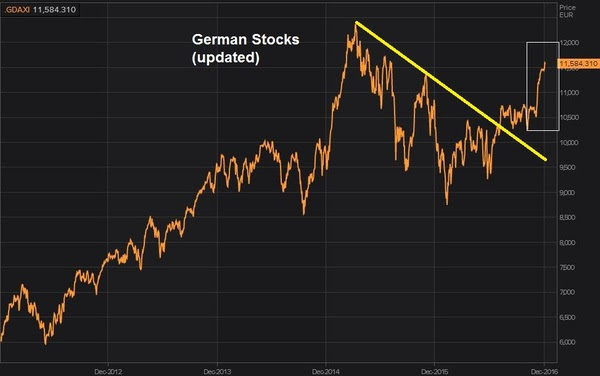
And here’s the latest chart…
You can see, as you look to the far right of the chart, it’s been on a tear. Adding fuel to that fire, the eurozone economic data is beginning to show signs that a big bounce may be coming. A pop in U.S. growth would only bolster that.
And a big bounce back in euro zone growth this year would be a very valuabledefense against another populist backlash against the establishment (first Grexit, then Brexit, then Trump). Nationalist movements in Germany and France are huge threats to the EU and euro (the common currency). Another round of potential break-up of the euro would be destabilizing for the global economy.
With that, as we enter the year with the ammunition to end the decade long economy rut, there are still hurdles to overcome. Along with Trump/China frictions, the French and German elections are the other clear and present dangers ahead that could dull the efficacy of Trumponomics.
For help building a high potential portfolio, follow me in our Billionaire’s Portfolio, where you look over my shoulder as I follow the world’s best investors into their best stocks. Our portfolio more than doubled the return of the S&P 500 in 2017. You can join me here and get positioned for a big 2017.
The markets are sitting on Apple earnings, which will come after the close today (by the time you read this).
We’ve been talking about the quiet move in currencies, some commodities and some foreign stock markets.
Given that the dollar is looking like another (maybe big) run is in store, which means much lower euro and much lower yen (and higher German and Japanese stock markets, as we’ve discussed), what does a higher dollar mean for commodities?
Commodities have, of course, been crushed throughout this post financial crisis period. And earlier this year, oil was the most recent mass declining commodity. That was after an initial collapse in 2008, and a sharp recovery from 2009 through much of 2014. But then of course, it came crashing back to earth to revisit the deeply depressed levels of most other commodities, following OPEC refusal to cut production back in late 2014.
So, we’ve talked about the importance of oil. Cheap oil had all of the ingredients to be even more destructive to the global economy than the credit bubble burst (and housing bust). But it’s out of the danger zone now, at around $50, and the outlook is bullish, given the supply dynamics and given that OPEC is prepared to cut for the first time in eight years.
So this begs the question: If the dollar is strengthening, and may continue to strengthen, isn’t that bad for commodities? And therefore, isn’t that bad news for the oil price recovery?
The mainstream financial media usually is very quick to attribute moves in commodities to an inverse move in the dollar (and vice versa). On the surface, it’s a logical enough argument. After all, commodities like gold, oil, and grains are all priced in dollars.
Therefore, if the dollar weakens the value of the commodity shouldn’t be penalized. With that logic, it should strengthen to maintain its value on the global stage.
So all things remaining equal, the commodity should move in the directly proportional opposite direction of the dollar.
The only problem with this argument is that all things never remain equal …
So is there a legitimate price relationship between the dollar and commodities? Or is it just market fodder to attempt to explain and justify the market activity?
That depends on the time period you look at …
For example, from December 1998 to September 2000 the relationship of oil and the dollar was positive, as shown in the chart below. When one went up, the other went up.
On the other hand, from 2006 to 2009, the relationship was been negative. Take a look at the following chart: When oil was crashing, the dollar was rising sharply. And toward the far right of the chart, oil recovered and the dollar fell.
Of course, these are just two isolated periods of time that I’ve used here to demonstrate exact opposite relationships.
However, over longer periods the influence of the dollar on oil, or oil on the dollar, is found to have NO statistical significance. There’s not a significant positive or negative correlation. Consequently, statisticians would conclude that the dollar and oil have nothing to do with one another.
So there is no reason to believe oil can’t continue its strong recovery, and do so in an environment when the Fed is moving in the opposite directions of other major central banks, providing fuel for a much higher dollar.
Click here to get started and get your portfolio in line with our Billionaire’s Portfolio.
As you might recall, since I’ve written this daily note starting in January, I’ve focused on a few core themes.
First, central banks are in control. They’ve committed trillions of dollars to manufacture a recovery. They’ve fired arguably every bullet possible (“whatever it takes”). And for everyone’s sake, they can’t afford to see the recovery derail – nor will they. With that, they need stocks higher. They need the housing recovery to continue. They need to maintain the consumer and growing business confidence that they have manufactured through their policies.
A huge contributor to their effort is higher stocks. And higher stocks only come, in this environment, when people aren’t fearing another big shock/ big shoe to drop. The central banks have promised they won’t let it happen. To this point, they’ve made good on their promise through a number of unilateral and coordinated defensive maneuvers along the way (i.e. intervening to quell shock risks).
The second theme: As the central banks have been carefully manufacturing this recovery, the Fed has emerged with the bet that moving away from “emergency policies” could help promote and sustain the recovery. It’s been a tough road on that front. But it has introduced a clear and significant divergence between the Fed’s policy actions and that of Japan, Europe and much of the rest of the world. That creates a major influence on global capital flows. The dollar already benefits as a relative safe parking place for global capital, especially in an uncertain world. Add to that, the expectation of a growing gap between U.S. yields and the rest of the world, and more and more money flows into the dollar… into U.S. assets.
With that in mind, this all fuels a higher dollar and higher U.S. asset prices. And when a dollar-denominated asset begins to move, it’s more likely to attract global speculative capital (because of the dollar benefits).
With that in mind, let’s ignore all of the day to day news, which is mostly dominated by what could be the next big threat, and take an objective look at these charts.
U.S. Stocks
Clearly the trend in stocks since 2009 is higher (like a 45 degree angle). Since that 2009 bottom in stocks, we’ve had about 4 higher closes for every 1 lower close on a quarterly basis. That’s a very strong trend and we’ve just broken out to new highs last quarter (above the white line).
U.S. Dollar
This dollar chart shows the distinct effect of divergent global monetary policy and flows to the dollar. You can see the events annotated in the chart, and the parabolic move in the dollar. Any positive surprises in U.S. economic data as we head into the year end will only drive expectations of a wider policy gap — good for a higher dollar.
Oil
We looked at this breakout in oil last week after the OPEC news. Oil traded just shy of $50 today. That’s 17% higher since September 20th.
Oil trades primarily in dollars. And we have a catalyst for higher oil now that OPEC has said it will make the first production cut in eight years. That makes oil a prime spot for speculative capital (more “fuel” for oil). And as we’ve discussed in recent days, weeks and months… higher oil, given the oil price bust that culminated earlier this year, is good for stocks, and good for the economy.
What’s the anti-dollar trade? Gold. As we discussed yesterday, gold has broken down.
If we keep it simple and think about this major policy divergence, we have plenty of reasons to believe a higher dollar and higher stocks will continue to lead the way.
The Billionaire’s Portfolio is up 23% year-to-date — that’s nearly four times the return of the S&P 500 during the same period. We recently exited a big FDA approval stock for a quadruple, and we’ve just added a new pick to the portfolio — following Warren Buffett into one of his favorite stocks. If you haven’t joined yet, please do. Click here to get started and get your portfolio in line with our Billionaire’s Portfolio
Stocks continue to chop around as we head into the big jobs report this week. But the dollar has been a mover today, so has gold.
Let’s take a look at the chart of gold. It has broken down technically.
You can see the longer term downtrend in gold since it topped out in 2011. And we’ve had a corrective bounce this year, which was contained by this descending trendline. And today we broke the trend that describes this bullish technical correction (i.e. the trend continues lower).
A lot of people own gold. And it’s a very emotional trade. Whenever I talk about negative scenarios for gold, the hate mail is sure to follow.
We’ve talked quite a bit about the drivers of the gold trade. I want to revisit that today.
Gold has been a core trade for a lot of people throughout the crisis period. When Lehman failed in 2008, it shook the world, global credit froze, banks were on the verge of collapse, the global economy was on the brink of implosion—people ran into gold. Gold was a fear–of–the–unknown–outcome trade.
Then the global central banks responded with massive backstops, guarantees, and unprecedented QE programs. The world stabilized, but people ran faster into gold. Gold became a hyperinflation–fear trade.
Gold went on a tear from sub–$700 bucks to over $1,900 following the onset of global QE (led by the Fed).
Gold ran up as high as 182%. That was pricing in 41% annualized inflation at one point (as a dollar for dollar hedge). Of course, inflation didn’t comply.
Still eight years after the Fed’s first round of QE (and massive global responses), we have just 13% cumulative inflation over the period.
So the gold bugs overshot in a big way. We’ve looked at this next chart a few times over the past several months. This tells the story on why inflation hasn’t met the expectations of the “run-away inflation” theorists.
This chart above is the velocity of money. This is the rate at which money circulates through the economy. And you can see to the far right of the chart, it hasn’t been fast. In fact, it’s at historic lows. Banks used cheap/free money from the Fed to recapitalize, not to lend. Borrowers had no appetite to borrow, because they were scarred by unemployment and overindebtedness. Bottom line: we get inflation when people are confident about their financial future, jobs, earning potential…and competing for things, buying today, thinking prices might be higher, or the widget might be gone tomorrow. It’s been the opposite for the past eight years.
When this reality of low-to-no inflation and global economic malaise became clear, even after rounds of Fed QE, there were a LOT of irresponsible people continuing to tout gold as an important place in everyone’s portfolio, even at stratospheric levels. People bought gold at $1900 and have since lost as much as 40% on the value of their investment – an investment that was supposed to “hedge” against inflation.
On that note, today the IMF downgraded U.S. growth estimates for the year from 2.2% to just 1.6% — in a year that many were initially expecting to be a good year, nearing trend growth levels (3%-3.5%). So eight years from the inception of the Fed’s extraordinary policies, the case for gold remains weak and an investment with more risk than reward.
The Billionaire’s Portfolio is up 23% year-to-date — that’s nearly four times the return of the S&P 500 during the same period. We recently exited a big FDA approval stock for a quadruple, and we’ve just added a new pick to the portfolio — following Warren Buffett into one of his favorite stocks. If you haven’t joined yet, please do. Click here to get started and get your portfolio in line with our Billionaire’s Portfolio.
Yesterday we talked about the bullish technical breakout shaping up in stocks. Today we want to talk about a very quiet bull market going on that supports the story for stocks. It’s commodities.
Within the course of the past four short months, commodities have gone being the leading threat for global stocks, to being a leading indicator of an emerging bull cycle for stocks.
Oil, of course, was the key culprit earlier in the year. At $26 oil the world was a scary place. The dominoes were lining up for widespread bankruptcies, starting in the energy complex and spreading to financials, sovereigns, etc.
If you recall, back in early February we said in our daily notes, “OPEC is not just in a price war with U.S. shale producers, but it’s playing a game of chicken with the global economy. We’ve had plenty of events over the past seven years that have shaken confidence and have given markets a shakeup – European sovereign debt, Greece potentially leaving the euro, among them. In Europe, we clearly saw the solution. It was intervention. Oil prices are creating every bit as big a threat as Europe was, we expect intervention to be the solution this time as well.”
Indeed, central banks stepped in and removed the risk with a slew of intervention tactics ranging from more QE from Europe, currency intervention from Japan, relaxing reserve requirements in China, to the Fed removing the prospects of two (of what was projected to be four) rate hikes this year.
That was the dead bottom in oil (which started with BOJ action in USDJPY). And it kicked broader commodities into gear, many of which had already bottomed weeks prior. No surprise, commodity stocks have been among the best performing stocks in the world for the past four months.
Now we have oil closing above $50 today, for the first time since July of last year. And remember, two of the best oil traders of all time have been calling for oil to trade between $80 and $100 by next year (both Pierre Andurand and Andy Hall).
We looked at this chart in our April 12th piece and said: “technically, oil looks like a technical breakout is here. In the above chart, you can see oil breaking above the high of March 22 (which was $41.90). In fact, we get a close above that level — technically bullish. And we also now have a technically bullish pattern (an impulsive C–wave of an Elliott Wave structure) that projects a move to $51.50, which happens to be right about where this big trendline comes in.”
You can see we’ve not only hit this trendline and gotten very close to that projection from April, but (not as easy to see in this chart) we have a clear break of this downtrend now. That line now comes in at $49.39. Oil last traded $50.49.
Next is a look at broader commodities. But first, we want to revisit the clues we were getting from commodities back in early March. Here’s what we said in our March 3rd note: “There are other very compelling signs that the global economy is not only backing away from the edge but maybe turning the corner.
It’s all being led by metals prices. Copper is often an early indicator of economic cycles. People love to say copper has ‘has a Ph.D. in economics’ because it tends to top early at economic peaks and bottom early at economic troughs. Copper bottomed on January 15 and is up 13% since.
The value of iron ore, another key industrial metal, has been destroyed in the past five years – down 80%. That metal bottomed quietly in December and is up 32% since.”
The Goldman Sachs commodity index is now up 44% from the bottom, though it’s heavily weighted energy. The more diversified CRB index is up 24%. Both would fall into the bull market category for those that like to define bull and bear markets. But bottom line, when you look at the above chart you can see how deeply depressed commodities have been. The trend is broken, and the model signals for big trend followers are flashing all over the place to be long. And as we said yesterday, in early stages of cyclical bull trends in stocks, energy does the best by far. With that, although the energy sector weathered a life threatening storm, the upside remains very big for the survivors.
This Stock Could Triple This Month
In our Billionaire’s Portfolio we followed the number one performing hedge fund on the planet into a stock that has the potential to triple by the end of the month.
This fund returned an incredible 52% last year, while the S&P 500 was flat. And since 1999, they’ve done 40% a year. And they’ve done it without one losing year. For perspective, that takes every $100,000 to $30 million.
We want you on board. To find out the name of this hedge fund, the stock we followed them into, and the catalyst that could cause the stock to triple by the end of the month, click here and join us in our Billionaire’s Portfolio.
We make investing easy. We follow the guys with the power and the influence to control their own destiny – and a record of unmatchable success. And you come along for the ride.
Gold has been a core trade for a lot of people throughout the crisis period. When Lehman failed in 2008, it shook the world, global credit froze, banks were on the verge of collapse, the global economy was on the brink of implosion – people ran into gold. Gold was a fear-of-the-unknown-outcome trade.
Then the global central banks responded with massive backstops, guarantees, and unprecedented QE programs. The world stabilized, but people ran faster into gold. Gold became a hyperinflation-fear trade.
In the chart above, you can see gold went on a tear from sub-$700 bucks to over $1,900 following the onset of global QE (led by the Fed).
Gold ran up as high as 180%. That was pricing in 41% annualized inflation at one point (as a dollar for dollar hedge). Of course, inflation didn’t comply. Still eight years after the Fed’s first round of QE (and massive global responses), we have just 13% cumulative inflation over the period.
So the gold bugs overshot in a big way.
Why? The next chart tells the story…
This chart above is the velocity of money. This is the rate at which money circulates through the economy. And you can see to the far right of the chart, it hasn’t been fast. In fact, it’s at historic lows. Banks used cheap/free money from the Fed to recapitalize, not to lend. Borrows had no appetite to borrow, because they were scarred by unemployment and overindebtedness. Bottom line: we get inflation when people are confident about their financial future, jobs, earning potential … and competing for things, buying today, thinking prices might be higher, or the widget might be gone tomorrow. It’s been the opposite for the past eight years.
After three rounds of Fed QE, and now mass scale QE from the BOJ and the ECB, the world is still battling DE-flationary pressures. If gold surged from sub-$700 to $1,900 on Fed/QE-driven hyperinflation fears, and QE has produced little to no inflation, it’s fair to think we can return to pre-QE levels. That’s sub-$700.
We head into the weekend with stocks down 3% for the month. This follows a bad January. In fact, the stock market is working on a fifth consecutive negative month. The likelihood, however, of it finishing down for February is very low. It’s only happened 18 times since 1928. So the S&P 500 has five consecutive losing months just 1.7% of the time, historically.