With Thanksgiving behind us, we a few key events ahead for markets before we can put a bow on things and call it a year.
As things stand, the S&P 500 is up around 8%, right in line with the long term average return (less dividends). Yields are around 2.3%. That’s right about where we left off at the end of 2015 (following the Fed’s first move higher on rates since the crisis).
We may find a round trip for oil as well before the year it over. On Wednesday, we’ll finally hear from OPEC on a production cut. Remember, it was late September when we were told that the Saudis were finally on board for a production cut, to get oil prices higher and to stop the bleeding in the oil revenue dependent OPEC economies.
As we’ve discussed, it was Saudi Arabia that blocked a cut on
Thanksgiving day evening two years ago. And that sent oil into a spiral from $70 to as low as $26. Importantly, cheap oil has not only represented a threat to global economic stability but it’s been deflationary. The threat to stability and the deflationary pressure is what has kept the Fed on the sidelines, reversing course on their rate hike projections for this year, and then, conversely, becoming progressively more and more dovish since March.
You can see in this graphic from the Fed last December (2015) after they decided to hike for the first time coming out of the crisis period.
Source: Fed
The majority view from Fed members was an expectation that the Fed funds rate would be about 1.375% at this point in th year (2016). As we know, it hasn’t happened. As of two months ago, the Fed was expecting rates to be at just 1.00% by the end next year.
This makes this week’s OPEC decision even more important, given the market’s and Fed’s expectations on the path of monetary policy at this point.
If OPEC does as they’ve indicated they will do this week, by announcing the first production cut in oil in eight years, it could send the price of oil back to levels of two years ago — when the oil price bust was started that Thanksgiving day. That’s $70.
And $70 oil would play a huge role in where rates go next year, in the U.S., and in Europe and Japan. The inflationary pressures of $70 oil could put the Fed back on a path to hike three to four times in the coming year (as they intended coming into 2016). And it could create the beginning of taper talk in Europe and Japan.
If we consider that possibility, it makes for a remarkably dramatic change in the global economic outlook in just five weeks (since the Nov 8 election). As Paul Tudor Jones, one of the great macro traders of all-time, has said: “the very best money is made at the market turns. Everyone says you get killed trying to pick tops and bottoms and you make all your money by playing the trend in the middle. Well for twelve years I have been missing the meat in the middle but I have made a lot of money at tops and bottoms.” An OPEC move should cement the top in bonds.
We may be entering an incredible era for investing. An opportunity for average investors to make up ground on the meager wealth creation and retirement savings opportunities of the past decade, or more. For help, follow me in my Billionaire’s Portfolio, where you look over my shoulder as I follow the world’s best investors into their best stocks. Our portfolio is up 24% year to date. That’s more than three times the performance of the broader stock market. Join me here.
I talked last week about the move in oil, and the lag in natural gas.
But natural gas was knocking on the door of a technical breakout. As you can see, that breakout looks to be underway now.
Nat gas is now at $3.25. If history is any indication, it could be in the low $4s soon.
That’s helped by chatter today from OPEC members out vocally supporting the production cut that was agreed to two weeks ago. And the Secretary General of OPEC piled on today by saying the sharp contraction in investments (due to low prices) poses a threat to global oil supply. As we’ve discussed, for those that had the “oil price to zero” arguments earlier in the year, supply changes, so does demand.
With all of this, oil continues to climb higher, testing the June highs today. Here’s another look at the chart.
A break above the June highs of $51.67 would project a move to near $65 (technically speaking, it’s a C-wave). Another big technical level above is $68.60, which is the 61.8% retracement of the move down from almost $95 in late 2014, to the lows of earlier this year. That’s the breakdown in oil prices driven by OPEC’s 2014 refusal to cut production. And now were on the verge of getting the first cut in eight years. So oil is looking like higher levels are coming — it was up another 3% today.
What’s does it mean for stocks? As we’ve discussed, for much of the year, lower oil has meant lower stocks, and higher oil has meant higher stocks.
This emerging bullish technical and fundamental backdrop for energy should be very good for stocks. Remember, higher energy prices, in this environment, removes the risk of another oil price shock-to-sentiment (good for stocks, good for the economy). And it means producers can start producing again, downstream businesses can fill capacity, and we can start seeing some of the hundreds of thousands of U.S. jobs replenished that have been lost over the past two years.
Since OPEC rigged lower oil prices back in late 2014, we’ve had over 100 North American energy company bankruptcies. Some of those have/are reorganizing and emerging with lean balance sheets into what could be a hot recovery in energy prices. I’ll talk about some tomorrow.
The Billionaire’s Portfolio is up 23% year-to-date — that’s nearly four times the return of the S&P 500 during the same period. We recently exited a big FDA approval stock for a quadruple, and we’ve just added a new pick to the portfolio — following Warren Buffett into one of his favorite stocks. If you haven’t joined yet, please do. Click here to get started and get your portfolio in line with our Billionaire’s Portfolio.
As you might recall, since I’ve written this daily note starting in January, I’ve focused on a few core themes.
First, central banks are in control. They’ve committed trillions of dollars to manufacture a recovery. They’ve fired arguably every bullet possible (“whatever it takes”). And for everyone’s sake, they can’t afford to see the recovery derail – nor will they. With that, they need stocks higher. They need the housing recovery to continue. They need to maintain the consumer and growing business confidence that they have manufactured through their policies.
A huge contributor to their effort is higher stocks. And higher stocks only come, in this environment, when people aren’t fearing another big shock/ big shoe to drop. The central banks have promised they won’t let it happen. To this point, they’ve made good on their promise through a number of unilateral and coordinated defensive maneuvers along the way (i.e. intervening to quell shock risks).
The second theme: As the central banks have been carefully manufacturing this recovery, the Fed has emerged with the bet that moving away from “emergency policies” could help promote and sustain the recovery. It’s been a tough road on that front. But it has introduced a clear and significant divergence between the Fed’s policy actions and that of Japan, Europe and much of the rest of the world. That creates a major influence on global capital flows. The dollar already benefits as a relative safe parking place for global capital, especially in an uncertain world. Add to that, the expectation of a growing gap between U.S. yields and the rest of the world, and more and more money flows into the dollar… into U.S. assets.
With that in mind, this all fuels a higher dollar and higher U.S. asset prices. And when a dollar-denominated asset begins to move, it’s more likely to attract global speculative capital (because of the dollar benefits).
With that in mind, let’s ignore all of the day to day news, which is mostly dominated by what could be the next big threat, and take an objective look at these charts.
U.S. Stocks
Clearly the trend in stocks since 2009 is higher (like a 45 degree angle). Since that 2009 bottom in stocks, we’ve had about 4 higher closes for every 1 lower close on a quarterly basis. That’s a very strong trend and we’ve just broken out to new highs last quarter (above the white line).
U.S. Dollar
This dollar chart shows the distinct effect of divergent global monetary policy and flows to the dollar. You can see the events annotated in the chart, and the parabolic move in the dollar. Any positive surprises in U.S. economic data as we head into the year end will only drive expectations of a wider policy gap — good for a higher dollar.
Oil
We looked at this breakout in oil last week after the OPEC news. Oil traded just shy of $50 today. That’s 17% higher since September 20th.
Oil trades primarily in dollars. And we have a catalyst for higher oil now that OPEC has said it will make the first production cut in eight years. That makes oil a prime spot for speculative capital (more “fuel” for oil). And as we’ve discussed in recent days, weeks and months… higher oil, given the oil price bust that culminated earlier this year, is good for stocks, and good for the economy.
What’s the anti-dollar trade? Gold. As we discussed yesterday, gold has broken down.
If we keep it simple and think about this major policy divergence, we have plenty of reasons to believe a higher dollar and higher stocks will continue to lead the way.
The Billionaire’s Portfolio is up 23% year-to-date — that’s nearly four times the return of the S&P 500 during the same period. We recently exited a big FDA approval stock for a quadruple, and we’ve just added a new pick to the portfolio — following Warren Buffett into one of his favorite stocks. If you haven’t joined yet, please do. Click here to get started and get your portfolio in line with our Billionaire’s Portfolio
Yesterday we talked about the bullish technical breakout shaping up in stocks. Today we want to talk about a very quiet bull market going on that supports the story for stocks. It’s commodities.
Within the course of the past four short months, commodities have gone being the leading threat for global stocks, to being a leading indicator of an emerging bull cycle for stocks.
Oil, of course, was the key culprit earlier in the year. At $26 oil the world was a scary place. The dominoes were lining up for widespread bankruptcies, starting in the energy complex and spreading to financials, sovereigns, etc.
If you recall, back in early February we said in our daily notes, “OPEC is not just in a price war with U.S. shale producers, but it’s playing a game of chicken with the global economy. We’ve had plenty of events over the past seven years that have shaken confidence and have given markets a shakeup – European sovereign debt, Greece potentially leaving the euro, among them. In Europe, we clearly saw the solution. It was intervention. Oil prices are creating every bit as big a threat as Europe was, we expect intervention to be the solution this time as well.”
Indeed, central banks stepped in and removed the risk with a slew of intervention tactics ranging from more QE from Europe, currency intervention from Japan, relaxing reserve requirements in China, to the Fed removing the prospects of two (of what was projected to be four) rate hikes this year.
That was the dead bottom in oil (which started with BOJ action in USDJPY). And it kicked broader commodities into gear, many of which had already bottomed weeks prior. No surprise, commodity stocks have been among the best performing stocks in the world for the past four months.
Now we have oil closing above $50 today, for the first time since July of last year. And remember, two of the best oil traders of all time have been calling for oil to trade between $80 and $100 by next year (both Pierre Andurand and Andy Hall).
We looked at this chart in our April 12th piece and said: “technically, oil looks like a technical breakout is here. In the above chart, you can see oil breaking above the high of March 22 (which was $41.90). In fact, we get a close above that level — technically bullish. And we also now have a technically bullish pattern (an impulsive C–wave of an Elliott Wave structure) that projects a move to $51.50, which happens to be right about where this big trendline comes in.”
You can see we’ve not only hit this trendline and gotten very close to that projection from April, but (not as easy to see in this chart) we have a clear break of this downtrend now. That line now comes in at $49.39. Oil last traded $50.49.
Next is a look at broader commodities. But first, we want to revisit the clues we were getting from commodities back in early March. Here’s what we said in our March 3rd note: “There are other very compelling signs that the global economy is not only backing away from the edge but maybe turning the corner.
It’s all being led by metals prices. Copper is often an early indicator of economic cycles. People love to say copper has ‘has a Ph.D. in economics’ because it tends to top early at economic peaks and bottom early at economic troughs. Copper bottomed on January 15 and is up 13% since.
The value of iron ore, another key industrial metal, has been destroyed in the past five years – down 80%. That metal bottomed quietly in December and is up 32% since.”
The Goldman Sachs commodity index is now up 44% from the bottom, though it’s heavily weighted energy. The more diversified CRB index is up 24%. Both would fall into the bull market category for those that like to define bull and bear markets. But bottom line, when you look at the above chart you can see how deeply depressed commodities have been. The trend is broken, and the model signals for big trend followers are flashing all over the place to be long. And as we said yesterday, in early stages of cyclical bull trends in stocks, energy does the best by far. With that, although the energy sector weathered a life threatening storm, the upside remains very big for the survivors.
This Stock Could Triple This Month
In our Billionaire’s Portfolio we followed the number one performing hedge fund on the planet into a stock that has the potential to triple by the end of the month.
This fund returned an incredible 52% last year, while the S&P 500 was flat. And since 1999, they’ve done 40% a year. And they’ve done it without one losing year. For perspective, that takes every $100,000 to $30 million.
We want you on board. To find out the name of this hedge fund, the stock we followed them into, and the catalyst that could cause the stock to triple by the end of the month, click here and join us in our Billionaire’s Portfolio.
We make investing easy. We follow the guys with the power and the influence to control their own destiny – and a record of unmatchable success. And you come along for the ride.
Yesterday, SandRidge Energy was yet another energy company to file for bankruptcy this year. Many hear bankruptcy news and think of failed companies. But in plenty of cases, it’s more about opportunism than it is about desperate last acts.
Before we talk about the SandRidge story, we want to give some bigger picture context.
As we discussed a few months ago, the oil price bust, while many thought would be a positive for the economy, because it puts a few bucks in the pockets of consumers, has actually been a huge net negative, because it has brought the energy industry to its knees.
If oil stayed at $26, the shale industry in the America would be done. All of the associated businesses (transportation, logistics, refining, housing, marketing, etc.) – done. Hundreds of thousands of jobs were lost already, and probably millions would have followed. Guess who lends money to the energy sector? Banks. The financial system would once again have been in widespread crisis.
Oil producing countries like Venezuela and Russia would have defaulted. When a biggie like Russia goes, it has systemic ramifications. That event would have likely pulled the leg out from under the teetering European debt crisis chair. From there, Greece would have gone, and Italy and Spain would have probably defaulted. The European Monetary Union would have then finally succumbed to the unmanageable weight of the crisis.
To sum up, cheap oil would have been far worse than the sub-prime crisis. And this time, central banks and governments would have had no ammunition to fight it.
But, central banks stepped in to remove the “cheap oil” risk. The Bank of Japan intervened in the currency markets, and oil bottomed that day. China followed by ramping up bank lending. And Chinese institutions have been big buyers of commodities since. Then the ECB rolled out bigger and bolder QE. And the Fed removed two projected rate hikes from the table. All of this coordinated to directly or indirectly put a floor under oil. Today, oil is up 85% from levels of just three months ago.
So this begs the question: Why is an energy company like SandRidge, a company that has been surviving through the decline in oil prices, cutting production/cutting jobs, now filing bankruptcy? This is AFTER oil has bounced 85% and oil supply has just swung from a surplus to a deficit. And some of the best oil traders in the world are projecting oil prices back around $80 by the end of the year. Why would they throw in the towel now and not in February?
Back in February, SandRidge management missed a debt payment, opting to exercise a 30-day grace period. It was at that stage that the ultimate negotiation should have come with debt holders. Option 1): Restructure debt and perhaps dilute current shareholders by offering debt holders common shares. That gives the company time to ride out the storm of the oil price bust. And it gives all stakeholders a chance to see much better days. Option 2): Close the doors and liquidate assets, and creditors get cents on the dollar.
Instead, SandRidge management and directors negotiated more runway so that they could get to Option 3): the homerun lottery ticket.
In this option, oil prices recover and the company can begin producing profitably again, and brighter days are ahead. But if they rush to file Chapter 11 bankruptcy, while the business fundamentals remain depressed, they can win big. By swapping new stock for debt, the company gets freed of the noose of debt, and the debt holders exchange a piece of paper that was once worth pennies on the dollar, for common stock in a super-charged debt-free company.
That sounds like a win-win. The company continues to operate as normal. Management and the board keep their jobs (and likely their golden parachutes). And former debt holders can make a lot of money.
Who pays the price? Shareholders (the owners). Old shareholders of SandRidge stock have no say in the collusion between SandRidge leadership and creditors. So the owners of the company have their interests effectively stolen by a backroom deal and given to debt holders. And within the bankruptcy laws of Chapter 11, shareholders have no leverage. But who are some of the biggest and most effected shareholders? Employees.
SandRidge has over 1,000 employees. Let’s assume that, like many publicly traded companies, employees of SandRidge have been incentivized to buy company stock as part of their 401k plan (common practice). They have already seen their stock go from $80 to pennies. But now, as an insult to injury, they will continue working to enrich new shareholders while their board of directors have chosen to wipe out their interests.
And sadly, the common stock of companies like SandRidge (which was one of the most shorted stocks on the NYSE) are often shorted heavily by those that own the debt, in efforts to drive the company into Chapter 11, so that they can orchestrate precisely what’s happening today. The stock price gets cheap, then delisted from a major exchange, then credit ratings get downgraded, then banks cut credit lines, and voila, the company find itself in a liquidity crunch and turns to restructurings.
A huge factor in this “homerun option” for the board and creditors is for the company to continue operating as normal. If employees in this Chapter 11 situation would strike, maybe shareholders could have a seat at the negotiating table when these “pre-arranged” reorganization deals are cut. Still, that’s the leverage they hold to derail such a deal.
Consider this: In the depths of the real estate bust, billionaire activist investor Bill Ackman stepped in and bought beaten down shares of General Growth Properties, a company in bankruptcy because it couldn’t access credit. The company had strong assets and strong cash flow (as does SandRidge), but was dependent on a functioning credit market, which was broken at the time. As the largest shareholder, he battled in the board room for the shareholder. He helped management access liquidity and he convinced all stake holders that keeping equity holders intact would result in the biggest outcome for everyone. He was right, and when the credit markets recovered, GGP shares went from 20 cents to over $20 a share.
Join us here to get all of our in-depth analysis on the bigger picture, and our carefully curated stock portfolio of the best stocks that are owned by the world’s best investors.
We talked this week about the way markets are set up for a significant positive perception shift. It’s been led by oil, which had its third consecutive close above $40 today. Yields are another key brick in the foundation that may be laid tomorrow.
As oil prices have been a threat to the global economic and stability outlook over the past few months, yields have also been sending a negative signal to markets. The yield on the German 10-year got very close to the all-time lows this week, inching closer to the zero line (and negative territory). And U.S. 10-year yields, following the Fed’s last meeting, have fallen back from 2% down to as low as 1.68% — just 30 basis points above the all-time low of July 2012, when Europe was on the edge of a sovereign debt blow-up. And remember, this is AFTER the Fed has raised rates for the first time in nine years.
So yields have been signaling an uglier path forward, if not deflation forever in places like Japan and Europe. Of course, the move by Japan to negative interest rates in January was a strong contributor to the perception swoon about the global economy. But a key component in Japan’s move, and in the coordinated actions by central banks over the past two months, has been the threat from the oil price bust. And that is now on the mend. Oil is up 58% from its February low.
Still, global yields are hanging around at the lows.
Tomorrow we get euro zone and U.S. inflation data. As we’ve said, when expectations and perception has been ratcheted down so dramatically, we can get an asymmetric outcome. Earnings expectations are in the gutter. Economic growth expectations are in the gutter. Same can be said for expectations on the outlook for inflation data. In a normal world, hotter than expected inflation is a bad signal for the risk-taking environment. In our current world, hotter than expected inflation would not be a good signal, it would be a very good signal. It would show the economy has a pulse.
Yields in the two key government bond markets are set up nicely for a bottom on some hotter inflation data.
Tuesday, German yields touched 7.5 basis points. Remember, earlier in the month we talked about what happened the last time German yields were this low.
Bond kings Bill Gross and Jeffrey Gundlach said it was crazy. Bill Gross called the German bund the “short of a lifetime” (short bonds, which equates to a bet that yields go higher). He compared it to the opportunity when George Soros broke the Bank of England and made billions shorting the British pound. Gundlach said it was a trade with almost no upside and unlimited downside.
They were both right. In the chart below you can see the explosive move in German rates (in blue) away from the zero line. In the chart below, you can see the 10-year German bond yields moved from 5 basis points to 106 basis points in less than two months — a 20x move. U.S. 10 year yields (the purple line) moved from 1.72% to 2.49% almost in lock-step.
On the move down on Tuesday, the yield on the German bund reversed sharply and put in a bullish outside day (a key reversal signal). Could it have been the bottom into tomorrow’s inflation data?
Coincidentally, the U.S. 10-year looks like a bottom may be in as well.
U.S. yields have a chance to break this downtrend tomorrow on a hotter inflation number.
As we said yesterday, in addition to oil, these are very important charts for financial markets and for the global economic outlook. A bottom in these yields, as well as the continued recovery in oil will be important for restoring confidence in the global economic outlook.
This is the perfect time to join us in our Billionaire’s Portfolio. We have just added the billionaire’s macro trade of the year to our Billionaire’s Portfolio — a portfolio of deep value stocks owned by the best billionaire investors in the world. You can join us here.
As we said yesterday, oil on the mend is the key proxy right now for global economic stability. With that, after closing above $40 yesterday, oil continued its surge today, up 4%. And global stocks had a good day, up 1% in the U.S.
Remember, we get key inflation data over the next couple of days, namely from Europe and the U.S. A hotter inflation number in the U.S. would further support the signal that oil is giving to markets (a positive one).
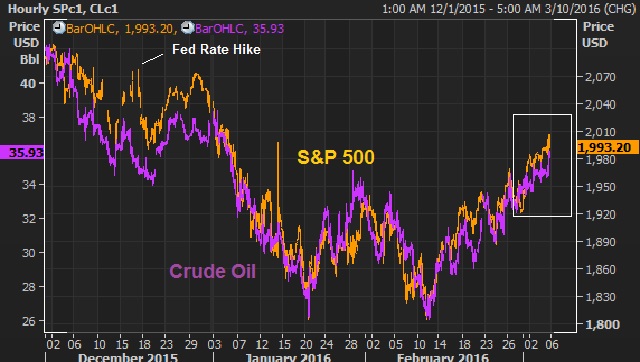
Today we want to look at a few of very key charts. This first chart is an update on the crude oil/stock market relationship. We’ve looked at this a few times over the past few months. The last time we revisited this chart, oil and stocks had started to diverge from stocks with its recent move back into the mid 30s.
So oil is sustaining above $40 for the first time since November. We know three of the top oil traders in the world are betting on $70-$80 oil by next year. We know central banks have stepped in (in coordination) since the low in oil on February 11 and the result has been a 50%+ bounce in oil. Now, technically, oil looks like a technical breakout is here.
In the above chart, you can see oil breaking above the high of March 22 (which was 41.90). In fact, we get a close above that level – technically bullish. And we also now have a technically bullish pattern (an impulsive C-wave of an Elliott Wave structure) that projects a move to $51.50, which happens to be right about where this big trendline comes in.
Now, with the inflation data in the pipeline for the week, we’ve talked about the negative signal that ultra-weak yields are sending to markets. And German yields have been leading the way on that front. But guess what? German yields reversed sharply off of the lows yesterday, and continued higher today, putting in a long term bullish reversal signal (an outside day – technical jargon, but can be very predictive of tops and bottoms). And that coincides with the U.S. 10-year yield, which is on the verge of breaking the recent downtrend and projecting a move back to 2.15%. We’ll take a look at these very important charts for financial markets and for the global economic outlook tomorrow.
These key markets are signaling what could be the beginning of a big shift in sentiment and the beginning of positive surprises in markets and economies, which tends to happen when expectations have been ratcheted down so dramatically, as we discussed yesterday with the sour earnings outlook and pessimistic economic backdrop.
This is the perfect time to join us in our Billionaire’s Portfolio. We have just added the billionaire’s macro trade of the year to our Billionaire’s Portfolio — a portfolio of deep value stocks owned by the best billionaire investors in the world. You can join us here.
Oil has surged to open the week. If you’ve been reading our daily pieces over the past few weeks, you’ll know how important oil is for global markets at this stage. With that, strong oil today has translated into higher stocks, higher broad commodities, a slight bump higher in interest rates and better investor sentiment in general.
It was just fourteen days ago that Chesapeake Energy, one of the largest producers of oil and natural gas was rumored to be choosing the path of bankruptcy. That rumor was immediately denied by the company. And soon thereafter, the reality set in for markets that a scenario like that would conjure up post-Lehman like outcomes. Oil has since put in a bottom and bounced more than 25%. Chesapeake has now bounced 46% from the lows just the last six trading days.
It’s at extremes in markets where the biggest and best investors have historically made their money – running into risk, when everyone else is running away.
With that, today we want to take a look at a few stocks with the biggest upside, and an important “risk buffer” in what is a high risk sector at the moment (energy). This risk buffer? Each stock has the presence of a big-time billionaire investor.
Self-made billionaire energy trader Boone Pickens has said he expects oil to return to $70 this year. On his $70 prediction, he’s also said that if he misses it will be because oil is “over $70, not under $70.” If Pickens is right about oil prices, each of these stocks below have huge upside:
1) Oasis Petroleum (OAS) – Billionaire hedge fund manager John Paulson owns nearly 4% of this stock. The activist hedge fund SPO Advisory owns 14% and has been buying the stock on almost every dip. When oil was last $70, OAS was trading $25 or 500% higher than current levels.
2) Chesapeake Energy (CHK) – Billionaire investor Carl Icahn owns 11% of CHK and recently added to his position around $13. The last time oil was $70, Chesapeake was $25. That would be more than a 1000% return from its price today.
3) EXCO Resources (XCO) – Billionaire investors Wilbur Ross and Howard Marks own more than 30% of this energy stock. The last time oil was $70, EXCO was $3.30. That would be almost a 330% return from its price today.
4) Consol Energy (CNX) – Billionaire David Einhorn owns 12.9% of this stock. When oil was last $70, Consol traded for $40 or almost 500% higher than current levels.
5) Williams Companies (WMB) – Carl Icahn Protégé, Keith Meister of the activist hedge fund Corvex Management, owns $1.1 billion worth of WMB. The last time oil was $70, WMB traded for $50 – more than 300% higher than its current levels.
As we’ve said, persistently cheap oil (at these prices) has become the new “too big to fail” — it’s a systemic risk. It’s hard to imagine central banks will sit back and watch an OPEC-rigged price war put the global economy back into an ugly downward spiral. And time is the worst enemy to those vulnerable first dominoes (the energy industry and weak oil producing countries).
The best investors like to go where the biggest risks are — that’s where the biggest returns can follow. And they’ve been getting aggressive in energy and commodities.
Without question, energy stocks have been beaten up and left for dead. If indeed Chesapeake is a leading indicator that it’s all backing away from the edge, there will be big money to be made in these stocks.
We already have one of the best performing stocks in the entire stock market for the month of February in our Billionaire’s Portfolio, billionaire-owned Freeport McMoran. Click here and join us!
When housing prices stalled in 2006 and then collapsed over the next three years, the subprime lending schemes quickly became exposed.
Mortgage defaults led to a banking crisis. Due to the highly interconnectedness of banks globally, the problems quickly spread to banks around the world. A banking crisis led to a global credit freeze. When people can’t access credit, that’s when it all hits the fan. Companies can’t meet payroll, don’t have the liquidity to make new orders. Jobs get cut. Companies go bust. Finally, the microscope on overindebtedness of consumers and corporates, turns to countries. Deficits leads to debt. Debt leads to downgrades. Downgrades leads to defaults.
For the most part, defaults were averted because central banks and governments stepped in, in a coordinated way, to backstop failing banks, failing companies and failing countries. From that point, continued central bank stimulus has 1) enabled banks to recapitalize, 2) foiled additional shock events, and 3) restored confidence to employers (to hire), to investors (to invest) and to consumers (to spend again).
As we’ve discussed in the past two weeks, persistently low oil prices represent a risk on par with the housing bust. And in recent days we’re seeing the signs of another global financial and economic crisis creeping uncomfortably closer to a “part two.”
As we’ve said, this time would be much worse because governments and central banks have exhausted the resources to bailout failing banks, companies and countries. But central banks, namely the Bank of Japan and/or the European Central Bank do have the opportunity to step-in here, become an outright buyer of commodities (particularly oil), as part of their QE programs, to avert disaster. But time is the oil industries worst enemy and therefore a big threat to the global economy. The longer policymakers drag their feet, the closer we get to the edge of global crisis — a crisis manufactured by OPEC’s price war.
Unfortunately, there are the building signs that the market is beginning to position for the worst outcome…
Key bank stocks in Europe are trading at levels lower than in the depths of both the global financial crisis (2009) and the European sovereign debt crisis (2012).
Source: Reuters, Billionaire’s Portfolio
The credit default swap market for key industries is sending up flares. This is where default insurance can be purchased against a company or country – and the place speculators bet on a company’s demise. Billionaire John Paulson famously made billions betting against the housing market via credit default swaps. Now the fastest deteriorating companies in Europe are banks. And the fastest deteriorating companies in North America are insurance companies (a sector that tends to have investments in high yield debt … in this case, exposure to the high yield debt of the oil and gas industry).
Source: Markit
The early signal for the 2007-2008 financial crisis was the bankruptcy of New Century Financial, the second largest subprime mortgage originator. Just a few months prior the company was valued at around $2 billion.
On an eerily similar note, a news report hit this morning that Chesapeake Energy, the second largest producer of natural gas and the 12th largest producer of oil and natural gas liquids in the U.S., had hired counsel to advise the company on restructuring its debt (i.e. bankruptcy). The company denied that they had any plans to pursue bankruptcy and said they continue to aggressively seek to maximize the value for all shareholders. However, the market is now pricing bankruptcy risk over the next five years at 50% (the CDS market).
Still, while the systemic threat looks similar, the environment is very different than it was in 2008. Central banks are already all-in. On the one hand, that’s a bad thing for the reasons explained above (i.e. limited ammunition). On the other hand, it’s a good thing. We know, and they know, where they stand (all-in and willing to do whatever it takes). With QE well underway in Japan and Europe, they have the tools in place to put a floor under oil prices.
In recent weeks, both the heads of the BOJ and the ECB have said, unprompted, that there is “no limit” to what they can buy as part of their asset purchase program. Let’s hope they find buying up dirt-cheap oil and commodities, to neutralize OPEC, an easier solution than trying to respond to a “part two” of the global financial crisis.


