This violent repricing of the tech giants came with clear warnings (i.e. the tightening of regulatory screws).
Now that we have it. And it is very healthy, and needed.
As we discussed yesterday, I would argue we are seeing regulation priced-in on the tech giants, which can create a more level playing field for businesses, more broad-based economic activity, and a more broad-based bull market for stocks. This is a theme we’ve been discussing in my daily note here for quite sometime.
And I suspect now, we can see the areas of the stock market that have been beaten down, from the loss of market share to the tech giants, make aggressive comebacks.
On that note, here’s another look at the big trendline we’ve been watching in the Dow …
Again, this line holds right at the 10% correction mark. And we’ve now bounced more than 700 dow points.
As I’ve said, it’s easy to get sucked into the daily narratives in the financial media, and it’s especially easy and dangerous (to your net worth) when stocks are declining. They tend to influence people to sell, when they should be buying.
And as someone that has been involved in markets more than 20 years, I can tell you that it’s also very dangerous to let political views influence your perspective on markets and investing. And I suspect we are seeing that mistake made in this environment (by pros and amateurs alike).
If you need help with your shopping list of stocks to buy on this dip, join me in my Billionaire’s Portfolio. We follow the world’s bests billionaire investors into their favorite stocks. Click here to learn more.
On Friday we talked about the opportunity presented by this recent dip in the broad stock market.
We’re beginning to see more clearly today the rotation out of tech and into value. That is translating into a continued slide in the Nasdaq, while the Dow is rising.
Now, even though this looks like a re-pricing of the high-flying tech stocks, as we often see the “baby gets thrown out with the bathwater.” In this case, because the big tech giants have been so widely held, when they crack, everything has cracked. That’s an opportunity to buy broader stocks on sale. And stocks are indeed cheap.
Take a look at historic valuations (P/E on the S&P 500) …
From a valuation perspective, Wall Street is estimating stocks on next year’s estimated earnings to be as cheap as we’ve seen only two times in the past 26 years.
You can see where stocks were valued on the S&P going into 2012. Stocks finished up 16% that year. The other year was 1995 (a P/E of 14.89). Stocks finished that year up 37.6%.
Still, many have continued to harp on valuation, always pointing to the long run average P/E on stocks, which is around 16. That’s a long history. If we look back at the past twenty years, the average valuation is MUCH, MUCH higher. It’s 23 times earnings!
If we take Wall Street’s estimate on S&P 500 earnings of $176 and multiply it by 23, we get and S&P at 4,048. That’s 47% higher than Friday’s close.
If you need help with your shopping list, join me in my Billionaire’s Portfolio. We follow the world’s bests billionaire investors into their favorite stocks. Click here to learn more.
The Nasdaq continued to slide today. Stock indices tend to go down a lot faster than they go up. The tech giant-driven Nasdaq was up over 15% year-to-date, just a few days ago, and has now given up more than 4% from the highs.
Not surprisingly, as people run for the exit doors on the big tech giants (taking profits), we’re seeing money rotate into the blue-chip value stocks.
The Dow and S&P 500 did much better than the Nasdaq today, which continues to slowly correct the big performance gap of the year (where the Nasdaq was up 15% at one point, while the DJIA was flat on the year).
Now, the biggest event of the week for markets may take place tonight. We hear from the Bank of Japan on monetary policy. We’ve discussed, many times, the role that Japan continues to play in our interest rate market.
Despite seven hikes by the Fed from the zero-interest-rate-era, our 10-year yield has barely budged. That’s, in large part, thanks to the Bank of Japan. Japan’s policy on pegging its 10-year yield at ZERO has been the anchor on global interest rates.
As I’ve said, when they finally signal a change to that policy, that’s when (our) rates will finally move. And that may be tonight. There is speculation that they may adjust UP that target on their 10-year yield. That would represent a dialing back of the BOJ’s QE program, which would signal the initial steps of exiting the crisis-era QE program.
What would that do? If the BOJ does indeed adjust their “yield curve control” policy, it should send global interest rates higher. That would put our ten-year yields back above 3%, which has been a level that has caused some uneasiness in markets. This time around, a move back above three percent would reflect a steepening U.S. yield curve which may be perceived as a positive, especially for those that have been concerned about the potential of seeing an inverted yield curve (i.e. a recession indicator).
If you haven’t joined the Billionaire’s Portfolio, where you can look over my shoulder and follow my hand selected 20-stock portfolio of the best billionaire owned and influenced stocks, you can join me here.
James Bullard, the President of the St. Louis Fed, said today that even if unemployment went to 3% it would have little impact on the current low inflationevironment. That’s quite a statement. And with that, he argued no need to do anything with rates at this stage.And he said the low growth environment seems to be well intact too — even though we well exceeded the target the Fed put on employment years ago. In the Bernanke Fed, they slapped a target on unemployment at 6.5% back in 2012, which, if reached, they said they would start removing accomodation, including raising rates. The assumption was that the recovery in jobs to that point would stoke inflation to the point it would warrant normalization policy. Yet, here we are in the mid 4%s on unemployment and the Fed’s favored inflation guage has not only fallen short of their 2% target, its trending the other way (lower).
As I’ve said before, what gets little attention in this “lack of inflation” confoundment, is the impact of the internet. With the internet has come transparency, low barriers-to-entry into businesses (and therefore increased competition), and reduced overhead. And with that, I’ve always thought the Internet to be massively deflationary. When you can stand in a store and make a salesman compete on best price anywhere in the country–if not world–prices go down.
And this Internet 2.0 phase has been all about attacking industries that have been built upon overcharging and underdelivering to consumers. The power is shifting to the consumer and it’s resulting in cheaper stuff and cheaper services. And we’re just in the early stages of the proliferation of consumer to consumer (C2C) business — where neighbors are selling products and services to other neighbors, swapping or just giving things away. It all extracts demand from the mainstream business and forces them to compete on price and improve service. So we get lower inflation. But maybe the most misunderstood piece is how it all impacts GDP. Is it all being accounted for, or is it possible that we’re in a world with better growth than the numbers would suggest, yet accompanied by very low inflation?
Join our Billionaire’s Portfolio and get my most recent recommendation – a stock that can double on a resolution on healthcare. Click here to learn more.
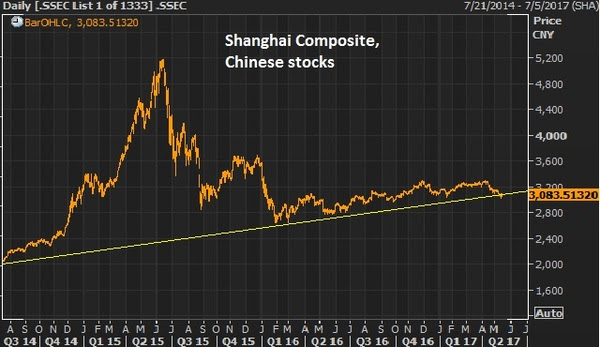
As we ended this past week, stocks remain resilient, hovering near highs. The Nasdaq had a visit to the 200-day moving average intraweek for a slide of a whopping (less than) 1%, and quickly it bounced back.It’s a Washington/Trump policies-driven market now, and while the media carries on with narratives about Russia and the FBI, the market cares about getting health care done (which there was progress made last week), getting tax reform underway, and getting the discussion moving on an infrastructure spend.We looked at oil and commodities yesterday. Chinese stocks look a lot like the chart on broader commodities. With that, the news overnight about some cooperation between the Trump team and China on trade has Chinese stocks looking interesting as we head into the weekend.
Let’s take at the chart…
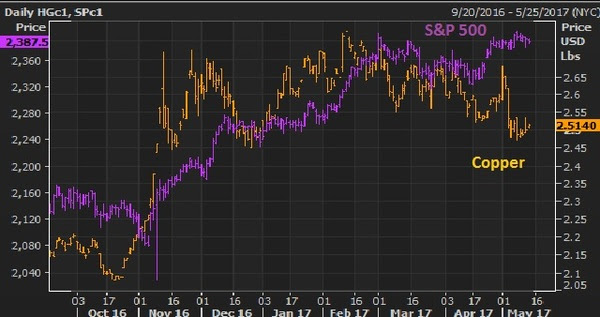
While the agreements out of China were said not to touch on steel and industrial metals, the first steps of cooperation could put a bottom in the slide in metals like copper and iron ore. These are two commodities that should be direct beneficiaries in a world with better growth prospects, especially with prospects of a $1 trillion infrastructure spend in the U.S. With that, they had a nice run up following the election but have backed off in the past couple of months, as the infrastructure spend appeared not to be coming anytime soon.
Here’s copper and the S&P 500…
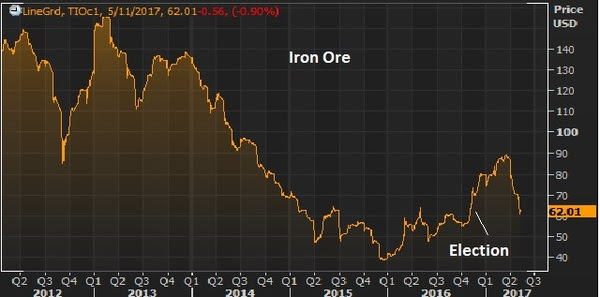
Trump policies are bullish for both. Same said for iron ore…
This is right in the wheelhouse of Wilbur Ross, Trump’s Secretary of Commerce. He’s made it clear that he will fight China’s dumping of steel on the U.S. markets, which has driven steel prices down and threatened the livelihood of U.S. steel producers. Keep an eye on these metals next week, and the stocks of producers.
Follow This Billionaire To A 172% Winner
In our Billionaire’s Portfolio, we have a stock in our portfolio that is controlled by one of the top billion dollar activist hedge funds on the planet. The hedge fund manager has a board seat and has publicly stated that this stock is worth 172% higher than where it trades today. And this is an S&P 500 stock!
Even better, the company has been constantly rumored to be a takeover candidate. We think an acquisition could happen soon as the billionaire investor who runs this activist hedge fund has purchased almost $157 million worth of this stock over the past year at levels just above where the stock is trading now.
So we have a billionaire hedge fund manager, who is on the board of a company that has been rumored to be a takeover candidate, who has adding aggressively over the past year, on a dip.
Stocks were down a bit today, for the first day in the past six days. Yields were lower, following two days of Janet Yellen on Capitol Hill. Gold was higher on the day. And the dollar was lower.
Of the market action of the day, the dollar and yields are the most interesting. The freshly confirmed Treasury Secretary, Steven Mnuchin, held a call with Japan’s Finance Minister last night, early morning Japan time.
What did USD/JPY do? It went down (lower dollar, stronger yen). Just as it did the week leading up to the visit between President Trump and Japan’s Prime Minister Abe.
Remember, the yen has been pulled into the fray on Trump’s tough talk on trade fairness and currency manipulation. The subject has cooled a bit, but with the new Treasury Secretary now at his post, the world will be looking for the official view on the dollar.
As I said before, I think the remarks about currency manipulation are (or should be) squarely directed toward China. And I suspect Abe may have conveyed to the president, in their round of golf, that Japan’s QE is quite helpful to the U.S. economy and policy efforts, even if it comes with a weaker yen (stronger dollar). Among many things, Japan’s policy on keeping its ten-year yield pegged at zero (which is stealth unlimited QE) helps put a lid on U.S. market interest rates. And that keeps the U.S. housing market recovery going, consumer credit going and U.S. stocks climbing, and that all fuels consumer confidence.
Yesterday we talked about the fourth quarter portfolio disclosures from the world’s biggest investors. With that in mind, let’s talk about the porfolio of the man that’s best position to benefit from the Trump administration: the legendary billionaire investor, Carl Icahn.
Icahn was an early supporter for Trump. He was an advisor throughout the campaign and helped shape policy plans for the president.
What has been the sore spot for Icahn’s underperforming portfolio in recent years? Energy. It has been heavily weighted in his portfolio the past two years and no surprise, it’s contributed to steep declines in the value of his portfolio over the past three years. Icahn’s portfolio is volatile, but over time it has produced the best long run return (spanning five decades) of anyone alive, including Buffett. And he’s worth $17 billion as a result.
Here’s a look at what I mean: In 2009 he returned +33%, +15% in 2010, +35% in 2011, +20% in 2012 and +31% in 2013. That’s quite a run, but he’s given a lot back–down 7% in 2014, down 20% in 2015 and down 20% last year.
Even with this drawdown, Icahn doesn’t see his energy stakes as bad investments. Rather, he thinks his stocks have been unfairly harmed by reckless regulation. And he’s been fighting it.
He penned a letter to the EPA last year saying its policies on renewable energy credits are bankrupting the oil refinery business and destroying small and midsized oil refiners.
And now that activism is positioned to pay off handsomely.
The new Trump appointee to run the EPA was first vetted by Icahn–it’s an incoming EPA chief that was suing the EPA in his role as Oklahoma attorney general. Safe to assume he’ll be friendly to energy, which will be friendly to Icahn’s portfolio.
And as we know, Icahn has since been appointed as an advisor to the president on REGULATION.
To get peek inside the portfolio of Trump’s key advisor, join me our Billionaire’s Portfolio. When you do, I’ll send you my special report with all of the details on Icahn, and where he’s investing his multibillion-dollar fortune to take advantage of Trump policies.
Our Billionaire’s Portfolio is the way investing should be. Its top-shelf intelligence, in an easy to understand format, delivered to your inbox. If you can read a weekly note, and push a button, this service is for you whether you’re a novice investor or a Wall Street titan. This is your opportunity to align your portfolio with the world’s smartest and most powerful investors. To learn from the best and ride their coattails to success.
You get access to the full gamut of billionaire intelligence. Join us now, get this special report, and get your portfolio in line with the richest, most powerful investors in the world.
The Trump agenda continues to dominate the market focus as we entered the second week of Trumponomics.
To this point the market focus has been on the pro-growth agenda. With that, stocks have been higher, yields have been higher, the dollar has been higher, and global commodities have been broadly rising. Meanwhile, gold (the fear trade) has been falling and the VIX has been falling, toward ultra-low levels. The VIX, like gold, is a good market indicator of uncertainty and/or fear.
Let’s talk about the VIX…
The VIX measures the implied volatility of options on the S&P 500. This is a key component in the price investors pay for downside protection on their portfolios.
So what is implied volatility? Implied volatility measures both actual volatility and the options market maker community’s expectations (or perception of certainty) about future volatility. When market makers feel confident about the stability in markets, implied vol is lower, which makes the price of options cheaper. When they aren’t confident in stability, implied vol goes up, which makes the price of an option go up. To compensate those that are taking the other side of your trade, for the lack of predictability, you pay a premium.
With that in mind, on Friday, the VIX traded to the lowest levels since the days before the failure of Lehman Brothers. That indicates that the market had (or has) become a believer that pro-growth policies, combined with ultra-easy central bank policies have created a buffer against the downside in stocks. But that perception of downside risk is changing today, with the more vocal uprising against Trump social policies. You can see the spike (in the far right of the chart) today…
So as big money managers were closing the week last Friday, looking at Dow 20,000+ and a VIX sliding toward levels not too far from pre-crisis levels, buying downside protection was dirt cheap. This morning, they’re paying quite a bit more for that protection.
With that said, this pop in the VIX and the Dow trading off by more than 100 points today gets a lot of attention. But is there justification to think that market turbulence will begin to reflect the turbulence and division in public opinion toward Trump policies? Just gauging the extent of the market reaction from the VIX today, it’s unlikely. The chart below is the longer term view of the VIX.
My observations: The VIX has had a small bounce from very, very low levels. On an absolute basis, vol is still very cheap. When there is real fear in the air, real uncertainty about the future, you can see from the spikes in the longer term chart above, the premium for the unknown gets priced in quickly and aggressively. Given that there has been virtually no risk premium priced into the market for any falter in the Trump Presidency, or the execution of Trump policies, the moves today have been very modest. And gold (as I write) is barely changed on the day.
We are likely entering an incredible era for investing, which will be an opportunity for average investors to make up ground on the meager wealth creation and retirement savings opportunities of the past decade. For help building a high potential portfolio for 2017, follow me in our Billionaire’s Portfolio, where you look over my shoulder as I follow the world’s best investors into their best stocks. Our portfolio more than doubled the return of the S&P 500 in 2016. You can join me here and get positioned for a big 2017.
We’re finishing the first full week under Trumponomics. And it’s been an active one.
It’s clear now that President Trump intends to follow through on his campaign promises. While that’s making waves with the media and with Washington types, it’s creating more certainty about the outlook for growth for the real economy and, therefore, for financial markets.
We close the week with the Dow above 20,000, on new record highs. And as we discussed yesterday, stock markets around the world are rallying too on the prospects of a stronger U.S. economy translating into a stronger global economy. We looked at the charts of Mexican and Canadian stocks yesterday–both of which are sitting on record highs. U.K. stocks are near record highs and German stocks are quickly closing in.
We already know that small business optimism in the U.S. has hit 12-year highs, jumping by the most in since 1980–on Trump’s pro-growth agenda. Today the consumer sentiment report showed sentiment is on the rise too–at 13-year highs.
Let’s talk about the data that we’re leaving behind. Fourth quarter GDP was reported today at just 1.9%. This, more than seven years removed from the failure of Lehman Brothers, an $800 billion stimulus package, seven years of zero interest rates and three rounds of quantitative easing, and the economy is running at about 60% of its normal pace. And even after taking the Fed’s balance sheet from $800 billion to $4.5 trillion, we have inflation running at less than 50% of its normal pace. This malaise is consistent throughout the world. And this is precisely why big, bold fiscal stimulus and structural change is desperately needed, and is being embraced by those that understand the dangers of the stall-speed global economy that has been kept alive by global central bank intervention. As I’ve said, at Dow 20,000, it’s just getting started.
Have a great weekend!
We are likely entering an incredible era for investing, which will be an opportunity for average investors to make up ground on the meager wealth creation and retirement savings opportunities of the past decade. For help building a high potential portfolio for 2017, follow me in our Billionaire’s Portfolio, where you look over my shoulder as I follow the world’s best investors into their best stocks. Our portfolio more than doubled the return of the S&P 500 in 2016. You can join me here and get positioned for a big 2017.
We have two big central bank meetings this week–BOJ and the Fed. With that, as we head into the week, let’s look at a key chart.
This chart is from a St. Louis Fed blog post last year. The inflation data, however, is all up-to-date. The Fed says “the chart above shows eight series that receive a lot of attention in the context of policy.”
So according to this chart, last year, as the Fed was building into its first rate hike to move away from emergency level rates and policies, the inflation data was looking soft. The Fed was telegraphing, clearly, a September hike, though six of the eight inflation measures in the chart above were running south of their target of 2% in the middle of last year. The headline inflation number for September, their preferred date of a hike, was zero!
Of course, after markets went haywire following China’s currency devaluation in August of last year, the Fed balked and stood pat. When things calmed, in December, they made their move. And at the same meeting, they projected to hike FOUR times this year. So far it hasn’t happened. It’s been a one and done.
Moreover, as of March of this year, they took two of those projected hikes off the table, and guided lower on growth, lower on inflation and a lower rate trajectory into the future. I would argue removing two hikes from guidance was effectively easing.
But if we look at the chart above, where inflation stands now relative to the middle of last year, when they were all “bulled-up” on rates, the story doesn’t jive. By all of the inflation measures, the economy is clearly running hotter (a relative term). Five of the eight inflation measures are running ABOVE the Fed’s 2% target (the horizontal black line in the chart). Yet, aside from a few Fed hawks that have been out trying to build expectations for a rate move soon, on balance, the messaging from the Fed has been mixed at best, if not dovish.
The Bernanke-led Fed relied heavily on communication (i.e. massaging sentiment and perception) to orchestrate the recovery, but the Fed, under Yellen, has been a communications disaster.
Join us here to get all of our in-depth analysis on the bigger picture, and our carefully curated stock portfolio of the best stocks that are owned and influenced by the world’s best investors.
We talked this week about the way markets are set up for a significant positive perception shift. It’s been led by oil, which had its third consecutive close above $40 today. Yields are another key brick in the foundation that may be laid tomorrow.
As oil prices have been a threat to the global economic and stability outlook over the past few months, yields have also been sending a negative signal to markets. The yield on the German 10-year got very close to the all-time lows this week, inching closer to the zero line (and negative territory). And U.S. 10-year yields, following the Fed’s last meeting, have fallen back from 2% down to as low as 1.68% — just 30 basis points above the all-time low of July 2012, when Europe was on the edge of a sovereign debt blow-up. And remember, this is AFTER the Fed has raised rates for the first time in nine years.
So yields have been signaling an uglier path forward, if not deflation forever in places like Japan and Europe. Of course, the move by Japan to negative interest rates in January was a strong contributor to the perception swoon about the global economy. But a key component in Japan’s move, and in the coordinated actions by central banks over the past two months, has been the threat from the oil price bust. And that is now on the mend. Oil is up 58% from its February low.
Still, global yields are hanging around at the lows.
Tomorrow we get euro zone and U.S. inflation data. As we’ve said, when expectations and perception has been ratcheted down so dramatically, we can get an asymmetric outcome. Earnings expectations are in the gutter. Economic growth expectations are in the gutter. Same can be said for expectations on the outlook for inflation data. In a normal world, hotter than expected inflation is a bad signal for the risk-taking environment. In our current world, hotter than expected inflation would not be a good signal, it would be a very good signal. It would show the economy has a pulse.
Yields in the two key government bond markets are set up nicely for a bottom on some hotter inflation data.
Tuesday, German yields touched 7.5 basis points. Remember, earlier in the month we talked about what happened the last time German yields were this low.
Bond kings Bill Gross and Jeffrey Gundlach said it was crazy. Bill Gross called the German bund the “short of a lifetime” (short bonds, which equates to a bet that yields go higher). He compared it to the opportunity when George Soros broke the Bank of England and made billions shorting the British pound. Gundlach said it was a trade with almost no upside and unlimited downside.
They were both right. In the chart below you can see the explosive move in German rates (in blue) away from the zero line. In the chart below, you can see the 10-year German bond yields moved from 5 basis points to 106 basis points in less than two months — a 20x move. U.S. 10 year yields (the purple line) moved from 1.72% to 2.49% almost in lock-step.
On the move down on Tuesday, the yield on the German bund reversed sharply and put in a bullish outside day (a key reversal signal). Could it have been the bottom into tomorrow’s inflation data?
Coincidentally, the U.S. 10-year looks like a bottom may be in as well.
U.S. yields have a chance to break this downtrend tomorrow on a hotter inflation number.
As we said yesterday, in addition to oil, these are very important charts for financial markets and for the global economic outlook. A bottom in these yields, as well as the continued recovery in oil will be important for restoring confidence in the global economic outlook.
This is the perfect time to join us in our Billionaire’s Portfolio. We have just added the billionaire’s macro trade of the year to our Billionaire’s Portfolio — a portfolio of deep value stocks owned by the best billionaire investors in the world. You can join us here.


 As we ended this past week, stocks remain resilient, hovering near highs. The Nasdaq had a visit to the 200-day moving average intraweek for a slide of a whopping (less than) 1%, and quickly it bounced back.It’s a Washington/Trump policies-driven market now, and while the media carries on with narratives about Russia and the FBI, the market cares about getting health care done (which there was progress made last week), getting tax reform underway, and getting the discussion moving on an infrastructure spend.We looked at oil and commodities yesterday. Chinese stocks look a lot like the chart on broader commodities. With that, the news overnight about some cooperation between the Trump team and China on trade has Chinese stocks looking interesting as we head into the weekend.