We had a heavy event calendar last week for markets, with the Fed, BOJ and BOE meetings. And then we had the anticipation of the G-20 Finance Minister’s meeting as we headed into the weekend.
As I said to open the week last week, markets were pricing in a world without disruptions. But disruptions looked likely. Still, the week came and went and stocks were little changed on the week, but yields came in lower (despite the Fed’s third rate hike) and the dollar came in lower (again, despite the Fed’s third rate hike).
Is that a signal?
Maybe. But as we discussed on Friday, the divergence between market rates and the rate the Fed sets is part central bank-driven Treasury buying (from those still entrenched in QE — Japan, Europe), and part market speculation that higher rates are threatening to the economy, and therefore traders sell short term Treasuries (rates go higher) and buy longer term Treasuries (rates go lower). With that, the Fed has been ratcheting the Fed Funds rate higher, now three times, but the 10 year government bond yield is doing nothing.
As for the dollar, if your currency has been weak, no one wanted to head into a G-20 Finance Ministers meeting and sit across the table from the new Treasury Secretary under the Trump administration (Mnuchin) and be drawn into the fray of currency manipulation claims. With that, the dollar weakened across the board last week.
All told, we had little disruption last week, but things continue to look vulnerable this week. Today we have the FBI Director testifying before Congress and acknowledging an open investigation of Trump associates contacts with Russia during the election. Fed officials have already been out in full force today make a confusing Fed picture even more confusing. And it sounds like the UK will officially notify the EU on March 29 that they will exit.
With all of the above in mind, and given the growth policies from the Trump administration still have little visibility on “when” they might get things done, the picture for markets has become muddied.
This all makes stocks vulnerable to a correction, though dips should be met with a lot of buying interest. Perhaps the clearest trade in this picture that’s become more confusing to read, is gold.
Gold jumped on the Fed rate hike last week, and Yellen’s more hawkish tone on inflation. If she’s right, gold goes higher. If she’s wrong, and the Fed has made a big mistake by hiking three times in a world that still can’t sustain much growth or inflation, gold probably goes higher on the Fed’s self-inflicted wounds to the economy.
In our Billionaire’s Portfolio, we’re positioned in a portfolio of deep value stocks that all have the potential to do multiples of what broader stocks do — all stocks owned and influenced by the world’s smartest and most powerful billionaire investors. Join us today and we’ll send you our recently recorded portfolio review that steps through every stock in our portfolio, and the opportunities in each.
Stocks continue to print new record highs. Let’s talk about why.
First, as we know, the most powerful underlying force for stocks right now is prospects of a massive corporate tax cut, deregulation, a huge infrastructure spend and trillions of dollars of corporate repatriation coming. But quietly, among all of the Trump attention, earnings are also driving stocks. More than 70% of S&P 500 companies have reported. About 2/3rds of the companies have beat Wall Street estimates. And most importantly, earnings in Q4 have grown at 3.1% year-over-year. That’s the first consecutive positive growth reading since Q4 2014/ Q1 2015.
Meanwhile, yields have remained quiet. And oil prices have remained quiet. That’s positive for stocks. Take a look at the graphic below …
You can see, stocks and most commodities continue to rise on the growth outlook. Yields and energy should be rising too. But the 10 year yield has barely budged all year — same for oil. Of course, higher rates, too fast, are a countervailing force to the pro-growth policies. Same can be said for higher oil too fast. With that, both are adding more “fuel” to stocks.
On the rate front, we’ll hear from Janet Yellen this week, as she gives prepared remarks on the economy to Congress, and takes questions.
She’s been a communications disaster for the Fed. Most recently, following the Fed’s December rate hike, she backtracked on her comments made a few months prior, when she said the Fed would let the economy run hot. She denied that in December. Still, the 10-year yield is about 10 basis points lower than where it closed following that December press conference. I wouldn’t be surprised to see a more dovish tone from Yellen this time around, in effort to walk market rates a little lower, to take the pressure off of the Fed and to continue stimulating optimism about the economy.
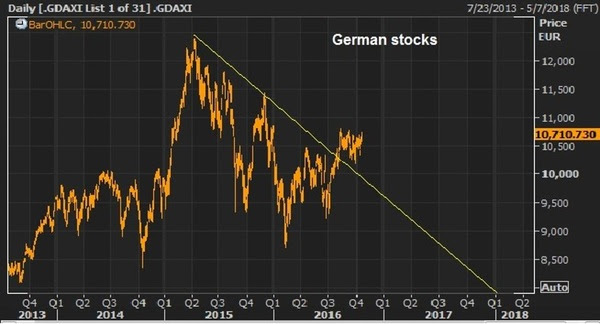
On Friday we looked at four important charts for markets as we head into this week: the dollar/yen exchange rate, the Nikkei (Japanese stocks), the DAX (German Stocks), and the Shanghai Composite (Chinese stocks).
With U.S. stocks printing new record highs by the day, these three stock markets are ready to make a big catch-up run. It’s just a matter of when. And I argued that a positive tone coming from the meeting of U.S. and Japanese leadership, under the scrutiny of trade tensions, could be the greenlight to get these markets going. That includes a stronger dollar vs. the yen. All are moving in the right direction today.
On the China front, we looked at this chart on Friday.
As I said, “Copper has made a run (up 10% ytd). That typically correlates well with expectations of global growth. Global growth is typically good for China. Of course, they are in the crosshairs of Trump’s fair trade movement, but if you think there’s a chance that more fair trade terms can be a win for the U.S. and a win for China, then Chinese stocks are a bargain here.”
Copper is surged again today on a supply disruption and has technically broken out.
This should continue to spark a move in the Chinese stock market.
For help building a high potential portfolio for 2017, follow me in our Billionaire’s Portfolio, where you look over my shoulder as I follow the world’s best investors into their best stocks. Our portfolio more than doubled the return of the S&P 500 in 2016. You can join me here and get positioned for a big 2017.
Over the past year we’ve had a wild ride in global yields. Today I want to take a look at the dramatic swing in yields and talk about what it means for the inflation picture, and the Fed’s stance on rates.
When oil prices made the final leg lower early last year, the Japanese central bank responded to the growing deflationary forces with a surprise cut of their benchmark interest rate into negative territory.
That began the global yield slide. By mid-year, more than $12 trillion dollars with of government bond yields across the world had a negative interest rate. Even Janet Yellen didn’t close the door to the possibility of adopting NIRP (negative interest rate policies).
So investors were paying the government for the privilege of loaning it their money. You only do that when 1) you think interest rates will go even further negative, and/or 2) you think paying to park your money is the safest option available.
And when you’re a central banker, you go negative to force people out of savings. But when people think the world is dangerous and prices will keep falling, they tend to hold tight to their money, from the fear a destabilized world.
But this whole dynamic was very quickly flipped on its head with the election of a new U.S. President, entering with what many deem to be inflationary policies. But as you can see in the chart below, the U.S. inflation rate had already been recovering, and since November is now nudging closer to the Fed’s target of 2%.
Still, the expectations of much hotter U.S. inflation are probably over done. Why? Given the divergent monetary policies between the U.S. and the rest of the world, capital has continued to flow into the dollar (if not accelerated). That suppresses inflation. And that should keep the Fed in the sweet spot, with slow rate hikes.
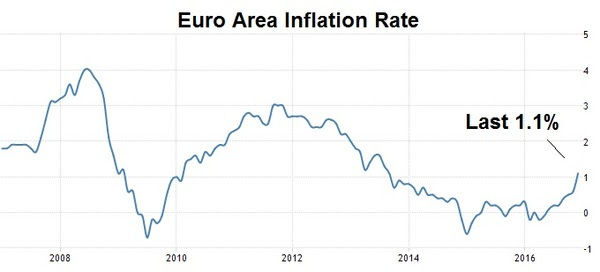
Meanwhile, there’s more than enough room for inflation to run in other developed economies. You can see in Europe, inflation is now back above 1% for the first time in three years. That, too, is in large part because of its currency. In this case, a stronger dollar has meant a weaker euro. This (along with the UK and Japan) is where the real REflation trade is taking place. And it’s where it’s needed most, because it also means growth is coming with it, finally.
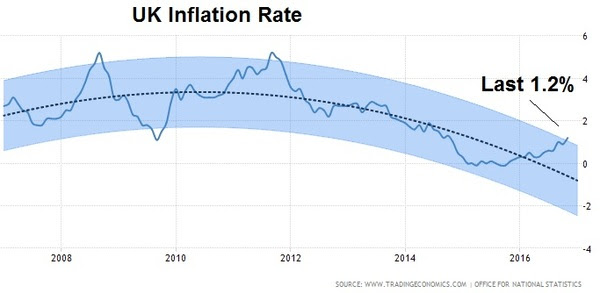
You can see, following Brexit, the chart looks similar in the UK – prices are coming back, again fueled by a sharp decline in the pound, which pumps up exports for the economy.
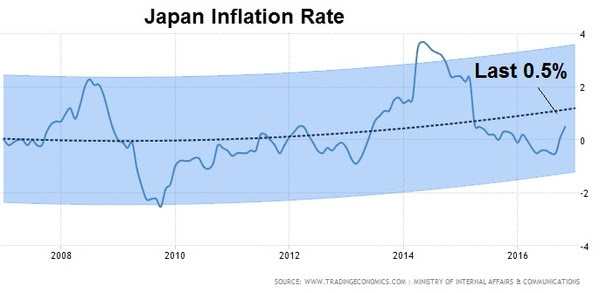
And, here’s Japan.
Japan’s deflation fight is the most noteworthy, following the administrations 2013 all-out assault to beat 2 decades of deflation. It hasn’t worked, but now, post-Trump, the stars may be aligning for a sharp recovery.
For help building a high potential portfolio, follow me in our Billionaire’s Portfolio, where you look over my shoulder as I follow the world’s best investors into their best stocks. Our portfolio more than doubled the return of the S&P 500 in 2017. You can join me here and get positioned for a big 2017.
With the Dow within a fraction of 20,000 today, and with the first week of 2017 in the books, I want to revisit my analysis from last month on why stocks are still cheap.
Despite what the media may tell you, the number 20,000 means very little. In fact, it’s amusing to watch interviewers constantly probe the experts on TV to get an anwer on why 20,000 for the Dow is meaningful. They demand an answer and they tend to get them when the lights and a camera are locked in on the interviewee.
Remember, if we step back and detach from the emotions of market chatter, speculation and perception, there are simple and objective reasons to believe the broader stock market can go much higher from current levels.
I want to walk through these reasons again for the new year.
Reason #1: To return to the long-term trajectory of 8% annualized returns for the S&P 500, the broad stock market would still need to recovery another 49% by the middle of next year. We’re still making up for the lost growth of the past decade.
Reason #2: In low-rate environments, the valuation on the broad market tends to run north of 20 times earnings. Adjusting for that multiple, we can see a reasonable path to a 16% return for the year.
Reason #3: We now have a clear, indisputable earnings catalyst to add to that story. The proposed corporate tax rate cut from 35% to 15% is estimated to drive S&P 500 earnings UP from an estimated $132 per share for next year, to as high as $157. Apply $157 to a 20x P/E and you get 3,140 in the S&P 500. That’s 38% higher.
Reason #4: What else is not factored into all of this simple analysis, nor the models of economists and Wall Street strategists? The prospects of a return of ‘animal spirits.’ This economic turbocharger has been dead for the past decade. The world has been deleveraging.
Reason #5: As billionaire Ray Dalio suggested, there is a clear shift in the environment, post President-elect Trump. The billionaire investor has determined the election to be a seminal moment. With that in mind, the most thorough study on historical debt crises (by Reinhardt and Rogoff) shows that the deleveraging of a credit bubble takes about as long as it took to build. They reckon the global credit bubble took about ten years to build. The top in housing was 2006. That means we’ve cleared ten years of deleveraging. That would argue that Trumponomics could be coming at the perfect time to amplify growth in a world that was already structurally turning. A pop in growth, means a pop in corporate earnings–and positive earnings surprises is a recipe for higher stock prices.
For these five simple reasons, even at Dow 20,000, stocks look extraordinarily cheap.
For help building a high potential portfolio, follow me in our Billionaire’s Portfolio, where you look over my shoulder as I follow the world’s best investors into their best stocks. Our portfolio more than doubled the return of the S&P 500 in 2017. You can join me here and get positioned for a big 2017.
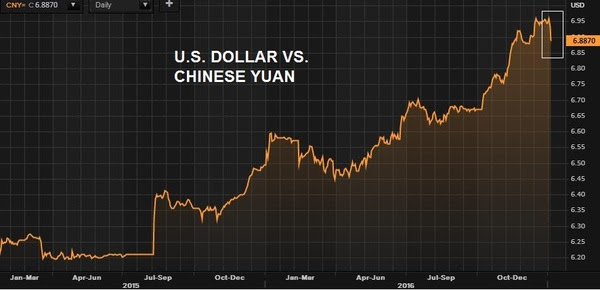
We talked yesterday about the bad start for global markets in 2016. It was led by China. Today, it was a move in the Chinese currency that slowed the momentum in markets. Yields have fallen back. The dollar slid. And stocks took a breather.
China’s currency is a big deal to everyone. It’s the centerpiece of the tariff threats that have been levied from the U.S. President-elect. I’ve talked quite a bit about that posturing (you can see it again here: Why Trump’s Tough Talk On China May Work).
As we know, China, itself, sets the value of its currency every day. It’s called a managed float. They determine the value. And for the past two years, they’ve been walking it lower — weakening the yuan against the dollar. That’s an about face to the trend of the prior nine years. In 2005, in agreement with their major trading partners (primarily the U.S.), they began slowly appreciating their currency, in an effort to allay trade tensions, and threats of trade sanctions (tariffs).
So what happened today? The Chinese revalued its currency — pegged ithigher by a little more than a percent against the dollar. That doesn’t sound like a lot, but as you can see in the chart, it’s a big move, relative to the average daily volatility. That became big news and stoked a little bit of concern in markets, mostly because China was the sore spot at the open of last year, and the PBOC made a similar move around this time, when global marketswere spiraling.
Why did they do it? This time around, the Chinese have complained about the threat of capital flowing out of the country – it’s a huge threat to their economy in its current form. That’s where they’ve laid the blame, on the two year slide in the value of the yuan. With that, they’ve allegedly been fighting to keep the yuan stable and have been stepping up restrictions on money leaving the country. Today’s move, which included a spike in the overnight yuan borrowing rate, was a way to crush speculators that have been betting against the currency, putting further downward pressure on the currency. But it also likely Trump related – the beginning of a crawl higher in the currency as we head toward the inauguration of the new President Trump. It’s very typical for those under the gun for currency manipulation to make concessions before they meet with trade partners.
So, should we be concerned about the move today in China? No. It’s not another January 2016 moment. But the move did drive profit taking in twobig trends of the past two months: the dollar and U.S. Treasuries. With that, the first jobs report of the year comes tomorrow. It should provide more evidence that the Fed will hike a few times this year. And that should restore the climb in the dollar and in rates.
For help building a high potential portfolio, follow me in our Billionaire’s Portfolio, where you look over my shoulder as I follow the world’s best investors into their best stocks. Our portfolio more than doubled the return of the S&P 500 in 2017. You can join me here and get positioned for a big 2017.
Remember this time last year? The markets opened with a nosedive in Chinese stocks. By the time New York came in for trading, China was already down 7% and trading had been halted. That started, what turned out to be, the worst opening stretch of a New Year in the history of the U.S. stock market.
The sirens were sounding and people were gripping for what they thought was going to be a disastrous year. And then, later that month, oil slid from the mid $30s to the mid $20s and finally people began to realize it wasn’t China they should be worried about, it was oil. The oil price crash was a ticking time bomb, about to unleash mass bankruptcies on the energy industry and threaten a “round two” of global financial crisis.
What happened? Central banks stepped in. On February 11th, the Bank of Japan intervened in the currency markets, buying dollars/selling yen. What did they do with those dollars? They must have bought oil, in one form or another. Oil bottomed that day. China soon followed with a move to boost bank lending, relieving some fears of a global liquidity crunch. The ECB upped its QE program and cut rates. And then the Fed followed up by taking two of their projected four rate hikes off of the table (of which they ended up moving just once on the year).
What a difference a year makes.
There’s a clear shift in the environment, away from a world on liquidity-driven life support/ and toward structural, growth-oriented change.
With that, there’s a growing sense of optimism in the air that we haven’t seenin ten years. Even many of the pros that have constantly been waiting for the next “shoe to drop” (for years) have gone quiet.
Global markets have started the year behaving very well. And despite the near tripling from the 2009 bottom in the stock market, money is just in the early stages of moving out of bonds and cash, and back into stocks. Following the election in November, we are coming into the year with TWO consecutive record monthly inflows into the U.S. stock market based on ETF flows from November and December.
The tone has been set by U.S. markets, and we should see the rest of the world start to play catch up (including emerging markets). But this development was already underway before the election.
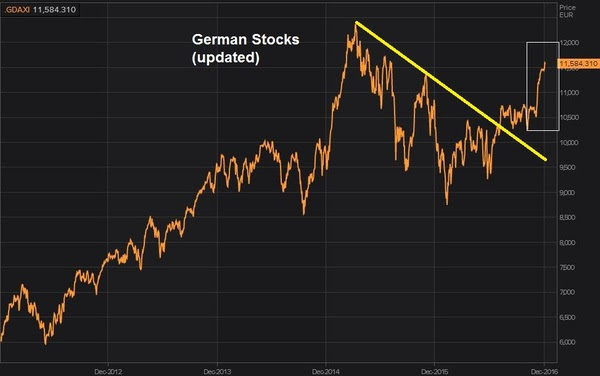
Remember, I talked about European stocks quite a bit back in October. While U.S. stocks have soared to new record highs, German stocks have lagged dramatically and have offered one of the more compelling opportunities.
Here’s the chart we looked at back in October, where I said “after being down more than 20% earlier this year, German stocks are within 1.5% of turning green on the year, and technically breaking to the upside“…
And here’s the latest chart…
You can see, as you look to the far right of the chart, it’s been on a tear. Adding fuel to that fire, the eurozone economic data is beginning to show signs that a big bounce may be coming. A pop in U.S. growth would only bolster that.
And a big bounce back in euro zone growth this year would be a very valuabledefense against another populist backlash against the establishment (first Grexit, then Brexit, then Trump). Nationalist movements in Germany and France are huge threats to the EU and euro (the common currency). Another round of potential break-up of the euro would be destabilizing for the global economy.
With that, as we enter the year with the ammunition to end the decade long economy rut, there are still hurdles to overcome. Along with Trump/China frictions, the French and German elections are the other clear and present dangers ahead that could dull the efficacy of Trumponomics.
For help building a high potential portfolio, follow me in our Billionaire’s Portfolio, where you look over my shoulder as I follow the world’s best investors into their best stocks. Our portfolio more than doubled the return of the S&P 500 in 2017. You can join me here and get positioned for a big 2017.
We’ve talked a lot about the set ups for big moves in Japanese and German stocks, as these major stock markets have lagged the recovery in the U.S.
Many have yet to come to the realization that a higher growth, healthier U.S. economy is good for everyone — starting with developed marketeconomies. And it unquestionably applies to emerging market economies, despite the fears of trade constraints.
A trillion dollars of U.S. money to be repatriated, has the dollar on a run that will likely end with USDJPY dramatically higher, and the euro dramatically lower (maybe all-time lows of 0.83 cents, before it’s said and done). This is wildly stimulative for those economies, and inflation producing for two spots in the world that have been staring down the abyss of deflation.
This currency effect, along with the higher U.S. growth effect on German and Japanese stocks will put the stock markets in these countries into aggressive catch up mode. I think the acceleration started this week.
As I said last week, Japanese stocks still haven’t yet taken out the 2015 highs. Nor have German stocks, though both made up significant ground this week. Yen hedged Nikkei was up 4.5% this week. The euro hedged Dax was up 7.6%.
What about U.S. stocks? It’s not too late. As I’ve said, it’s just getting started.
We’ve talked quite a bit about the simple fundamental and technical reasons stocks are climbing and still have a lot of upside ahead, but it’s worth reiterating. The long-term trajectory of stocks still has a large gap to close to restore the lost gains of the past nine-plus years, from the 2007 pre-crisis highs. And from a valuation standpoint, stocks are still quite cheap relative to ultra-low interest rate environments. Add to that, a boost in growth will make the stock market even cheaper. As the “E” in the P/E goes up, the ratio goes down. It all argues for much higher stocks. All we’ve needed is a catalyst. And now we have it. It’s the Trump effect.
But it has little to do with blindly assuming a perfect presidential run. It has everything to do with a policy sea change, in a world that has been starving (desperately needing) radical structural change to promote growth.
Not only is this catch up time for foreign stocks. But it’s catch up time for the average investor. The outlook for a sustainable and higher growth economy, along with investor and business-friendly policies is setting the table for an era of solid wealth creation, in a world that has been stagnant for too long. That stagnation has put both pension funds and individual retirement accounts in mathematically dire situations when projecting out retirement benefits. So while some folks with limited perspective continue to ask if it’s too late to get off of the sidelines and into stocks, the reality is, it’s the perfect time. For help, follow me and look over my shoulder as I follow the world’s best investors into their best stocks. Our portfolio is up more than 27% this year. You can join me here and get positioned for a big 2017.
Back in early June I talked about the building story for a breakout in natural gas prices.
Oil had doubled off of the bottom, but natural gas had lagged the move. This created really compelling opportunities for the natural gas stocks that had survived the downturn–and for those that had emerged from bankrupcy positioned to be debt-free cash machines in a higher price environment.
We looked at this chart as it was setup for a big trend break …
It was trading at $2.60 at the time and, as I said, “it looked like the bounce was just getting started” and “could be looking at the early stages of a big run in nat gas prices,” especially given that it was trailing the double that had already taken place in oil.
That break happened in October. And natural gas traded above $3.70 today. Four bucks is near the midpoint of the $6.50-$1.65 range of the past three years. And we’re getting close.
Remember, I said natural gas stocks are a leveraged play on natural gas prices. And back in June I noted the move in Consol Energy (CNX), which had already quadrupled since January. It sounds like you missed the boat? It’s nearly doubled since June!
We have 15% exposure to natural gas related companies in our Billionaire’s Portfolio. Follow me and look over my shoulder as I follow the world’s best investors into their best stocks – they tend to be in first, before stocks like Consol make their moves. Our portfolio is up more than 27% this year. You can join me here and get positioned for a big 2017.
With Thanksgiving behind us, we a few key events ahead for markets before we can put a bow on things and call it a year.
As things stand, the S&P 500 is up around 8%, right in line with the long term average return (less dividends). Yields are around 2.3%. That’s right about where we left off at the end of 2015 (following the Fed’s first move higher on rates since the crisis).
We may find a round trip for oil as well before the year it over. On Wednesday, we’ll finally hear from OPEC on a production cut. Remember, it was late September when we were told that the Saudis were finally on board for a production cut, to get oil prices higher and to stop the bleeding in the oil revenue dependent OPEC economies.
As we’ve discussed, it was Saudi Arabia that blocked a cut on
Thanksgiving day evening two years ago. And that sent oil into a spiral from $70 to as low as $26. Importantly, cheap oil has not only represented a threat to global economic stability but it’s been deflationary. The threat to stability and the deflationary pressure is what has kept the Fed on the sidelines, reversing course on their rate hike projections for this year, and then, conversely, becoming progressively more and more dovish since March.
You can see in this graphic from the Fed last December (2015) after they decided to hike for the first time coming out of the crisis period.
Source: Fed
The majority view from Fed members was an expectation that the Fed funds rate would be about 1.375% at this point in th year (2016). As we know, it hasn’t happened. As of two months ago, the Fed was expecting rates to be at just 1.00% by the end next year.
This makes this week’s OPEC decision even more important, given the market’s and Fed’s expectations on the path of monetary policy at this point.
If OPEC does as they’ve indicated they will do this week, by announcing the first production cut in oil in eight years, it could send the price of oil back to levels of two years ago — when the oil price bust was started that Thanksgiving day. That’s $70.
And $70 oil would play a huge role in where rates go next year, in the U.S., and in Europe and Japan. The inflationary pressures of $70 oil could put the Fed back on a path to hike three to four times in the coming year (as they intended coming into 2016). And it could create the beginning of taper talk in Europe and Japan.
If we consider that possibility, it makes for a remarkably dramatic change in the global economic outlook in just five weeks (since the Nov 8 election). As Paul Tudor Jones, one of the great macro traders of all-time, has said: “the very best money is made at the market turns. Everyone says you get killed trying to pick tops and bottoms and you make all your money by playing the trend in the middle. Well for twelve years I have been missing the meat in the middle but I have made a lot of money at tops and bottoms.” An OPEC move should cement the top in bonds.
We may be entering an incredible era for investing. An opportunity for average investors to make up ground on the meager wealth creation and retirement savings opportunities of the past decade, or more. For help, follow me in my Billionaire’s Portfolio, where you look over my shoulder as I follow the world’s best investors into their best stocks. Our portfolio is up 24% year to date. That’s more than three times the performance of the broader stock market. Join me here.
I talked last week about the move in oil, and the lag in natural gas.
But natural gas was knocking on the door of a technical breakout. As you can see, that breakout looks to be underway now.
Nat gas is now at $3.25. If history is any indication, it could be in the low $4s soon.
That’s helped by chatter today from OPEC members out vocally supporting the production cut that was agreed to two weeks ago. And the Secretary General of OPEC piled on today by saying the sharp contraction in investments (due to low prices) poses a threat to global oil supply. As we’ve discussed, for those that had the “oil price to zero” arguments earlier in the year, supply changes, so does demand.
With all of this, oil continues to climb higher, testing the June highs today. Here’s another look at the chart.
A break above the June highs of $51.67 would project a move to near $65 (technically speaking, it’s a C-wave). Another big technical level above is $68.60, which is the 61.8% retracement of the move down from almost $95 in late 2014, to the lows of earlier this year. That’s the breakdown in oil prices driven by OPEC’s 2014 refusal to cut production. And now were on the verge of getting the first cut in eight years. So oil is looking like higher levels are coming — it was up another 3% today.
What’s does it mean for stocks? As we’ve discussed, for much of the year, lower oil has meant lower stocks, and higher oil has meant higher stocks.
This emerging bullish technical and fundamental backdrop for energy should be very good for stocks. Remember, higher energy prices, in this environment, removes the risk of another oil price shock-to-sentiment (good for stocks, good for the economy). And it means producers can start producing again, downstream businesses can fill capacity, and we can start seeing some of the hundreds of thousands of U.S. jobs replenished that have been lost over the past two years.
Since OPEC rigged lower oil prices back in late 2014, we’ve had over 100 North American energy company bankruptcies. Some of those have/are reorganizing and emerging with lean balance sheets into what could be a hot recovery in energy prices. I’ll talk about some tomorrow.
The Billionaire’s Portfolio is up 23% year-to-date — that’s nearly four times the return of the S&P 500 during the same period. We recently exited a big FDA approval stock for a quadruple, and we’ve just added a new pick to the portfolio — following Warren Buffett into one of his favorite stocks. If you haven’t joined yet, please do. Click here to get started and get your portfolio in line with our Billionaire’s Portfolio.

 Stocks continue to print new record highs. Let’s talk about why.