Forbes has just ranked the top 400 richest people in America for 2017.
Among the top 50, a fifth have created their wealth from some sort of Wall Street activity (mostly hedge funds, but also brokerage and asset management). There’s not much new there–the rich have gotten richer on Wall Street despite the challenges of the past decade. But as we’ve discussed, the torch was, in many respects, passed to Silicon Valley over the past decade, as the best spot to create–that’s where the biggest proportion of the wealthiest 50 have built their wealth.
But much of that technology wealth can be refined down to the very industries that are being displaced on the wealth list, such as publishing, energy and retail.
That makes you wonder how long some of these companies can command a software-like valuation when the core of their business models are rather traditional things like selling ads, distributing content, making cars or selling retail products.
To this point, as long as they started in Silicon Valley, they tend to get a very long leash. They can lose money with immunity.
Consider this: GM is valued at $66 billion. Telsa is valued at $57 billion. GM has made (net profit) $43 billion over the past six years. Tesla has lost$2.5 billion over the past six years. Meanwhile, Elon Musk, Tesla’s founder, has amassed a $20 billion net worth.
The question is how defensible are these businesses (Facebook, Netflix, Tesla, Twitter)? How wide is their moat? A couple of years ago, the answer was probably very wide–very defensible given the adoption, the scale, and the deep pocket investors that were willing to continue plowing money into them. But, as we’ve discussed, if the regulatory environment becomes less favorable and the money dries up (in the case of private companies, like Uber), the operating advantages can begin to evaporate. This bubble-up of regulatory scrutiny on tech is something to keep a close eye on. It may become one of the big themes in the coming year.
Stocks open the week with another record high. The dollar continues to do better. And as we open the new month, yields are now up 32 basis points from the lows of early last month.
That’s a dramatic shift in the interest rate environment. And in recent days, underpinning that strength, is the idea that a hawk could be taking over for Janet Yellen when her term ends at the end of January.
Over the past few days the President has met with candidates for the Fed Chair job, and has said he will be announcing his decision in the next two to three weeks. That’s a big deal for markets and the economy — something to keep a close eye on.
His interview last Thursday was with a known hawk, former Fed governor Kevin Warsh – who has publicly criticized the Fed for keeping rates too low. He was also a hawk through some of the darkest days of the recovery – he’s been proven wrong for that view. As for Yellen: She has been among the most dovish Fed members throughout the crisis but has been leading the rate normalization phase (i.e. higher rates), which has proven to be questionable judgment, with missteps along the way resulting from the Fed’s overly optimistic and hawkish outlook.
Interestingly, though Trump criticized the Fed for keeping rates too low throughout the recovery, it’s higher rates, now, that are a significant threat to his growth policies. So he needs the Fed to step out of the way, and do no harm to the hand-off from a monetary policy-driven recovery, to a fiscal policy driven-recovery. Higher rates can choke off the positive effects of tax cuts and government spending.
On that note, his friend on monetary policy should be (and I think will be) Neel Kashkari (a new Fed member). Kashkari has been the lone dissenter on the Fed’s tightening path, arguing along the way to let the economy run hot, to ensure a robust recovery, before moving on rates.
Over the past two years, Yellen has blamed their pauses in their tightening program to the lack of evidence that the economy is overheating. It’s safe to say that the economy is not overheating (nor has it been), with both growth and inflation still undershooting long run averages.
As I said on Friday, people continue to look for what could bust the economy from here, and are missing out on what looks like the early stages of a boom.
We constantly hear about how the fundamentals don’t support the move in stocks. Yet, we’ve looked at plenty of fundamental reasons to believe that view (the gloom view) just doesn’t match the facts.
Remember, the two primary sources that carry the megahorn to feed the public’s appetite for market information both live in economic depression, relative to the pre-crisis days. That’s 1) traditional media, and 2) Wall Street.
As we know, the traditional media business, has been made more and more obsolete. And both the media, and Wall Street, continue to suffer from what I call “bubble bias.” Not the bubble of excess, but the bubble surrounding them that prevents them from understanding the real world and the real economy.
As I’ve said before, the Wall Street bubble for a very long time was a fat and happy one. But the for the past ten years, they came to the realization that Wall Street cash cow wasn’t going to return to the glory days. And their buddies weren’t getting their jobs back. And they’ve had market and economic crash goggles on ever since. Every data point they look at, every news item they see, every chart they study, seems to be viewed through the lens of “crash goggles.” Their bubble has been and continues to be dark.
Also, when we hear all of the messaging, we have to remember that many of the “veterans” on the trading and the news desks have no career or real-world experience prior to the great recession. Those in the low to mid 30s onlyknow the horrors of the financial crisis and the global central bank sponsored economic world that we continue to live in today. What is viewed as a black swan event for the average person, is viewed as a high probability event for them. And why shouldn’t it? They’ve seen the near collapse of the global economy and all of the calamity that has followed. Everything else looks quite possible!
Still, as I’ve said, if you awoke today from a decade-long slumber, and I told you that unemployment was under 5%, inflation was ultra-low, gas was $2.60, mortgage rates were under 4%, you could finance a new car for 2% and the stock market was at record highs, you would probably say, 1) that makes sense (for stocks), and 2) things must be going really well! Add to that, what we discussed on Friday: household net worth is at record highs, credit growth is at record highs and credit worthiness is at record highs.
We had nearly all of the same conditions a year ago. And I wrote precisely the same thing in one of my August Pro Perspective pieces. Stocks are up 17% since.
And now we can add to this mix: We have fiscal stimulus, which I think (for the reasons we’ve discussed over past weeks) is coming closer to fruition.
Join our Billionaire’s Portfolio today to get your portfolio in line with the most influential investors in the world, and hear more of my actionable political, economic and market analysis. Click here to learn more.
We’ve past yet another hurdle of concern for markets this past week. Last Friday this time, we had a potential catastrophic category 5 hurricane projected to decimate Florida.
Though there was plenty of destruction in Irma’s path, the weakening of the storm through the weekend ended in a positive surprise relative what could have been.
So we end with stocks on highs. And remember, we’ve talked over past month about the quiet move in copper (and other base metals) as a signal that the global economy (and especially China) might be stronger than people think. Reuters has a piece today where they overlay a chart of economist Ed Yardeni’s “boom-bust barometer” over the S&P 500. It looks like the same chart.
What does that mean? The boom-bust barometer measures the strength of industrial commodities relative to jobless claims. Higher commodities prices and lower unemployment claims equals a rising index as you might suspect (i.e. suggesting economic boom conditions, not bust). And that represents the solid fundamental back drop that is supporting stocks.
With that in mind, consider this: In the recent earnings quarter, earnings and revenue growth came in as good as we’ve seen in a long time for S&P 500 companies. We have 4.4% unemployment. The rise in equities and real estate have driven household net worth to $94 trillion – new record highs and well passed the pre-crisis peaks (chart below).
Now, people love to worry about debt levels. It’s always an eye-catching headline.
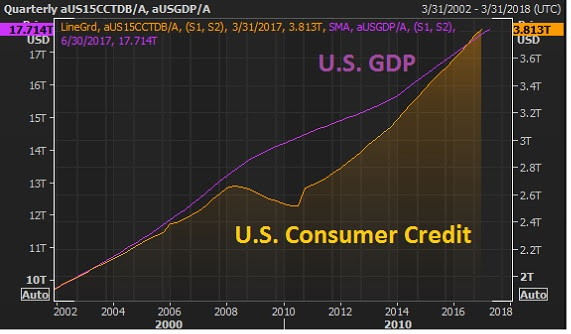
But what happens to be the key long-term driver of economic growth over time? Credit creation (debt). The good news: The appetite for borrowing is back. And you can see how closely GDP (the purple line, economic output) tracks credit growth.
Meanwhile, and importantly, consumers have never been so credit worthy. FICO scores in the U.S. have reached all-time highs. So despite what the media and some of Wall Street are telling us, things look pretty darn good. Low interests have produced recovery, without a ramp up in inflation.
But as I’ve said, it has proven to have its limits. We need fiscal stimulus to get us over the hump – on track for a sustainable recovery. And we now have, over the past two weeks, improving prospects that we will see fiscal stimulus materialize — i.e. policy execution in Washington.
To sum up: People continue to look for what could bust the economy from here, and are missing out on what looks like the early stages of a boom.
Stocks are sliding more aggressively today. Wall Street and the media always have a need to assign a reason when stocks move lower. There have been plenty of negatives and uncertainties over the past seven months — none of which put a dent in a very strong opening half for stocks.
But markets don’t go straight up. Trends have retracements. Bull markets have corrections. And despite what many people think, you don’t need a specific event to turn markets. Price can many times be the catalyst.
If we look across markets, it’s safe to say it doesn’t look like a market that is pricing in nuclear war. Gold is higher, but still under the highs of a month ago. The 10 year yield is 2.21%. Two weeks ago, it was 2.22%. That doesn’t look like global capital is fleeing all parts of the world to find the safest parking place.
Now, on the topic of North Korea, the media has found a new topic to obsess about– and to obsessively denounce the administration’s approach. With that, let’s take a look at the Trump geopolitical strategy of calling a spade a spade.
As we know, Mexico was the target heading into the election. Trump’s tough talk against illegal immigration and drug trafficking drew plenty of scrutiny. People feared the protectionist threats, especially the potential of alienating the U.S. from its third biggest trading partner. We’re still trading with Mexico. And the U.S. is doing better. So is Mexico. Mexican stocks are up 11% this year. The Mexican currency is up 13% this year.
China has been a target for Trump. He’s been tough on China’s currency manipulation and, hence, the lopsided trade that contributed heavily to the credit crisis. Despite all of the predictions, a trade war hasn’t erupted. In fact, China has appreciated its currency by 5% this year. That’s a huge signal of compliance. That’s among the fastest pace of currency appreciation since they abandoned the peg against the dollar more than 12 years ago (which was China’s concession to threats of a 30% trade tariff that was threatened by two senators, Schumer and Graham, back in 2005). And even in the face of a stronger currency (which drags on exports, a key driver of the economy), stocks are up 5% in China through the first seven months of the year.
Bottom line: It’s fair to say, the tough talk has been working. There has been compromise and compliance. So now Trump has stepped up the pressure on North Korea, and he has been pressuring China, to take the side of the rest of the world, and help with the North Korea situation – and through China is how the North Korea threat will likely get resolved.
Join our Billionaire’s Portfolio and get my most recent recommendation – a stock that can double on a resolution on healthcare. Click here to learn more.
Yesterday we talked about the Draghi remarks (head of the European Central Bank) that were intended to set expectations that the ECB might be moving toward the exit doors on QE and zero interest rate policy. That bottomed out global rates — which popped U.S. rates further today. The Bank of England piled on today, talking about rate normalization soon.
We’ve gone from 2.12% in the U.S. ten year yield to 2.25% in about 24 hours. These are big swings in the interest rate market – a big bounce and, as I’ve said, the bottom appears to be in for rates.
As importantly, this prepared speech by Draghi could very well cement the top in the dollar. It begins to tighten a very wide interest rate spread between the U.S. and global rates. We entered the year with the Fed going one way (tightening) while the rest of the world was going the other way (easing). That’s a recipe for capital to storm into U.S. assets — into the dollar. And now that may be over.
I’ve been researching long-term cycles in the dollar for a very long time and throughout the global financial crisis period, it these cycles in the world’s reserve currency have been my guidepost for drawing a lot of conclusions on markets and the outlook for capital flows over the past several years.
Despite the choppiness in the dollar for much of the crisis, if we look back at the cycles following the failure of the Bretton Woods system, we were able, very early on, to determine the dollar was in a bull cycle.
This view came in the face of all of the negative global sentiment toward the dollar in 2010. Foreign leaders were taking shots at the Fed, accusing the Fed of trying to destroy the dollar. People were calling for the end of the dollar as the world’s reserve currency. All the while, the dollar held firm and ultimately made an aggressive climb.
Take a look below at my chart on the long term dollar cycles…
I’ve watched this chart for quite some time, defining the five complete dollar cycles over the past nearly 40 years, and the most recent bull cycle.
If we mark the top of the most recent cycle in early January, this bull cycle has matched the longest cycle in duration (at 8.8 years) and comes in just shy of the long-term average performance of the five complete cycles. The most recent bull cycle added 47%. The average change over a long term cycle has been 56%. This all argues that the dollar bull cycle is over. And a weaker dollar is ahead. That should go over very well with the Trump administration.
Join the Billionaire’s Portfolioto hear more of my big picture analysis and get my hand-selected, diverse stock portfolio following the lead of the best activist investors in the world.
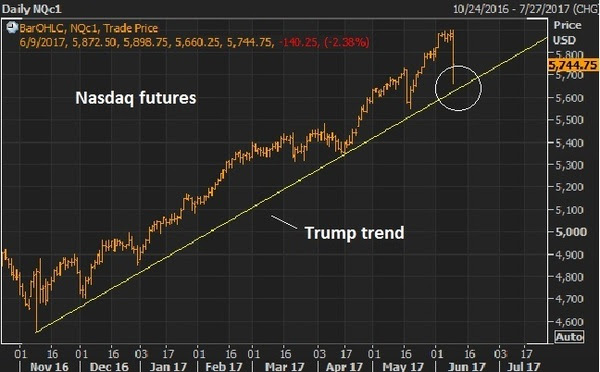
The Nasdaq trade unwound some today. From the peak this morning in the futures of 5898 the tumble started around 11am, falling to as low as 5660. That’s 238 Nasdaq futures points or 4% – quite a sharp move.
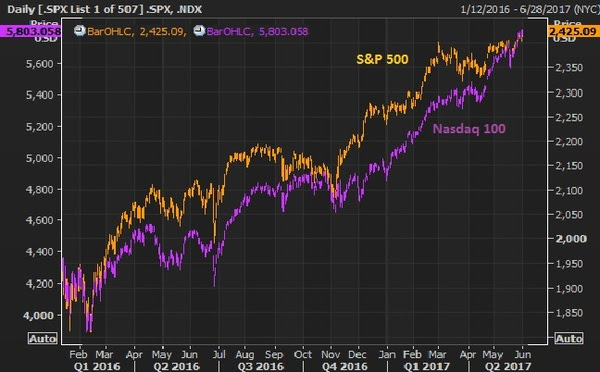
Remember, it seems like an overdone trade (driven by the big tech stocks). But as we discussed last week, the tech heavy Nasdaq has simply been a catch up trade — something that has lagged the strength in the broader market.
Here’s the chart we looked at last week.
This chart goes back to the lows driven by the oil price crash that bottomed out earlier last year.
Still, with the Nasdaq at +18% ytd and S&P 500 +9% ytd, as of this morning, as we’ve seen many times in this post-crisis era, the air pockets of illiquidity in stocks can give back gains very, very quickly. As they say, stocks go up on an escalator and down in an elevator.
The Trump trend, in the chart above, was nearly tested today — the same day a new all-time high was marked!
If we get another few days of sharp downside, it will be a tremendous buying opportunity – get your shopping list ready. And if that downside slide does indeed come, it could come at a very interesting time. It would add another (but very signficant) reason the Fed may balk on a rate hike next week. The other reasons? We discussed them yesterday (here).
Have a great weekend.
What stocks should be on your shopping list, to buy on a big market dip? Join my Billionaire’s Portfolio to find out. It’s risk-free. If for any reason you find it doesn’t suit you, just email me within 30-days.
Join the Billionaire’s Portfolio to hear more of my big picture analysis and get my hand-selected, diverse stock portfolio following the lead of the best activist investors in the world.As we end the week, we have some remarkable market and economic conditions. U.S. stocks printing new record highs by the day. Yields today broke down. The 10 year yield now trades 2.15%. Oil is under $50.We’re set up to massively stimulative fiscal policies launch into an economic environment that is about as primed as it can possibly get.The stock market is at record highs. The unemployment rate is 4.3%. Inflation is low. Gas is cheap ($2.38), and stable. Mortgage rates are under 4%, and stable. You can borrow money at 2% (or less) to buy a car.
This has all put consumers in as healthy a position as they’ve been in a long time.
As I’ve said, the two key tools the Fed used to engineer a recovery was housing and stocks. That restores wealth, which restores confidence, which gets people spending, hiring and investing again. So stocks are at record highs. And housing (as you can see in the chart below) continues to climb back toward pre-crisis levels.
As a result, we have well recovered and surpassed pre-crisis levels in household net worth, and sit at record highs …
What is the key long-term driver of economic growth over time? Credit creation. In the next chart, you can see the sharp recovery in consumer credit (in orange) since the depths of the economic crisis. This excludes mortgages. And you can see how closely GDP (the purple line, economic output) tracks credit growth.
So credit is back on track. Meanwhile, consumers have never been so credit worthy. FICO scores in the U.S. have reached all-time highs.
With all of this said, the consumer looks strong, but the big missing link and structural drag on the economy in this story has been wage growth. What’s the solution? A corporate tax cut. The biggest winners in a corporate tax cut are workers. The Tax Foundation thinks a cut in the corporate tax rate would double the current annual change in wages.
So think about this backdrop. If I told you at any point in history that these were the conditions, you would probably tell me that the economy was already in, or will be in, an economic boom period. I think it’s coming. And it will drive earnings significantly, which will make the valuation on stocks cheap.
What stocks are cheap?Join me today to find out what stocks I’m buying in my Billionaire’s Portfolio. It’s risk-free. If for any reason you find it doesn’t suit you, just email me within 30-days.
The past few days we’ve looked at the run up in bitcoin. Remember, I said: “If you own it, be careful. The last time the price of bitcoin ran wild, was 2013. It took about 11 days to triple, and about 18 days to give it all back. This time around, it’s taken two months to triple (as of today). ”
It looks to be fueled by speculation, and likely Chinese money finding its way out of China (beating capital controls). And yesterday we talked about the potential disruption to global markets that could come with a crash in bitcoin prices.
I suspect that’s why gold is finally beginning to move today, up almost 1%, and among the biggest movers of the day as we head into the long holiday weekend (an indication of some money moving to gold to hedge some shock risk).
Remember yesterday we looked at the chart on Chinese stocks back in 2015 and compared it to bitcoin. The speculative stock market frenzy back thin was pricked when the PBOC devalued the yuan later in the summer.
Probably no coincidence that bitcoin’s recent acceleration happened as Moody’s downgraded China’s credit rating this week for the first time since 1989 (an event to take note of). Yesterday, the PBOC was thought to be in buying Chinese stocks (another event to take note of). And this morning, the PBOC stepped in with another currency move! Historically, major turning points in markets tend to come with some form of intervention. Will a currency move be the catalyst to end the bitcoin run, as it did the runup in Chinese stocks two years ago?
Let’s take a look at what the currency move overnight means …
Keep in mind, the currency is China’s go-to tool for fixing problems. And they have problems. The economy is crawling around recession like territory. The debt was just downgraded. And they’ve had a tough time managing capital flight. As an easy indicator: Global stocks are soaring. Chinese stocks are dead (flat on the year).
Remember, their rapid economic ascent in the world came through exports (via a weak currency). The move overnight is a move back toward tying its currency more closely to the dollar. Which, if this next chart plays out, will also weaken the yuan compared to other big exporting competitors in the world.
That should help the Chinese economic outlook, which may help stem the capital flight (which has likely been a significant contributor to bitcoin’s rise).
We talked yesterday about run up in bitcoin. The price of bitcoin jumped another 14% today before falling back.
As I said yesterday, it looks like Chinese money is finding it’s way out of China (despite the capital controls) and finding a home in bitcoin (among other global assets). If you own it, be careful. The last time the price of bitcoin ran wild, was 2013. It took about 11 days to triple, and about 18 days to give it all back. This time around, it’s taken two months to triple (as of today).
If you’re looking for a warning signal on why it might not be sustainable (this bitcoin move), just look at the behavior across global markets. It’s not exactly an environment that would inspire confidence.
Gold is flat. Interest rates are soft. Stocks are constantly climbing. Commodities are quiet, except for oil — which fell back below $50 today on news that OPEC did indeed agree to extend its production cuts out to March of next year (bullish, though oil went south).
When the story is confusing, conviction levels go down, and cash levels go up (i.e. people de-risk). And maybe for good reason.
In looking at the bitcoin chart today, I thought back to the run up in Chinese stocks in early 2015. Here’s a look at the two charts side by side, possibly influenced by a lot of the same money.
The crash in Chinese stocks took global markets with it. It’s often hard to predict that catalyst that might prick a bubble and even harder to see the links that might lead to broader market instability. In this case, though, there are plenty of signs across markets that things are a little weird.
Invitation to my daily readers: Join my premium service members atBillionaire’s Portfolio to hear more of my big picture analysis and get my hand-selected, diverse stock portfolio where I follow the lead of the best activist investors in the world. Our goal is to do multiples of what broader stocks do. Our portfolio was up 27% in 2016. Join me today, risk-free. If for any reason you find it doesn’t suit you, just email me within 30-days.

 Forbes has just ranked the top 400 richest people in America for 2017.
 Stocks open the week with another record high. The dollar continues to do better. And as we open the new month, yields are now up 32 basis points from the lows of early last month.


 Join the


