
|

|
January 31, 5:00 pm EST With the Fed officially on hold, asset prices continue to lift-off. But with U.S./China talks concluding today, there was the potential for a spoiler. Trump quickly stepped in front of that risk this morning, saying that no final deal would be made until he and President Xi meet “in the very near future.” So the expectations of a final “yea or nay” on a China deal today were managed down. And with that, the recovery in global markets finished the month of January on a strong note. What a difference a month makes. In December, people were beginning to worry that collapsing global financial markets would kill the global economic recovery — and maybe fuel another financial crisis. A month later, and the S&P 500 sits just 2% lower than the close of November (before the December rout). And in January, almost every market is in the green (from stocks to bonds to commodities to currencies).
|
 |
|
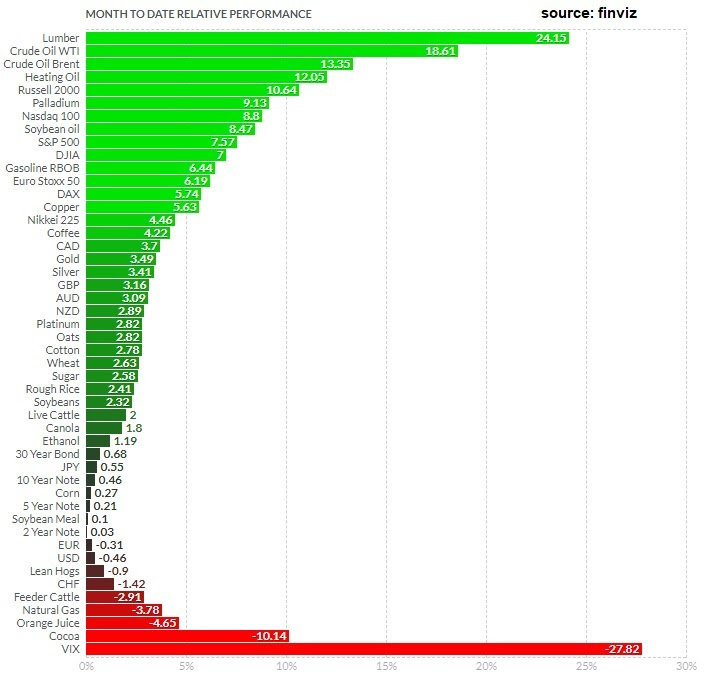
Remember, if we compare this to last year, cash was the best performing major asset class (returning just less than 2% in dollar terms). On Friday, we talked about the set up for a big run in commodities this year. Commodities continue to lead the way. Crude is up close to 20%on the month. Copper is up 6% for January (the commodity known to be a early indicator of turning points in the economy), and gold is up 3.5% just in the past week. We also end the month with another very solid opening to earnings season. Despite all of the pessimism of the past quarter. The Q4 earnings continue to beat expectations. Importantly, the widely held tech giants have posted good reports: Facebook, Apple and Amazon. Importantly, with the expectations bar set low coming into 2019 (for earnings, the economy and a China deal), I’d say we finish the first month of the year in position to exceed expectations on those fronts – thanks, in no small part, to the pivot by the Fed.
Join me here to get my curated portfolio of 20 stocks that I think can do multiples of what broader stocks do, coming out of this market correction environment.
|
|
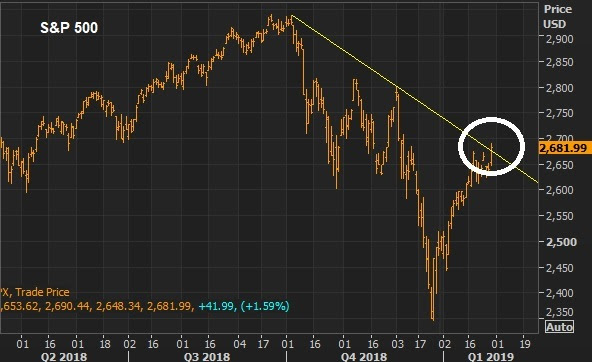
January 30, 5:00 pm EST Remember, over the past three weeks, the major central banks in the world (the Fed, the ECB and the BOJ) reminded us of the script they have followed, and continue to follow, since the global financial crisis. They will do ‘whatever it takes‘ to keep the economic recovery going. It took an ugly decline in stocks in December to resurrect the defensive stance from the architects of the decade-long global economic recovery. Confidence matters, as it relates to the economic outlook. And stocks heavily influence confidence. With that, the Fed raised the white flag on January 4th when they marched out Bernanke, Yellen and Powell at an economic conference to reset the market expectations on monetary policy (moving from a four rate hike forecast for 2019 to a ‘wait and see’ approach). They solidified that stance today. Removing this risk, of the Fed offsetting the benefits of fiscal stimulus, is continuing to prime global markets. And we get a break of this trendline today in stocks — from the correction that originated from the record highs of October. |
 |
|
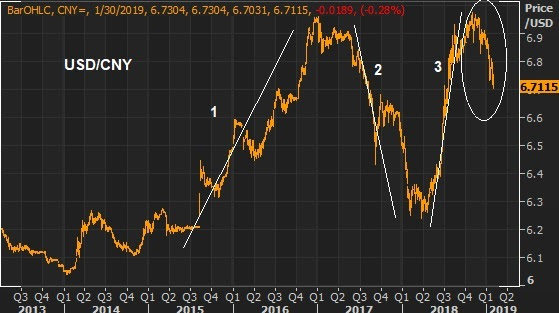
With the Fed behind us, the attention turns to the U.S./China meetings, which are underway. Let’s revisit the one indicator from China that they are working to pacify the Trump administration. It’s the Chinese currency. Remember, we looked at this chart back on January 11 of the U.S. dollar/Chinese yuan exchange rate … |
 |
|
In this chart, the falling orange line represents the Chinesestrengthening their currency. And, as we can see, they have been showing a willingness to make concessions, walking it higher since the December “trade truce.” Make no mistake, the trade war is all about China’s currency. Ultimately, a free floating currency in China would be the solution to the trade imbalances and dangerous wealth transfer of the past few decades. To this point, it has been reported that they are presenting a plan to balance trade with the U.S. in six years. Maybe currency is part of it. We shall see.
Join me here to get my curated portfolio of 20 stocks that I think can do multiples of what broader stocks do, coming out of this market correction environment.
|
|
January 29, 5:00 pm EST Today let’s take a look at the recent moves the U.S. administration has made against Venezuela, and what that means for oil prices. It was August of 2017, when Trump first stepped up pressure on Venezuela. Venezuela is (and has been) in a humanitarian, political and economic crisis–led by what the U.S. administration has officially called a dictator. Trump slapped sanctions on the Venezuelan President back in 2017 (freezing his U.S assets) and was said to be considering broad oil sanctions. That finally came yesterday (seventeen months later). For a country that relied heavily on oil exports (ninety-five percent of export revenues in Venezuela come from oil), the U.S. will no longer be sending money to Venezuela for oil. This is a crushing blow for an already suffering country. What does it mean for oil prices? Venezuela has the world’s largest oil reserves. With oil sanctions, should come supply disruptions for the oil market, which could likely send oil aggressively higher. Back in 2017, when Trump threatened sanctions, oil broke out of its $40-$55 range, and ultimately traded up to $76. Today, we’re nearing the top end of that same range. |
 |
|
Join me here to get my curated portfolio of 20 stocks that I think can do multiples of what broader stocks do, coming out of this market correction environment.
|
January 28, 5:00 pm EST
This is a huge week. We’re following a down 9% month for stocks with a big bounceback. But it will all hinge on the events of the week.
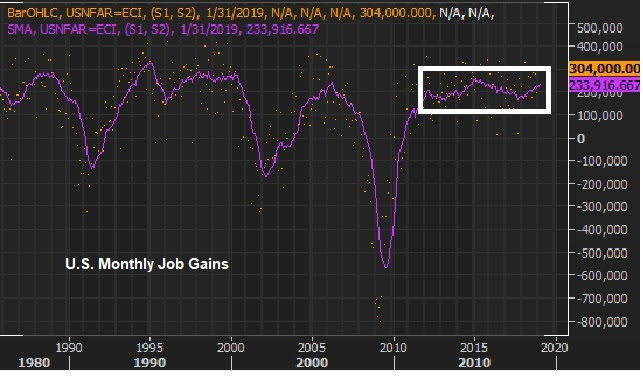
We get Q4 earnings from about quarter of the companies in the S&P 500 – and a third of the Dow. We have the Fed on Wednesday. And the U.S. hosts trade talk meetings with China on Wednesday and Thursday. And then on Friday, we’ll get the jobs report.
We kicked off earnings season with reports from the big banks two weeks ago. And the reports broadly painted the picture of a healthy consumer and healthy economy.
This week, we hear from a broad swath of blue chips, including big multinational businesses. Among them: We heard from Caterpillar today. We’ll hear from Apple and Boeing tomorrow. McDonalds and 3M report on Wednesday. Amazon is on Thursday.
Expect a lot of discussions about “concerns” on the outlook (as we heard from Caterpillar today), but with a picture about Q4 that looked good (continuing with the theme of 2018).
Remember, much of the talk about slowdown has been about what might happen, in the year (or two) ahead – which primarily assumes a long-term stalemate on the Trump trade war. With that, never underestimate Wall Street and corporate America’s willingness to set the bar low (when given the opportunity), so that they can jump over a very low bar (i.e. set up for earnings beats in future quarters).
Far more important than those “concerns” voiced by CEO’s, is what the Fed has already done, and what will come out of the U.S./China talks this week.
Remember on January 4th, the Fed responded to the calamity in financial markets by backing down from their rate hiking plans. This week, the Fed Chair will likely use his post-meeting press conference to further massage markets. The Fed, the ECB and the BOJ have already positioned themselves (in recent weeks) to be the shock absorbers if the trade war continues to drag out.
As for trade talks, the calendar continues to approach the March 1 deadline on the tariff truce. And China has been gasping for air. I suspect we will get progress — maybe an official agreement on trade, leaving the intellectual property and technology transfer negotiations still on the table. That would be good progress.
|


January 24, 5:00 pm EST
With two big central bank meetings behind us this week, and the Fed on deck for next week, let’s remind ourselves of where the global central banks stand, more than 10 years after the crisis.
There’s one thing we know, following the events of the past decade: The global central banks will do “whatever it takes” to preserve stability and manufacture economic growth. As long as global economies remain interconnected (which they are), this is the script they (global central banks, in coordination) will follow. They crossed the line long ago. There’s no turning back.
So, with all of the continual talk in past years about another big shock or “shoe to drop,” people have failed to acknowledge the key difference between the depths of the financial crisis and now. Back then, we didn’t know how policymakers would respond. That’s a lot of uncertainty. Now we know. They will change the rules when they need to. That removes a lot of uncertainty.
With this in mind, remember on January 4th, in response to an ugly December for the stock market, the Fed marched out Bernanke, Yellen and Powell to walk back on the tightening cycle. For a world that was expecting four rote rate hikes this year, that was an official response – effectively easing, intermeeting.
Next up, the Bank of Japan. They met this week. With the ECB now done with QE, the BOJ is now the lone global economic shock absorber. Not only have they been executing on their massive QQE plan since 2013, in 2016 they crafted a plan that gave them greenlight to do unlimited QE as long as their 10-year government bond yield drifted above the zero line. So, as global yields pull Japanese yields higher, the BOJ responds by buying bonds in unlimited amounts to push it all back down. That has been the anchor on global interest rates. And given that they see inflation continuing to run well below their target of 2%, through 2020, the BOJ will be printing for the foreseeable future (remaining that anchor on global interest rates).
What about Europe? A few months ago, some thought the ECB might be following the Fed footsteps — with a first post-QE rate hike by the middle of this year. Today, Draghi put that to bed, saying risks are now to the downside, and that the market has it right pricing in a rate hike for next year – assuming all goes well. But Draghi also wants us to know that the ECB stands ready to act if the economy falters (i.e. they can/will go the other way).
So, for perspective on where the global economy stands, we still have central banks pulling the levers to keep it all together. That’s why Trump’s big and bold fiscal stimulus and structural reform was/is absolutely necessary. And that’s why the rest of the world will likely have to follow the U.S., with fiscal stimulus, if we are to ultimately and sustainably put the crisis period behind us.
Join me here to get my curated portfolio of 20 stocks that I think can do multiples of what broader stocks do, coming out of this market correction environment.
|
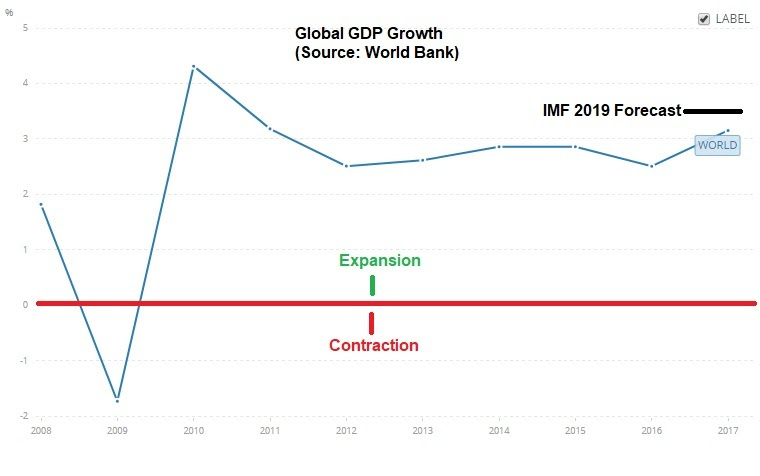
January 23, 5:00 pm EST The financial media has been focused on Davos this week — the host of the World Economic Forum, which is attended by the world’s top global government and corporate leaders. Coming off of an ugly December for global financial markets, it’s no surprise the conversation is all about “slowdown.” It’s an odd conversation, given that the U.S. economy is growing at 3%, corporate earnings are running at record levels, inflation is low and unemployment is low. Even the IMF could only justify a small markdown on their 2019 global GDP forecast — from an already high level. For perspective, the IMF is now looking for 3.5% growth for 2019. Here’s how that looks relative to the past ten years …. |
 |
|
So, what’s the story? As we discussed yesterday, it’s China, and the pressure of tariffs and reform demands on a vulnerable large economy that’s already drowning. And the broader view is that trade is being hampered by the Trump/China standoff – and therefore dragging on growth. With that in mind, listening to some interviews from Davos, the one that stuck out to me was the DHL CEO (the world’s leading mail and logistics company). He said trade is not at all on the back foot, rather its flowing more than ever before. So, the global growth slowdown talk is all about what might happen, not about what is happening. It’s about risk. With that, if China does make the concessions necessary to get a deal done (and they seem to have few options), we may end up getting a big upside surprise in global growth – especially given the very accomodative global monetary policy backdrop. Join me here to get my curated portfolio of 20 stocks that I think can do multiples of what broader stocks do, coming out of this market correction environment. |
|
January 22, 5:00 pm EST China reported the slowest growth since 1990 on Monday (+6.4%). This an interesting period to reference because, at that point, China was in the latter stages of executing on an economic plan. At the core of that plan was currency manipulation — i.e. devaluing it’s currency (i.e. trashing it) so that they would have a distinct advantage on price when competing for world exports (i.e. they would always be the cheapest). It worked. The Chinese economy grew at an average of 12% the following five years (1991-1995). From 1991 to 2009, leading up the global financial crisis, China grew at 10.5% annual rate. That’s 18-years of double-digit annualized growth, on average. That’s why the Chinese economy has ascended from a $350 billion economy to a $12 trillion economy since 1990. Here’s what that looks like in a chart …. |
 |
|
Thanks to decades of uncontested currency manipulation, China is now the second largest economy in the world and on pace to be the biggest soon (though it still has just an eighth of the per capita GDP as the U.S.). Why does it matter? When they maintain a cheap currency, to undercut the world on price, they become the world’s sellers to everyone. That means they accumulate a mountain of foreign currency as a result (which they have). China is the holder of the largestsforeign currency reserves in the world, at more than $3 trillion dollars (mostly U.S. dollars). What do they do with those dollars? They buy our Treasuries, which keeps our rates low, so that U.S. consumers can borrow cheap and buy more of their goods — adding to China’s mountain of currency reserves, adding to their wealth and depleting the U.S. of wealth. And so the cycle goes. This has proven to be a recipe for booms and busts (big busts), and a destructive global wealth transfer. So coming out of a decade long global economic slog, U.S. growth (driven by fiscal stimulus) has put us in a position of strength to negotiate reform in China. An economy running at 6% in China is recession territory and makes them vulnerable to an uprising against the regime. And trade tariffs put more and more downward pressure on the growth number. That’s why they’ve been willing to talk. Here’s what President Xi said yesterday about the ruling party’s outlook for retaining power in China: “The party is facing long-term and complex tests in terms of maintaining long-term rule, reform and opening-up, a market-driven economy, and within the external environment … The party is facing sharp and serious dangers of a slackness in spirit, lack of ability, distance from the people, and being passive and corrupt. This is an overall judgment based on the actual situation.” Join me here to get my curated portfolio of 20 stocks that I think can do multiples of what broader stocks do, coming out of this market correction environment. |
|
January 18, 5:00 pm EST Stocks and crude oil have led the bounce back this month. And we’re now getting more broad-based participation as market and economicsentiment rebounds. Global stocks are rising, and commodities are rising. Let’s take a look at some key charts as we end the week. Here’s a look at stocks … |
 |
|
Stocks continue to make this V-shaped recovery. A return to the December 3rd highs is another 5% from here. Remember, oil and stocks have been in a synchronized decline since October 3. The farther the fall (in both), the higher the rise in fears about deflationary pressures, prospects of an economic downturn and maybe even a financial crisis. But the tide has turned. And it was triggered by both Fed and Treasury actions. With that, as we’ve observed in this oil chart in recent weeks, the big break of the downtrend has unleashed what could be a very sharp rebound (maybe a V-shaped recovery for oil). |
 |
|
Keep in mind, at $76 oil we had an undersupplied market in a world with growing global demand. At $42 oil (the low), the fundamentals for much higher oil prices had only strengthened, with OPEC coming back to the table with more production cuts. Now, with reports that China is coming to the table with big trade concessions, commodities are beginning to reboot. |
 |
|
As I said last week, “what if this chart on commodities tells us that the decade that followed the financial crisis was indeed a depression, and central banks were only able to manufacture enough economic activity to buffer the pain (not a real economic expansion)? And now, instead of at the tail end of one of the longest economic expansions on record, we’re in the early stages of a real expansion, driven by fiscal policies and structural reform that has started in the U.S. and will be implemented abroad (Europe, Japan, China).” A trade deal may unlock a real global economic boom. While it might appear that China will be a big loser in any trade deal with the U.S., relative to where they stood Pre-Trump, being forced to move toward a balanced domestic economy, and fair trade, would position China to be a legitimate long-term player in the global economy. With that in mind, Chinese stocks look like a very compelling buy … |
 |