
|
|
|
|
April 11, 5:00 pm EST As we came into the week, the economic, political and corporate calendar was relative light. With that, I suspected markets would be relatively quiet. Of course we have had an ECB meeting and minutes from the Fed. Often, these would be market moving events. Not this week. As we discussed yesterday, we clearly know where they stand. So, what’s next? Earnings. First quarter earnings season kicks off next week. We’ll hear from the major banks. Earnings will be the catalyst for where stocks go from here – and banks will set the tone. The building theme has been “earnings recession.” After 20%+ earnings growth in 2018, following a historic corporate tax cut, anyone would expect earnings growth to be less hot than last year. Some were even predicting that the hot numbers of last year would be a peak in earnings growth. After all, under ordinary circumstances (in a stable economic environment) we’re very unlikely to see the U.S. stock market grow earnings by excess of 20%. That’s not much of a story . But the media loved the shock value of the phrase “peak earnings” last year, and ran it in headlines, conveniently excluding the word “growth.” Peak earnings is very different than peak earnings growth. Still, the broad market sentiment on future corporate earnings eroded through the end of 2018, and has continued to erode through 2019. And both Wall Street and corporate America are more than happy to ride the coattails of lower sentiment by lowering the expectations bar on earnings. When sentiment is leaning that way already, there is little-to-no penalty for lowering the bar. That just sets the table for positive surprises. They did it for Q4 2018 earnings. And they beat expectations. And they have set the table for positive surprises for Q1 2019 earnings. Just how low has the bar been set for Q1? Before stocks unraveled in December, Wall Street was looking for 8.3% earnings growth for 2019. Now they are looking for less than half that. Moreover, they have projected earnings to contract in Q1 compared to the same period a year ago (i.e. at least a short-term peak in earnings).
Will they be right?
Well, the Atlanta Fed’s real-time model for estimating GDP has Q1 GDP coming in at 2.3%. The economy added on average 173,000 jobs a month over the first quarter. Both manufacturing and services PMIs expanded in the quarter, and stocks fully recovered the losses from December. That’s a formula for earnings growth, no contraction.
|
|
If you haven’t signed up for my Billionaire’s Portfolio, don’t delay … we’ve just had another big exit in our portfolio, and we’ve replaced it with the favorite stock of the most revered investor in corporate America — it’s a stock with double potential. Join now and get your risk free access by signing up here. |
|
April 10, 5:00 pm EST The minutes were released from the March Fed meeting today. But we already know very clearly where they stand. Remember, they spent the better part of the first three months of the year marching out Fed officials (one after another) to give us a clear message that they would do nothing to kill the economic recovery. Just in case there was any question, Jay Powell stepped in just ahead of the March Fed meeting with an exclusive 60 Minutes interview, where he spoke directly to the public, to reassure everyone that the economy was in good shape, and that the Fed was there to promote stability (i.e. rates on hold and even prepared to act if the environment were to turn for the worse). As expected, the ECB echoed that position today, following their meeting on monetary policy. As we’ve discussed, the major global central banks have again coordinated both messaging and policy to ward off an erosion of confidence in the global economy. No surprises. And I’m sure managing the U.S. 10-year yield has been part of that coordinated response. In addition to the speculative flows that have pushed yields lower, I suspect there has been a healthy dose of central bank buying (Bank of Japan and others through sovereign wealth funds). With that, even though stocks have bounced back, commodities are on the move, and we’ve had improvements in global economic data, we still have European 10-year yields (Germany) at zero and U.S. yields at 2.50%. That is promoting the global central bank stability plan. |
|
Sign up to my Billionaire’s Portfolio and get my market beating Billionaires Portfolio … Live Portfolio Review conference calls … Weekly notes with updates and specific recommendations on following the best billionaire investors … Access to my member’s only area on the Billionaire’s Portfolio. Plus, my blog — full of information that will set you apart from other average investors. Join now and get your risk free access by signing up here. |
|
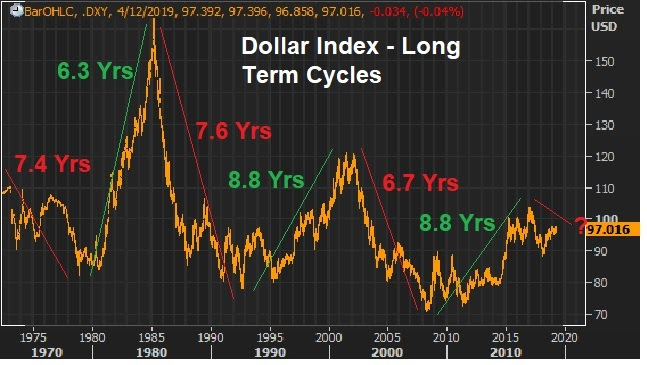
April 9, 5:00 pm EST A key piece in the continuation of the global economic recovery will be a weaker dollar. It will drive a more balanced U.S. and global economy, and it will reflect strength in emerging markets (i.e. capital flows to emerging markets). To this point, as we’ve discussed, higher U.S. rates have meant a stronger dollar. With global central banks moving in opposite directions in recent years, capital has flowed to the United States. But the emerging markets have suffered under this dynamic. As money has moved OUT of emerging market economies, their economies have weakened, their currencies have weakened, and their foreign currency denominated debt has increased. But now we have a retrenchment from the Fed. And we have coordinated global monetary policy (facing in the same direction). This sets up to solidify a long-term bear market for the dollar. Let’s take a look at a couple of charts that argue the long-term trend is already lower, and the next leg will be much lower. First, here’s a revisit of the long-term dollar cycles, which we’ve looked at quite a bit in this daily note. Since the failure of the Bretton-Woods system, the dollar has traded in six distinct cycles – spanning 7.6 years on average. Based on the performance and duration of past cycles, the bull cycle is over, and the bear cycle is more than two years in. |
 |
|
With this in mind, if we look within this current bear cycle, technically the dollar is trading into a major resistance area – a 61.8% retracement. The next leg should be lower, and for a long period of time. |
 |
|
Trump wants a weaker dollar, and I suspect he’s going to get it.
Sign up to my Billionaire’s Portfolio and get my market beating Billionaires Portfolio … Live Portfolio Review conference calls … Weekly notes with updates and specific recommendations on following the best billionaire investors … Access to my member’s only area on the Billionaire’s Portfolio. Plus, my blog — full of information that will set you apart from other average investors. Join now and get your risk free access by signing up here. |
April 8, 5:00 pm EST
As we discussed on Friday, the overhang of risks to markets, to the Trump administration and to the economy are as light as we’ve seen in quite some time.
With this in mind, we have a fairly light data week – which means the likelihood of a disruption in the rise in stocks and risk appetite remains low.
We get some inflation data this week, which should be tame, justifying the central bank dovishness we’ve seen in recent months. The ECB meets this week. They’ve already walked back on the idea that they might hike rates this year. Expect Draghi to hold the line on that. The Chinese negotiations have positive momentum, with reports over the weekend that talks last week advanced the ball. And we have another week before Q1 earnings season kicks in.
So, expect the upward momentum to continue for stocks. Just three months into the year and stocks are up big, and back near record highs in the U.S.. The S&P 500 is up 15% year-to-date. The DJIA is up 13%. Nasdaq is up 20%. German stocks are up 13%. Japanese stocks are up 11%. And Chinese stocks are up 32%.
Remember, we’ve talked about the signal Chinese stocks might be giving us, putting in a low on the day the Fed did it’s about face on the rate path, back on January 4th.
The aggressive bounce we’ve since had in Chinese stocks appears to be telegraphing the bottoming in the Chinese economy. That’s a big relief signal for the global economy. Commodities prices are supporting that view (sending the same signal). Oil is now up 42% on the year. And the CRB industrial metals index is up 24%.
Sign up to my Billionaire’s Portfolio and get my market beating Billionaires Portfolio … Live Portfolio Review conference calls … Weekly notes with updates and specific recommendations on following the best billionaire investors … Access to my member’s only area on the Billionaire’s Portfolio. Plus, my blog — full of information that will set you apart from other average investors.
Join now and get your risk free access by signing up here.
April 5, 5:00 pm EST
As we end the week, the overhang of risks to markets, the Trump administration and the economy are as light as we’ve seen in quite some time.
With that, stocks are back within sniffing distance of record highs. And I suspect it’s just getting started.
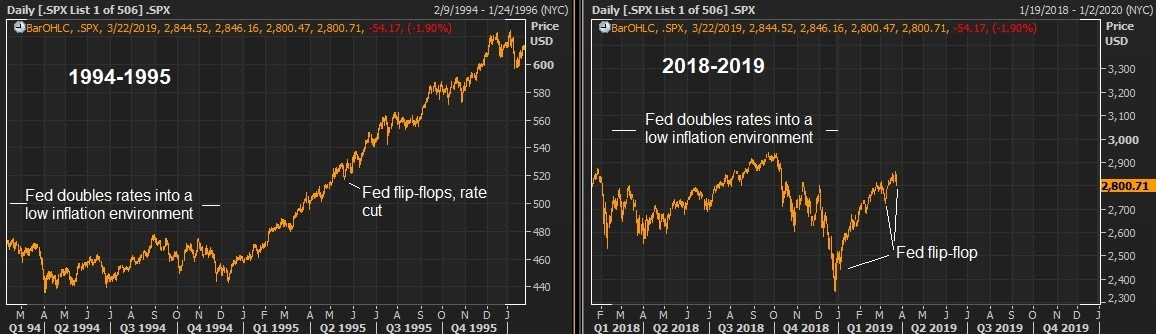
Remember, we’ve talked a lot about the comparisons between today and 1995. But we should also acknowledge how things played out through 2000, after the Fed backtracked on errant policy in the mid-90s.
Let’s revisit an excerpt from my daily notes on the topic …
“Last year (2018) was the first year since 1994 that cash was the best producing major asset class (among stocks, real estate, bonds, gold). The culprit for such an anomaly: An overly aggressive Fed, tightening into a low inflation, recovering economy.
The Fed ended up cutting rates by 1995, and that spurred a huge run up in stocks (up 36%). Fast forward: we now (too) have a Fed that has been overly aggressive, tightening into a low inflation, recovering economy. And just as they did in 1995, the Fed is now doing an about face. Given where the Fed has positioned itself now, compared to just three months ago, I would argue we already have a repeat of 1995 from the Fed … Within a few quarters of the 1995 rate cut, U.S. growth was printing above 4% and did so for 18 consecutive months. Stocks TRIPLED over that period.”
So, just as people are arguing that the expansion cycle of the past decade is coming to an end, we may very well see that the real boom is just getting started.
We continue to have tailwinds of fiscal policy, deregulation and structural reform still working through the economy. And the Fed has now given us the greenlight, with policies designed to fuel higher stock prices!
These are the moments when real wealth can be created in stocks. I want to make sure you are acting, not watching from the sidelines.
With that, today I want to offer you a peak at my premium advisory service for zero risk.
Sign up today and look through my entire portfolio of stocks, all of which are vetted and owned by the best billionaire investors in the world. Listen to my recorded “Live Monthly Portfolio Reviews.” Read all of my past notes to my subscribers. Take it all in. If you find that it doesn’t suit you, just email me within 30 days and I’ll refund your money in full immediately.
Frankly, I know when people join this service, they don’t leave. In fact, they refer their friends. If you can read a weekly note from me, I can help you make money.
You’ll get my market beating Billionaires Portfolio … Live Portfolio Review conference calls … Weekly notes with updates and specific recommendations on following the best billionaire investors … Access to my member’s only area on the Billionaire’s Portfolio. Plus, my blog — full of information that will set you apart from other average investors.
Join now and get your risk free access by signing up here.
|

|