We’ve talked about the prospects of the Fed surprising tomorrow.
Maybe beating the Fed to the punch, we had a surprise this morning–from Europe. In a prepared speech at an ECB forum today, Mario Draghi telegraphed more monetary stimulus to come and maybe soon. Cutting rates would take euro zone rates into negative territory. They could also restart QE–adding to an already $3 trillion worth of assets they purchased between 2015 and 2018.
That news sent stocks and commodities higher this morning, and global rates lower.
But keep in mind, a powerful tool used by the key central banks in the world over much of the past decade has been tough talk. It has been especially effective for the ECB. Draghi fought off a speculative attack on the vulnerable European soveriegn debt market in 2012 by promising to do “whatever it takes.” That was a specific threat to buy unlimited Spanish and Italian government bonds to crush the speculators that had run rates up to unsustainable levels. The threat worked and government bond yields in Italy and Spain fell sharply, avoiding what looked like a cascade of debt defaults in Europe. He didn’t have to buy a single bond, until 2015, when the ECB was ultimately forced to follow the Fed and BOJ with QE.
What about this time? Is it talk or is the ECB ready for more action?
Probably the latter, especially given the likelihood that the Fed has ended its tightening cycle and has prepared markets for a rate cut.
Still, the news from the ECB today makes it clear that the two major central banks (the Fed and the ECB) are now focused on creating tailwinds for their respective economies (again) rather than creating headwinds. And this positioning is all dependent upon the direction Trump’s trade war with China takes.
On that note, Trump announced this morning that talks with China are back on. That’s good news for markets. The question is, is Trump ready to do a deal? Has the interest rate market already given Trump the rate cut he has wanted? We go into the Fed meeting tomorrow with the 10-year yield trading almost 125 basis points lower than it was in just November of last year. And the last move the Fed made was a hike.
As we discussed last week, if the Fed wants to surprise markets and get maximum gain from a rate cut, it would serve them well to cut rates on Wednesday, and not wait until the July meeting.
As we head into the meeting, the market is pricing in just a 20% chance of a cut. That seems well underpriced, given that there’s a near certainty of them moving next month. A surprise cut would be rocket fuel for the stock market.
With the Fed looking to reverse course on monetary policy, more than a decade removed from the failure of Lehman Brothers, we still still have 60% of global central banks in easing mode, with full-bore quantitative easing in Japan.
That said, the Fed is looking for what will likely be an “insurance cut” — just to solidify the economic expansion. And if a Fed cut is followed by trade resolution, the U.S. economy could/should be in for a boom period. And that would likely flip the switch on global monetary policy.
If you haven’t signed up for my Billionaire’s Portfolio, don’t delay … we’ve just had another big exit in our portfolio, and we’ve replaced it with the favorite stock of the most revered investor in corporate America — it’s a stock with double potential.
Join now and get your risk free access by signing up here.
Next week we have the three central bank meetings on the agenda: the Fed, the Bank of Japan and the Bank of England.
The market is still pricing in just a 25% chance that the Fed will cut rates on Wednesday. But as we’ve discussed, I suspect that Trump wants and needs a move from the Fed at their June 19 meeting. The G20 meeting comes later this month (June 29-30) where Trump and Xi are expected to have a sit-down to discuss the trade deal. With a rate cut under his belt, Trump might feel more compelled to claim victory on the China trade talks and do the deal, giving himself enough runway into the 2020 elections to have a booming stock market and booming economy.
As we head into the weekend, let’s take a look at some key charts …
Here’s a look at stocks …
We’ve had a 6.7% bounce in stocks since Jay Powell (the Fed Chair) signaled that the Fed was prepared to act, if necessary, to sustain the economic expansion. As we’ve discussed, ironically the better stocks do, the less likely it is that we will see a Fed rate cut. With that said, Trump kept a lid on stocks this past week by ramping up the rhetoric on China.
What message is the interest rate market giving? Not as comfortable a mood as we’re getting from stocks. Here’s a look at interest rates …
Yields traded back down to the two-year lows today (below 2.06% on the 10-year government bond yield). And German yields traded down to new record lows today (-27 bps).
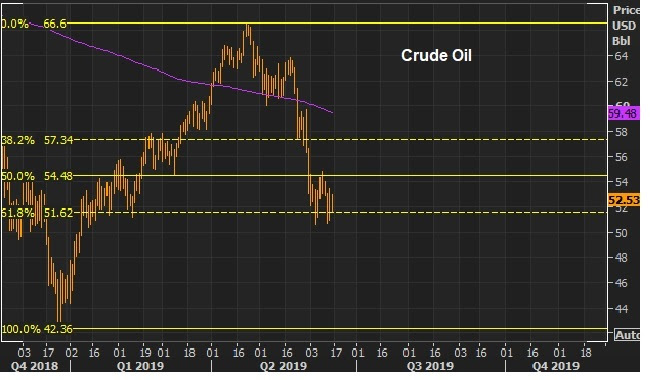
And here’s a look at crude oil, which closes the week up a couple of bucks from the worst levels of the week …
But we had another run at the important $50 level on Wednesday. As we discussed this week, the prospects of a break below $50 in oil has to be factored into the Fed’s view on inflation (i.e. it creates downward pressures) and for vulnerabilities in the economy.
So, this past week we revisited the lows of the recent declines in rates and oil. But stocks held steady, well above the June 3 lows.
I suspect we’ll see weaker stocks into Wednesday’s Fed meeting. If the Fed wants to surprise markets and get maximum gain from a rate cut, it would serve them well to cut rates on Wednesday, and not wait until the July meeting (where the market is pricing in a near certainty of a cut).
If you haven’t signed up for my Billionaire’s Portfolio, don’t delay … we’ve just had another big exit in our portfolio, and we’ve replaced it with the favorite stock of the most revered investor in corporate America — it’s a stock with double potential.
Join now and get your risk free access by signing up here.
Yesterday we talked about the plunge in oil prices and the importance of holding above the big $50 level. And oil gets a big bounce back today on the Iranian attack of two oil tankers in the Middle East.
Iran has made threats, in the past, to choke off global oil supply in the narrow strait (Hormuz) that about 30% of the world’s crude oil passes through. Today’s attack follows an attack on Saudi tankers last month. So Iran is posturing to deliver on threats of disrupting global oil supply.
This all stems, of course, from Trump’s efforts to bring Iranian oil exports to zero (sanctions that were upgraded back in April) — to get them back to the negotiating table on weapons of mass destruction.
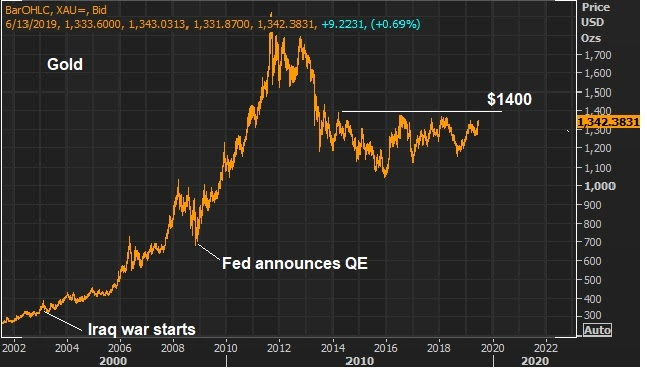
Without getting into speculation of where this will end, let’s just take a look at gold, which has gotten a renewed “fear of the unknown” bid this month. A conflict with Iran would fall into that category. In an interview yesterday, the great macro trader Paul Tudor Jones called gold his favorite trade over the next 12-24 months (for a number of reasons). He said if it breaks $1,400, it will quickly push to $1,700.
If you haven’t signed up for my Billionaire’s Portfolio, don’t delay … we’ve just had another big exit in our portfolio, and we’ve replaced it with the favorite stock of the most revered investor in corporate America — it’s a stock with double potential.
Join now and get your risk free access by signing up here.
Remember, last week we talked about why $50 is a very important level for oil.
A recent Dallas Fed survey has the breakeven level for shale producers at $50. In other words, the shale industry needs oil prices above $50 to produce profitably.
If the shale industry becomes unprofitable, that becomes a problem. As we found in 2016, when oil prices crashed, the shale industry became vulnerable. Defaults started lining up in the industry, which made banks vulnerable. When banks are vulnerable, credit tends to tighten and the financial system can quickly become unstable.
Now, as we know, the price of oil bounced from that $50 area last week, but we’re getting another test today. Oil was the mover of the day — down close to 4%, and back under $51.
This, I suspect, will play a very important role in the Fed decision next week.
Despite the fact that expectations point to a rate cut in July, we’ve discussed the pressures building that might lead the Fed to move next week (which would be a big surprise for markets). Oil plays into that scenario.
Stocks and crude oil have been two clear influences on Fed policy over the past few years. The latter weighs on inflation. While the Fed claims to ignore the influence of food and energy in their inflation measure, they have a history of acting when oil moves sharply. On that note, oil is down 22% over the past year. And, again, we’re testing an important level that can have spillover effects into the economy. That’s why a sharp decline in oil prices tends to influence stocks. That’s why the charts of stocks and oil have tracked so closely …
So, we’ve had a nice bounce in stocks over the past week or so. We had the same for crude. But now crude is back testing the lows of this decline.
If you haven’t signed up for my Billionaire’s Portfolio, don’t delay … we’ve just had another big exit in our portfolio, and we’ve replaced it with the favorite stock of the most revered investor in corporate America — it’s a stock with double potential.
Join now and get your risk free access by signing up here.
Yesterday we talked about the surgical manipulation Trump is (seemingly) attempting to perform, to force the Fed’s hand on a rate cut — and therefore, to optimize the economy heading into the election.
At this stage, the harder he is on China, the lower stocks go, which puts more pressure on the Fed to cut rates. But as the Fed has now signaled it’s prepared to act, stocks have risen, which makes it less likely that the Fed will act.
With that, yesterday, I surmised that Trump might ramp up the rhetoric as we near the June 19th Fed meeting, to keep a lid on the bounce in stocks.
On that note, Trump had some very firm comments on China trade this morning, implying he’s not willing to give any ground. He says “we’re going to either do a great deal with China or we’re not doing a deal at all.” He gets his demands, or no deal. Again, as we discussed yesterday, he’s in the driver’s seat. And he said as much today: “It’s me right now that’s holding up the deal.”
Stocks have given some back today, after a six day rally from the lows of this recent correction. And we get this chart going into the close…
As you can see, the S&P 500 put in a big technical reversal signal — a bearish outside day. The last signal like this we observed was on May 1, which resulted in a 7.6% correction. Perhaps we have a signal here of some softness in stocks to come, until we get to the June 19 Fed meeting.
If you haven’t signed up for my Billionaire’s Portfolio, don’t delay … we’ve just had another big exit in our portfolio, and we’ve replaced it with the favorite stock of the most revered investor in corporate America — it’s a stock with double potential.
Join now and get your risk free access by signing up here.
Last week we had signals from the Fed Chair that they were prepared to cut rates if needed.
That’s all the market needed to hear to fuel a bounce back in stocks. And that bounce accelerated when the weak jobs numbers report hit on Friday.
This is the “bad news is good news” dynamic. Souring economic data gives more impetus for the Fed to move. And expectations for lower rates are fuel for stocks.
So, the market is now pricing in an 80% chance of a rate cut at their Julymeeting. But I suspect that’s not soon enough.
If stocks continue the strong recovery, on the expectation of rate cuts coming down the pike, the likelihood of the Fed actually delivering on rate cuts diminishes greatly. To put it simply, the better stocks do, the less likely it is that the Fed will cut. The stock market matters.
Remember, this overhang of concern in markets is less about what’sactually happening in the economy, and more about what might happen (i.e. the prospects that the U.S. economy and global economy may deteriorate IF the stalemate with China continues indefinitely).
I suspect that Trump wants and needs a move from the Fed at their Junemeeting, which is just seven business days away. The G20 meeting comes later this month (June 29-30) where Trump and Xi are expected to have a sit-down to discuss the trade deal. With a rate cut under his belt, Trump might feel more compelled to claim victory on the China trade talks and do the deal, giving himself enough runway into the 2020 elections to have a booming stock market and booming economy.
With the above in mind, it makes since for Trump to ramp up the trade rhetoric (and any other threatening rhetoric) ahead of that June Fed meeting (keeping pressure on stocks), in attempt to force the Fed’s hand, sooner rather than later.
This would explain why he called into CNBC this morning. Reminding everyone of his hardline stance on China (his indifference on hammering them with tariffs indefinitely), is perhaps his way of trying to tame the stock market recovery. It may sound like a crazy theory (Trump leveraging a monumental trade deal to manipulate Fed policy, in effort to surgically optimize the economic outcome going into the election), but I think it’s happening. And he’s doing it because he can. He’s in the driver’s seat. He has the leverage and he is pulling the levers.
If you haven’t signed up for my Billionaire’s Portfolio, don’t delay … we’ve just had another big exit in our portfolio, and we’ve replaced it with the favorite stock of the most revered investor in corporate America — it’s a stock with double potential.
Join now and get your risk free access by signing up here.
We had the jobs report this morning. As we discussed on Wednesday, the weak ADP report was telegraphing a “below expectations” government jobs report.
Indeed, that’s what we got this morning.
And, while a bad job number is typically seen as bad news for stocks, in a world where the Fed has been on the hot seat to deliver a rate cut, it increases the likelihood of that happening. A rate cut is fuel for stocks, and with that, stocks continued the very strong bounceback, closing near the highs of the week.
What problems would a rate cut solve? It would mostly improve sentiment. A yield curve inversion has been spooking markets now for a while (as it has a record of predicting recessions). Perhaps contrary to what some may think, a rate cut by the Fed should steepen the yield curve. It would not only lower the front end of the curve (shorter term rates), but likely increase longer term rates by improving sentiment (i.e. higher long-term rates on the optimism that the Fed isn’t going to kill the economy through overly-tight monetary policy).
Now, while stocks have continued with a very persistent march higher this week, gold has also marched higher, and the dollar has fallen, and rates have remained near dead lows. What’s going on?
Is it the threat of tariffs hitting Mexico on Monday? I don’t think so. Stocks have well recovered and surpassed the levels prior to Trump’s tweet that threatened Mexico.
There may be something bigger happening.
A couple of weeks ago, we looked at this technical reversal signal in the dollar (chart below) and talked about the prospects of the trade war with China ending in a grand and coordinated currency agreement. The dollar has since been on the move (lower).
What do I mean by a currency agreement? There are a lot of similarities between the U.S/China standoff and that of U.S. and Japan in the 1980s. That was ended with the “Plaza Accord” — an agreement between the U.S., Japan, Germany, England and France. The Plaza Accord was a plan to balance global trade, through a 50% depreciation of the dollar (vs. the yen and d-mark).
As I said a couple of weeks ago, we may wake up one day and find a similar agreement has been made between the U.S. and major global trading partners (which may include China, or not). It might be a deal between the U.S. and China to “revalue” the yuan (i.e. strengthen it). Or it may exclude China (just G3 economies). With the behavior in markets the past few days, it smells like something is cooking.
Stocks continue to bounce back today, driven by the signalling from global central banks that they will act, if economic activity deteriorates.
First we heard from Jerome Powell on Tuesday, the Fed Chair. He opened a prepared speech by saying they would “act as appropriate to sustain the economic expansion.” Today we heard from the second most powerful central banker in the world, ECB President Mario Draghi. He echoed the sentiment of the Fed, acknowledging the global trade war risks, and said they were prepared to act, if needed.
What does “acting” mean? It would mean cutting rates by the Fed. It would mean restarting QE at the ECB.
For now, it’s all an effort to verbally massage market sentiment. And it’s working, at least for the moment.
Add to this, we had some positive news on U.S./Mexico negotiations.
With that, let’s look at some key charts …
First, here’s a look at the S&P 500 …
We’ve had an 8% decline in stocks from the April 30 highs. And now we the break of the downtrend on the rebound of the past few days. And we’re back above the 200-day moving average (the purple line).
What about oil? As we discussed, the magic number in oil is $50. That’s the breakeven point for the shale industry, below which, they can not profitably produce.
After sniffing toward that $50 level yesterday, we had a big bounce today — almost 6% higher than yesterday’s low.
And finally, here’s a look at interest rates. This has been the most concerning market, as it has completely come unhinged from the current economic conditions — pricing in the worst case scenario for geopolitical tensions. But rates are showing some life today.
For technicians, as you can see in the charts above, we’ve traded into the 61.8% Fibonacci retracement in both oil and rates.
With technical support holding in these key markets, combined with the break of the downtrend in stocks, the worst of the market pain may be behind us (i.e. a recovery underway).
If you haven’t signed up for my Billionaire’s Portfolio, don’t delay … we’ve just had another big exit in our portfolio, and we’ve replaced it with the favorite stock of the most revered investor in corporate America — it’s a stock with double potential.
Join now and get your risk free access by signing up here.
It’s jobs week. We’ll get the May jobs report on Friday.
As we’ve been discussing, the market is on Fed watch, looking for a rate cut from the Fed. And as the Fed says, they are closely watching the data for signs of deterioration in the economy.
On that note, there are few data points more scrutinized than the jobs data.
This morning we had a glimpse of what the Friday report might look like. The May ADP jobs report today showed just 27k jobs added. That was a huge miss. The expectation was 180k. The government report due on Friday is expected to show 185k new jobs. If that number comes in much lower (i.e. slower job creation), is that enough to prompt a June rate cut?
Maybe.
Equally, if not more important to the Fed, is the sharp decline that continues in crude oil. As I said last week, there are two clear influences on Fed policy over the past few years. Stocks and crude oil.
As for oil prices, the Fed has a history of acting when prices move sharply lower. Low oil prices weigh on inflation, and inflation is already running at very soft levels.
Why is that a bad thing? Inflation that’s too weak, can threaten deflation. They have the tools to deal with inflation. They raise rates. But the tools are limited to deal with deflation. They cut rates. But when rates hit zero, they have to get creative (like QE, negative rates, etc.). And the consequences of losing the deflation battle are big. When people hold onto their money thinking things will be cheaper tomorrow than they are today, that mindset can bring the economy to a dead halt. It’s a formula that can become irreversible.
Adding to the deflation threat, there is a global financial stability threat that comes from low oil prices. As we found in 2016, when oil prices crashed, the shale industry is very vulnerable. Defaults started lining up in the industry, which makes banks vulnerable. When banks are vulnerable, credit tends to tighten and the financial system can quickly become unstable.
So, what is the magic number for oil? $50. A recent Dallas Fed survey has the breakeven level for shale producers at $50. Crude traded as low as $50.60 today.
If you haven’t signed up for my Billionaire’s Portfolio, don’t delay … we’ve just had another big exit in our portfolio, and we’ve replaced it with the favorite stock of the most revered investor in corporate America — it’s a stock with double potential.
Join now and get your risk free access by signing up here.