Yesterday we talked about the prospects of a gas subsidy. On cue, the governor of California presented ideas late yesterday for a number of transportation subsidies — including a $400 a month gas card.
As we discussed, a subsidy would only sustain the demand dynamic for oil. Apply that to a world that is undersupplied and underinvested in new supply, and the price of oil would continue to rise.
But it’s unlikely to stop there. Next up: bigger government handouts in the name of broad “inflation relief.” It’s already being proposed at the state government level and on Capitol Hill.
So, here we have the Fed raising rates, and as Powell said this week, they are doing so with the explicit intent of bringing down demand. And conversely, we have governments, which have broken supply through bad policy, looking to sustain demand through subsidies (more bad policy).
If you didn’t believe the inflation problem was going to get worse, these actions (if taken) ensure it will get worse.
Let’s talk about food…
Earlier this month, we talked about a coming food crisis. It was a topic at the NATO Summit today.
Here’s an updated look at the food price index, which is now on new record highs …
If we adjust this chart for inflation, current prices are at levels are matching the record highs of 1974.
That year might sound familiar because it was the last time we had a major global food crisis.
From the looks of this chart above, it appears that some saw this coming very early. Deere has quadrupled from the pandemic lows. And continues to make new record highs.
Stocks continued the big bounce today into technical support.
Let’s take an updated look at the S&P 500 chart …
So, we had a 5.5% decline in this benchmark index to start the year, and now we have a sharp bounce of nearly 3% from this big technical trendline, which comes in from the election day lows of November 2020 (an important marker).
We heard from Jay Powell today, in his renomination hearings before the Senate. He did nothing to change the expectations on the Fed’s guidance on the rate path. Whether it be three or four hikes this year, we’ve just finished a year with around 10% nominal growth and over 5% inflation.
The coming year may be more of the same, and yet we have a market and Fed posturing and speculating over how close to 1% the Fed Funds rate might be by year end. That dynamic only adds fuel to the inflation and growth fire.
On that note, we’ve been watching three key spots that should be on the move with this policy outlook: bonds (down), gold (up) and the dollar (down).
Gold was up 1.25% today, making another run at this 1830-50 level. If that level gives way, the move in gold should accelerate. As you can see in the chart, we would get a breakout from this big corrective trend that comes down from the August 2020 all-time highs.
On a related note (dollar down, commodities up), the dollar looks vulnerable to a breakdown technically …
We kick off fourth quarter earnings this week. We’ll hear from the big banks on Friday: JP Morgan, Citi and Wells Fargo.
Bank of America and Goldman Sachs earnings will come early next week.
Last year, across the broad market, the table was set for positive earnings surprises, against a backdrop of deliberately dialed down expectations. And those low expectations were against a low base of 2020, pandemic/lockdown numbers.
With that, we’ve had positive earnings surprises throughout the first three quarters of 2021. The expectation is for 21% earnings growth for Q4, which would give us four consecutive quarters of 20%+ earnings growth and 40% earnings growth on the year.
That said, of the nearly 100 S&P 500 companies that have issued guidance for Q4, 60% are negative. That’s straight from the corporate America playbook: Using the cover of the Omicron news from late November to lower expectations, to position themselves to manufacture positive earning surprises OR withhold some earnings power for next quarter.
So, in addition to the changing interest rate cycle, could the slide in stocks to open the year have something to do with weaker Q4 earnings? Maybe.
On that note, let’s take a look at the big technical support hit today …
In the chart above, the S&P 500 hit this big trendline that comes in from election day. This rise in stocks, of course, has everything to do with an agenda that entailed even more massive fiscal spending programs — AND a central bank that remained in an ultra-easy stance.
Indeed, we’ve since had another $1.9 trillion spend passed in late January of last year, plus a $1.2 trillion infrastructure package later in 2021.
Now we have a Fed that has flipped the script, and the additional bazooka agenda-driven fiscal package has been blocked — and we get a test of this big trendline.
The good news: The line held today, and stocks bounced aggressively (about 100 S&P points) into the close.
As you can see in the chart below, we have a similar line in the Nasdaq, dating back to the election. This breached but closed back above the line today.
With the above in mind, we should expect the banks to continue putting up big numbers to kick off the earnings season later this week. That will be fuel for stocks.
Remember, the banks set aside a war chest of loan loss reserves early in the pandemic, and they have been moving those reserves to the bottom line since, at their discretion. As an example, both Citi and JP Morgan have another $5 billion to release, to bring their loan loss reserves back in line with pre-pandemic levels. That’s $5 billion (each) that will be turned into earnings.
Yesterday we talked about the plunge in oil prices and the importance of holding above the big $50 level. And oil gets a big bounce back today on the Iranian attack of two oil tankers in the Middle East.
Iran has made threats, in the past, to choke off global oil supply in the narrow strait (Hormuz) that about 30% of the world’s crude oil passes through. Today’s attack follows an attack on Saudi tankers last month. So Iran is posturing to deliver on threats of disrupting global oil supply.
This all stems, of course, from Trump’s efforts to bring Iranian oil exports to zero (sanctions that were upgraded back in April) — to get them back to the negotiating table on weapons of mass destruction.
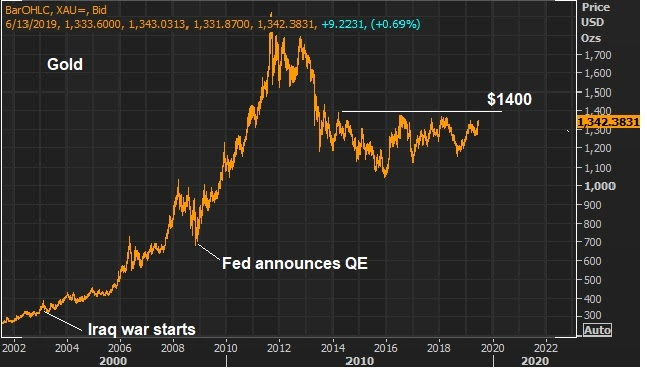
Without getting into speculation of where this will end, let’s just take a look at gold, which has gotten a renewed “fear of the unknown” bid this month. A conflict with Iran would fall into that category. In an interview yesterday, the great macro trader Paul Tudor Jones called gold his favorite trade over the next 12-24 months (for a number of reasons). He said if it breaks $1,400, it will quickly push to $1,700.
If you haven’t signed up for my Billionaire’s Portfolio, don’t delay … we’ve just had another big exit in our portfolio, and we’ve replaced it with the favorite stock of the most revered investor in corporate America — it’s a stock with double potential.
Join now and get your risk free access by signing up here.
Remember, last week we talked about why $50 is a very important level for oil.
A recent Dallas Fed survey has the breakeven level for shale producers at $50. In other words, the shale industry needs oil prices above $50 to produce profitably.
If the shale industry becomes unprofitable, that becomes a problem. As we found in 2016, when oil prices crashed, the shale industry became vulnerable. Defaults started lining up in the industry, which made banks vulnerable. When banks are vulnerable, credit tends to tighten and the financial system can quickly become unstable.
Now, as we know, the price of oil bounced from that $50 area last week, but we’re getting another test today. Oil was the mover of the day — down close to 4%, and back under $51.
This, I suspect, will play a very important role in the Fed decision next week.
Despite the fact that expectations point to a rate cut in July, we’ve discussed the pressures building that might lead the Fed to move next week (which would be a big surprise for markets). Oil plays into that scenario.
Stocks and crude oil have been two clear influences on Fed policy over the past few years. The latter weighs on inflation. While the Fed claims to ignore the influence of food and energy in their inflation measure, they have a history of acting when oil moves sharply. On that note, oil is down 22% over the past year. And, again, we’re testing an important level that can have spillover effects into the economy. That’s why a sharp decline in oil prices tends to influence stocks. That’s why the charts of stocks and oil have tracked so closely …
So, we’ve had a nice bounce in stocks over the past week or so. We had the same for crude. But now crude is back testing the lows of this decline.
If you haven’t signed up for my Billionaire’s Portfolio, don’t delay … we’ve just had another big exit in our portfolio, and we’ve replaced it with the favorite stock of the most revered investor in corporate America — it’s a stock with double potential.
Join now and get your risk free access by signing up here.
Yesterday we talked about the surgical manipulation Trump is (seemingly) attempting to perform, to force the Fed’s hand on a rate cut — and therefore, to optimize the economy heading into the election.
At this stage, the harder he is on China, the lower stocks go, which puts more pressure on the Fed to cut rates. But as the Fed has now signaled it’s prepared to act, stocks have risen, which makes it less likely that the Fed will act.
With that, yesterday, I surmised that Trump might ramp up the rhetoric as we near the June 19th Fed meeting, to keep a lid on the bounce in stocks.
On that note, Trump had some very firm comments on China trade this morning, implying he’s not willing to give any ground. He says “we’re going to either do a great deal with China or we’re not doing a deal at all.” He gets his demands, or no deal. Again, as we discussed yesterday, he’s in the driver’s seat. And he said as much today: “It’s me right now that’s holding up the deal.”
Stocks have given some back today, after a six day rally from the lows of this recent correction. And we get this chart going into the close…
As you can see, the S&P 500 put in a big technical reversal signal — a bearish outside day. The last signal like this we observed was on May 1, which resulted in a 7.6% correction. Perhaps we have a signal here of some softness in stocks to come, until we get to the June 19 Fed meeting.
If you haven’t signed up for my Billionaire’s Portfolio, don’t delay … we’ve just had another big exit in our portfolio, and we’ve replaced it with the favorite stock of the most revered investor in corporate America — it’s a stock with double potential.
Join now and get your risk free access by signing up here.
Last week we had signals from the Fed Chair that they were prepared to cut rates if needed.
That’s all the market needed to hear to fuel a bounce back in stocks. And that bounce accelerated when the weak jobs numbers report hit on Friday.
This is the “bad news is good news” dynamic. Souring economic data gives more impetus for the Fed to move. And expectations for lower rates are fuel for stocks.
So, the market is now pricing in an 80% chance of a rate cut at their Julymeeting. But I suspect that’s not soon enough.
If stocks continue the strong recovery, on the expectation of rate cuts coming down the pike, the likelihood of the Fed actually delivering on rate cuts diminishes greatly. To put it simply, the better stocks do, the less likely it is that the Fed will cut. The stock market matters.
Remember, this overhang of concern in markets is less about what’sactually happening in the economy, and more about what might happen (i.e. the prospects that the U.S. economy and global economy may deteriorate IF the stalemate with China continues indefinitely).
I suspect that Trump wants and needs a move from the Fed at their Junemeeting, which is just seven business days away. The G20 meeting comes later this month (June 29-30) where Trump and Xi are expected to have a sit-down to discuss the trade deal. With a rate cut under his belt, Trump might feel more compelled to claim victory on the China trade talks and do the deal, giving himself enough runway into the 2020 elections to have a booming stock market and booming economy.
With the above in mind, it makes since for Trump to ramp up the trade rhetoric (and any other threatening rhetoric) ahead of that June Fed meeting (keeping pressure on stocks), in attempt to force the Fed’s hand, sooner rather than later.
This would explain why he called into CNBC this morning. Reminding everyone of his hardline stance on China (his indifference on hammering them with tariffs indefinitely), is perhaps his way of trying to tame the stock market recovery. It may sound like a crazy theory (Trump leveraging a monumental trade deal to manipulate Fed policy, in effort to surgically optimize the economic outcome going into the election), but I think it’s happening. And he’s doing it because he can. He’s in the driver’s seat. He has the leverage and he is pulling the levers.
If you haven’t signed up for my Billionaire’s Portfolio, don’t delay … we’ve just had another big exit in our portfolio, and we’ve replaced it with the favorite stock of the most revered investor in corporate America — it’s a stock with double potential.
Join now and get your risk free access by signing up here.
We had the jobs report this morning. As we discussed on Wednesday, the weak ADP report was telegraphing a “below expectations” government jobs report.
Indeed, that’s what we got this morning.
And, while a bad job number is typically seen as bad news for stocks, in a world where the Fed has been on the hot seat to deliver a rate cut, it increases the likelihood of that happening. A rate cut is fuel for stocks, and with that, stocks continued the very strong bounceback, closing near the highs of the week.
What problems would a rate cut solve? It would mostly improve sentiment. A yield curve inversion has been spooking markets now for a while (as it has a record of predicting recessions). Perhaps contrary to what some may think, a rate cut by the Fed should steepen the yield curve. It would not only lower the front end of the curve (shorter term rates), but likely increase longer term rates by improving sentiment (i.e. higher long-term rates on the optimism that the Fed isn’t going to kill the economy through overly-tight monetary policy).
Now, while stocks have continued with a very persistent march higher this week, gold has also marched higher, and the dollar has fallen, and rates have remained near dead lows. What’s going on?
Is it the threat of tariffs hitting Mexico on Monday? I don’t think so. Stocks have well recovered and surpassed the levels prior to Trump’s tweet that threatened Mexico.
There may be something bigger happening.
A couple of weeks ago, we looked at this technical reversal signal in the dollar (chart below) and talked about the prospects of the trade war with China ending in a grand and coordinated currency agreement. The dollar has since been on the move (lower).
What do I mean by a currency agreement? There are a lot of similarities between the U.S/China standoff and that of U.S. and Japan in the 1980s. That was ended with the “Plaza Accord” — an agreement between the U.S., Japan, Germany, England and France. The Plaza Accord was a plan to balance global trade, through a 50% depreciation of the dollar (vs. the yen and d-mark).
As I said a couple of weeks ago, we may wake up one day and find a similar agreement has been made between the U.S. and major global trading partners (which may include China, or not). It might be a deal between the U.S. and China to “revalue” the yuan (i.e. strengthen it). Or it may exclude China (just G3 economies). With the behavior in markets the past few days, it smells like something is cooking.
It’s jobs week. We’ll get the May jobs report on Friday.
As we’ve been discussing, the market is on Fed watch, looking for a rate cut from the Fed. And as the Fed says, they are closely watching the data for signs of deterioration in the economy.
On that note, there are few data points more scrutinized than the jobs data.
This morning we had a glimpse of what the Friday report might look like. The May ADP jobs report today showed just 27k jobs added. That was a huge miss. The expectation was 180k. The government report due on Friday is expected to show 185k new jobs. If that number comes in much lower (i.e. slower job creation), is that enough to prompt a June rate cut?
Maybe.
Equally, if not more important to the Fed, is the sharp decline that continues in crude oil. As I said last week, there are two clear influences on Fed policy over the past few years. Stocks and crude oil.
As for oil prices, the Fed has a history of acting when prices move sharply lower. Low oil prices weigh on inflation, and inflation is already running at very soft levels.
Why is that a bad thing? Inflation that’s too weak, can threaten deflation. They have the tools to deal with inflation. They raise rates. But the tools are limited to deal with deflation. They cut rates. But when rates hit zero, they have to get creative (like QE, negative rates, etc.). And the consequences of losing the deflation battle are big. When people hold onto their money thinking things will be cheaper tomorrow than they are today, that mindset can bring the economy to a dead halt. It’s a formula that can become irreversible.
Adding to the deflation threat, there is a global financial stability threat that comes from low oil prices. As we found in 2016, when oil prices crashed, the shale industry is very vulnerable. Defaults started lining up in the industry, which makes banks vulnerable. When banks are vulnerable, credit tends to tighten and the financial system can quickly become unstable.
So, what is the magic number for oil? $50. A recent Dallas Fed survey has the breakeven level for shale producers at $50. Crude traded as low as $50.60 today.
If you haven’t signed up for my Billionaire’s Portfolio, don’t delay … we’ve just had another big exit in our portfolio, and we’ve replaced it with the favorite stock of the most revered investor in corporate America — it’s a stock with double potential.
Join now and get your risk free access by signing up here.
We’ve talked about the build up to a Fed rate cut. On that note, we heard from the Fed Chair this morning (more in a moment).
As we’ve discussed, the market has been bullying the Fed for a rate cut, with a 10- year yield sitting near the lowest levels since late 2017 – almost 120 basis points lower than the levels of just six months ago.
Here’s what that looks like on a chart …
For perspective, the last time the U.S. 10-year government bond yield (the benchmark “market determined” interest rate) was here, the Fed determined benchmark interest rate was only 1.25%. The Fed is now at 2.50%.
Is the Fed listening to the message from the interest rate market? The good news: It seems so.
We’ve heard from Fed officials (yesterday and today), acknowledging that they (the Fed) have the flexibility (with low and tame inflation) to cut rates as an insurance policy against an economic slowdown.
The Fed Chair himself said as much this morning in prepared remarks for his scheduled speech at a Chicago Fed conference. Here’s what he said…
“I’d like first to say a word about recent developments involving trade negotiations and other matters. We do not know how or when these issues will be resolved. We are closely monitoring the implications of these developments for the U.S. economic outlook and, as always, we will act as appropriate to sustain the expansion…”
So, we had a tone-deaf Fed in December, hiking rates into falling stock markets and growing global economic risks. And now it appears the Fed is hearing more clearly.
With that, we get a big bounce back in stocks over the past 24-hours. And, importantly, the S&P 500 has recovered back above the 200-day moving average (the purple line).
And, as you can see in the chart of 10-year yields above, we’re also getting big technical support at the lows yesterday in interest rates. Both charts support the scenario of recovery/bounce.
If you haven’t signed up for my Billionaire’s Portfolio, don’t delay … we’ve just had another big exit in our portfolio, and we’ve replaced it with the favorite stock of the most revered investor in corporate America — it’s a stock with double potential.
Join now and get your risk free access by signing up here.