
By Bryan Rich
October 13, 2017, 3:30 pm EST
 Yesterday we talked about the case for commodities and the opportunity for a rotation into commodities stocks.
The valuation of commodities relative to stocks has only been this disconnected (stocks strong, commodities weak) twice, historically over the past 100 years: at the depths of the Great Depression in the early 30s and toward the end of the Bretton Woods currency system.
That supports the case that we’re in the early days of a bull market in commodities, especially considering where we stand in the global economic recovery, underpinned by the “reflation” focus at both the monetary and fiscal policy levels. It’s a recipe for hotter demand for commodities.
With that, let’s take a look at a few charts as we close the week.
Copper
We talked about copper yesterday. This continues to ring the bell, alerting us that better economic growth is coming – maybe a boom.
Copper is up 6.5% in the past two weeks, back of $3 and closing in on the highs of the year – which is a three year high. And remember, we looked at the potential break of this big six-year downtrend back in August. That has broken, retested and confirms the trend change.


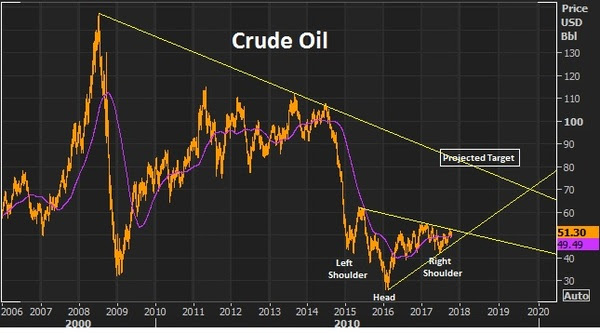
Crude Oil
We talked about the fundamental case for oil this week. And we looked at the technical case, as it made a brief test of the 200 day moving average and quickly bounced back. It’s up about 4% on the week.
We have this inverse head and shoulder (in the chart below) that projects a move back to the low $80s. And as part of that technical picture, we’re setting up for a break of a big two-year trendline that should open the doors to a move back into the $70+ oil area.

 Iron Ore
Iron ore was the biggest mover of the day – up 6% today. This has been a deeply depressed market through the post-financial crisis era. In addition to the broad commodities weakness, iron ore prices have suffered from the dumping of poor quailty iron ore by Chinese producers. Those times seem to be changing.
This week there was a fraud claim on a big Japanese steel maker for fudging it’s quality data. Keep an eye on this one as it could lead to more, and could lead to a supply disruption in industrial metals.
Then today we had Chinese data that showed record imports of iron ore. This is a signal that there’s both an envirionmental movement and an anti-dumping movement against low grade iron ore that has been influencing supply and prices (and crushing producers). This big Chinese data point is also in line with the message copper is sending: perhaps the Chinese economy is doing better than most think.

With that, let’s take a look at a few charts as we close the week. The valuation of commodities relative to stocks has only been this disconnected (stocks strong, commodities weak) twice, historically over the past 100 years: at the depths of the Great Depression in the early 30s and toward the end of the Bretton Woods currency system.
Join our Billionaire’s Portfolio today to get your portfolio in line with the most influential investors in the world, and hear more of my actionable political, economic and market analysis. Click here to learn more.