We’ve talked about the set up for positive surprises in the data. We’ve looked at the first two components of GDP (consumption and investment) both of which are set up for positive surprises. Today let’s look at government spending.
It’s typical for debt to balloon in economic downturns. Not only did our debt/gdp ratio balloon in the U.S. but it ballooned everywhere. With that, as the global economy was being propped up by central banks, for the better part of the past decade, the politicians were reluctant to help on the fiscal side. Instead, they went the other way. They went the path of austerity. They focused on debt when the economy desperately needed growth.
Fiscal tightening in a widespread global recession is a recipe for tipping it all into depression. That required the central banks to do more, and more, and more to keep the economy from entering into a deflation spiral — fighting the drag of fiscal belt tightening. And it all began tipping over the edge in mid-2016.
But that changed with Trump election. Trumponomics has been all about restoring growth and breaking from the rut of economic stagnation. And a key pillar in that plan has been infrastructure and government spending.
On that note, he’s been pushing for a trillion dollar infracture spend over 10 years. And as we’ve discussed, while adding debt isn’t popular for the politicians to approve, natural disasters last year gave them an excuse to approve spending packages. Fast foward just six months and we’ve had more than $200 billion in aid approved from Congress. And now we’ve had an increase of $400 billion in government spending as part of the lastest government budget.
So the government spending piece has been in motion. And expect the rest of the world to follow. As we’ve discussed in recent weeks, we’ve seen the populist push back across the world, from Grexit, to Brexit, to the Trump vote, and now to the “Italy first” movement. The real fight in the “populist movement” is against economic stagnation. And much of that is due to mistakes on policy in response to the global economic crisis. And the core mistake has been austerity. Growthsolves a lot of problems.
What about the debt?
The media loves to talk about the $20 trillion dollar debt load, as if we are going to default and/or the rest of the world is going to dump our Treasuries and send interest rates skyrocketing and implode our economy.
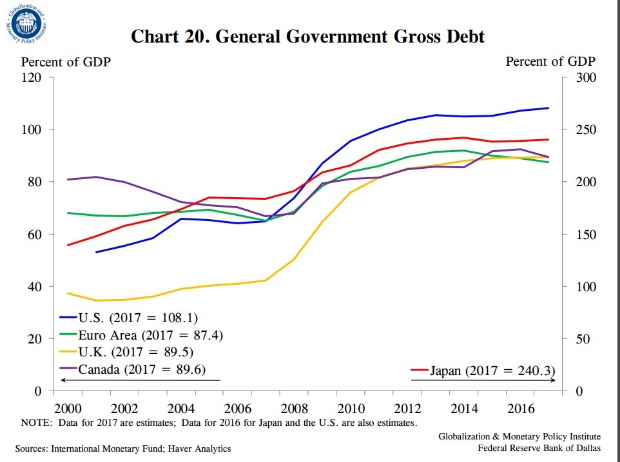
Government debt and deficits are judged (by global trade partners, allies, global allocators of capital) on a relative basis – size relative to GDP. Again, our debt relative to GDP has ballooned since the global financial crisis. But it also has for everyone else in the world. That’s why people/countries are still plowing money into our Treasury market for virtually no return, because lending the U.S. money is still the safest place and way to preserve wealth.
The only alternative in this post global financial crisis environment is to focus on growth. Growth can solve a lot of problems, including the debt and deficit relative to GDP problems. As growth goes up, our debt relative to size of the economy goes down.
If we get the economy back on a sustainable growth path, then, in good times, we can work on the structural flaws that led us to the crisis. That’s the only option.
So, when we look at the components of GDP, the policy execution in Washington has been driving lift-off in all of the components. And yet the experts have still underetimated the potential for a growth boom. We’ve talked about the positive surprises that are coming down the pike in consumption, investment and govenment spending. Tomorrow, we’ll take a look at the trade piece.
With a government shutdown over the weekend, today I want to revisit my note from last month (the last time we were facing a potential government shutdown) on the significance of the government debt load.
The debt load is an easy tool for politicians to use. And it’s never discussed in context. So the absolute number of $19 trillion is a guarantee to conjure up fear in people – fear that foreigners may dump our bonds, fear that we may have runaway inflation, fear that the economy is a house of cards. So that fear is used to gain negotiating leverage by whatever party is in a position of weakness. For the better part of the past decade, it was used by the Republican party to block policies. And now it’s being used by the Democratic party to try to block policies.
Now, the federal debt is a big number. But so is the size of our economy – both about $19 trillion. And while our debt/GDP has grown over the past decade, the increase in sovereign debtrelativetoGDP, has been a global phenomenon, following the financial crisis. Much of it has to do with the contraction in growth and the subsequent sluggish growth throughout the recovery (i.e. the GDP side of the ratio hasn’t been carrying its weight).
You can see in the chart below, the increasing debt situation isn’t specific to the U.S.
Now, we could choose to cut spending, suck it up, and pay down the debt. That’s called austerity. The choice of austerity in this environment, where the economy is fragile, and growth has been sluggish for the better part of ten years, would send the U.S. economy back into recession. Just ask Europe. After the depths of the financial crisis, they went the path of tax hikes and spending cuts, and by 2012 found themselves back in recession and a near deflationary spiral – they crushed the weak recovery that the European Central Banks (and global central banks) had spent, backstopped and/or guaranteed trillions of dollars to create.
The problem, in this post-financial crisis environment: if the major economies in the world sunk back into recession (especially the U.S.), it would certainly draw emerging markets (and the global economy, in general) back into recession. And following a long period of unprecedented emergency monetary policies, the global central banks would have limited-to-no ammunition to fight a deflationary spiral this time around.
Now, all of this is precisely why the outlook for the U.S. and global economy changed on election night in 2016. We now have an administration that is focused on growth, and an aligned Congress to overwhelm the political blocking. That means we truly have the opportunity to improve our relative debt-load through growth.
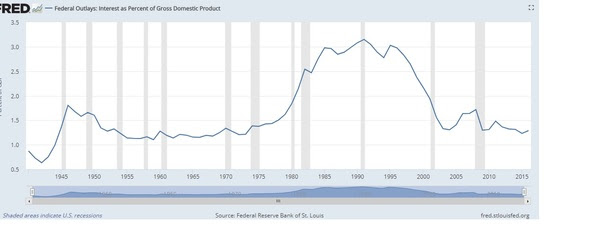
In the meantime, despite all of the talk, our ability to service the debt load is as strong as it’s been in forty years (as you can see in the chart below). And our ability to refinance debt is as strong as it’s been in sixty years.
For help building a high potential portfolio, follow me in our Forbes Billionaire’s Portfolio, where you look over my shoulder as I follow the world’s best investors into their best stocks. Our portfolio of highest conviction, billionaire-owned stocks is up close to 50% over the past two years. You can join me here and get positioned for a big 2018.
government shutdown, washington, wall street, economy
Stocks reversed after a hot opening today. With a quiet data week ahead, the focus is on the prospects of a government shutdown.
If this sounds familiar to you, it should. Government debt is the, often played, go-to political football.
It was only last month that we were facing a similar threat. But with some policy-making tailwinds on one side of the aisle, the fight was politically less palatable in December. With that, Congress passed a temporary funding bill to kick the can to this month.
And just three months prior to that, in September, we had the same showdown, same result. The “government shutdown” card was being played aggressively until the hurricanes rolled through. From that point, politicians had major political risk in trying to fight hurricane aid. They kicked the can to December to approve that funding.
Now, the Democrats feel like they have some leverage, and their using the threat of a government shutdown to make gains on their policy agenda. So, how concerned should we be about a government shutdown (which could come on Friday)? Would it derail stocks?
If you recall, there was a lot of fuss and draconian warnings about an impending government shutdown back in 2013. The government was shutdown for 16 days. Stocks went up about 2%. Before that was 1995-1996 (stocks were flat), and 1990 (stocks were flat).
For help building a high potential portfolio, follow me in our Billionaire’s Portfolio subscription service, where you look over my shoulder as I follow the world’s best investors into their best stocks. Our portfolio of highest conviction, billionaire-owned stocks is up close to 50% over the past two years. You can join me here and get positioned for a big 2018.
Interest rates are on the move today. So is oil. And the latter has a lot to do with the former.
For much of the past quarter we’ve talked about how disconnected the interest rate market has been from the stock market and the economy.
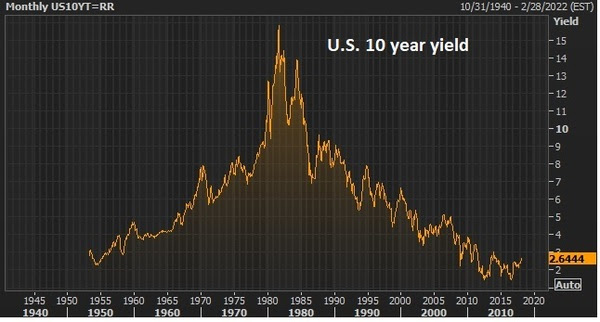
With stocks putting up 20% last year, the economy growing at close to 3% and unemployment at 4%, and with FIVE Fed rate hikes now in this tightening cycle, the yield on the 10-year Treasury has defied logic.
But as we’ve discussed, we should expect that logic to be a little warped when we’re coming out of an unprecedented global economic crisis that was combatted by an unprecedented and globally coordinated monetary policy. And that continues to create dislocations in financial markets. Specifically, when global central banks continue to print money, and indiscriminately buy U.S. Treasurys with that freshly printed money (i.e. the dollars the trade for it), they will keep market rates pinned down. And they have done just that. Of course, that helps fuel the U.S. and global recovery, as it keeps borrowing and service rates cheap for things like mortgages, consumer loans, corporate debt and sovereign debt.
But last month, we talked about where the real anchor now exists for global interest rates. It’s in Japan. As long as Japan is pegging the yield on the 10-year Japanese government bond at zero, they will have license to print unlimited yen, and buy unlimited global government bonds, and anchor rates.
What would move Japan off of that policy? That’s the question. When they do abandon that policy (pegging JGB yields at zero), it will signal the end of QE in Japan and the end of global QE. Rates will go on a tear.
With that the architect of the stimulus program in Japan, Shinzo Abe, said today that he would keep the pedal to the metal, but indicated a possibility that they could achieve their goal of beating deflation this year.
That sent global rates moving. The benchmark 10-year yield jumped to 2.54% today, the highest since March of last year.
Another big influence on rates is, and will be, the price of oil. As we’ve discussed, the price of oil has played a huge role in the Fed’s view toward inflation. And that influence (of oil prices) on the inflation view is shared at other major central banks.
On that note, oil broke above $63 today, the highest levels since 2014.
Remember we looked at this chart for oil back in November, which projected a move toward $80.
With oil now up 26% from November, here’s an updated look …
For help building a high potential portfolio, follow me in our Billionaire’s Portfolio, where you look over my shoulder as I follow the world’s best investors into their best stocks. Our portfolio of highest conviction, billionaire-owned stocks is up close to 50% over the past two years. And 25% of our portfolio is in commodities stocks. You can join me here and get positioned for a big 2018.
Last year this time, as we ended 2016, and looked ahead to 2017, it was clear that the dominant theme for the year ahead would be Trumponomics.
We had a global economy that had been propped up by central banks for the better part of eight years, and growth that was proving to be dangerously slow — with growing risks of a stall and another downward spiral.
That was clear in the summer of 2016, when global interest rates started to diving deeply into negative territory. That meant people were happy to pay governments for the security of parking their money in government bonds.
There was a clear lack of optimism about economic conditions and what the future may look like.
That changed with Trump’s election and his commitment to launch an assault on economic stagnation.
It flipped the switch on the lack of optimism that had been paralyzing business activity. And that optimism has led to a hotter economy this year than most expected, despite the lack of substantial policy action (which we didn’t get until later in the year).
So what will next year look like?
As we discussed yesterday, we have tax cuts that should drive corporate earnings and warrant another double digit year for the stock market (close to 20%).
And that doesn’t take into account the impact to corporate earnings from personal tax cuts, a healthier job market with employees that can command higher wages and companies that are confident to take cash and invest in new projects. So, by design, we have incentives coming into the economy for 2018 that will boost demand. And another pillar of Trumponomics, infrastructure, will be the focus early next year, which will fuel more jobs, more economic activity.
All of this and the Fed is projecting just 2.5% growth next year. And Wall Street and the economist community tend to anchor their forecasts on the Fed. But the Fed doesn’t have a very good record in forecasting – especially in recent history.
They overestimated growth and the outlook throughout much of the recovery period. Instead we got stagnation.
But in the past 18 months or so, they flipped the script. They became the “new normal” believers that we’re in for long-term slower growth.
With that, they underestimated the outlook for 2017, even with the prospects of fiscal stimulus coming (they ignored it, and continue to). They were looking for 2.1% growth. It will be closer to 3% for the full year 2017. And next year, while they are looking for 2.5%, we could have something closer to 4%. That’s my bet.
Remember, we’ve talked about the fundamental backdrop, with the addition of fiscal stimulus, that could have us in the early stages of an economic boom period. I think we’ll feel that, for the first time in a long time, in 2018.
Join our Billionaire’s Portfolio today to get your portfolio in line with the most influential investors in the world, and hear more of my actionable political, economic and market analysis. Click here to learn more.
Last week we had the merger of Fox and Disney, and the repeal of the Net Neutrality rule. And the tax bill continues to inch toward the finish line.
That said, this would typically be the time of year when markets go quiet as money managers close the books on the year, decision makers at companies go on holiday and politicians do the same.
But that wasn’t the case last year, as President-elect Trump was holding meetings in Trump towers and telegraphing policy changes. And it may not be the case this year, as the tax plan may be approved before year end. The final votes are said to come next week, and the bill is tracking to be on the President’s desk by Christmas.
With that, and with the lack of market liquidity into the year end, we may get a further melt-up in last trading days of the year.
Yesterday we talked about the other side of the Net Neutrality story that doesn’t get much acknowledgement in the press. In short, the tech giants that have emerged over the past decade, to dominate, have done so because of regulatory favor. This favor has decimated industries and has dangerously consolidated power into the hands of few. The repeal of this rule is turning that regulatory tide.
It looks like the playing field might be leveling. That means a higher cost of doing business may be coming for Silicon Valley, with fewer advantages and more competition from the old-economy brands that have been investing to compete online. That means potentially slower earnings growth for the big internet giants, for those that are making money, and an even more uncertain future for those that aren’t (e.g. Tesla).
With this in mind, at the moment Amazon is valued at twice the size of Walmart. Uber is valued at almost 40 times the size of Hertz. And Tesla, which has lost$2.5 billion over the past five years is valued the same as General Motors, which has made$43billion over the same period.
Next year could be the year these valuation anomalies correct.
Join our Billionaire’s Portfolio today to get your portfolio in line with the most influential investors in the world, and hear more of my actionable political, economic and market analysis. Click here to learn more.
The Fed decided to hike interest rates by another quarter point yesterday. That was fully telegraphed and anticipated by markets. That’s the third rate hike this year, and the fifth in the post-crisis rate hiking cycle.
Still, the yield on the 10-year Treasury note (the benchmark market determined interest rate), moved lower today, not higher — and sits unchanged for the year.
We talked earlier in the week about the biggest central bank event of the month. It wasn’t the Fed, but it will be in Japan next week. Japan’s policy on pegging their 10-year yield at zero has been the anchor on global interest rates.
When they signal a change to that policy, that’s when rates will finally move.
With this divergence between what the Fed is doing (setting rates) and what market rates are doing (market-determined), people have become convinced that the interest rate market is foretelling a recession coming — i.e. short term rates have been rising, while longer term rates have been quiet, if not falling. For example, when the Fed made it’s first rate hike in December of 2015, the 30-year government bond yield was 3%. Today, after five rate hikes on the overnight Fed determined interest rate, the 30-year is just 2.72% (lower, not higher than when the Fed started).
This dynamic has created a flattening yield curve. That gets people’s attention, because historically, when the yield curve has inverted (short term rates rise above long term rates), recession has followed every time since 1950, with one exception in the late 60s.
And it turns out, this “flattening of the yield curve” indicator, historically (and ultimate inversion, when it happens), is typically driven by monetary policy (i.e. rate hikes — check). In these cases, the market anticipates the Fed killing growth and eventually leading rate cuts! They find more certainty and stability in owning longer term bonds (leaving short term bonds pushing those rates up and moving into long term bonds, pushing those rates down — inverting the curve).
The question, is that the case this time? Or is this time different. It’s rarely a good idea in markets to think this time is different than the past. But in this case, following trillions of dollars of central bank intervention and a near implosion in the global economy, it’s probably safe to say that this time is certainly different than past recessions. Though the Fed is in a hiking cycle, rates remain well below long term averages. And, as we know, we have unconventional monetary policies at work in other key areas of the world — stoking liquidity, growth and skewing demand for U.S. Treasuries (which suppresses those long term interest rates).
So the flattening yield curve fears are probably misplaced, especially given big fiscal stimulus is coming. And when Japan moves off of its “zero yield policy,” the U.S. yield curve may steepen more quickly than people think is possible.
Join our Billionaire’s Portfolio today to get your portfolio in line with the most influential investors in the world, and hear more of my actionable political, economic and market analysis. Click here to learn more.
We have big central bank meetings this week. Let’s talk about why it matters (or maybe doesn’t).
The Fed, of course, has been leading the way in the move away from global emergency policies.
But they’ve only been able to do so (raising rates and reducing their balance sheet) because major central banks in Europe and Japan have been there to pick up where the Fed left off, subsidizing the global economy (pumping up asset prices and pinning down market interest rates) through massive QE programs.
The QE in Japan and Europe has kept borrowing rates cheap (for consumers, corporates and sovereigns) and kept stocks moving higher (through outright purchases and through backstopping against shock risks, which makes people more confident to take risk).
But now economic conditions are improving in Europe and Japan. And we have fiscal stimulus coming in the U.S., into an economy with solid fundamentals. As we’ve discussed, this sets up for what should be an economic boom period in the U.S. And that will translate into hotter global growth. So the tide has turned.
With that, global interest rates, which have been suppressed by these QE programs, will start moving higher when we get signals from the key players, that an end of QE and zero interest rates is coming. The European Central Bank has already reduced its QE program and set an end date for next September. That makes the Bank of Japan the most important central bank in the world, right now. And that makes the meeting next week at the Bank of Japan the most important central bank event.
Let’s talk a bit more about, why?
Remember, last September, the Bank of Japan revamped it’s massive QE program which gave them the license to do unlimited QE. They announced that they would peg the Japanese 10-year government bond yield at ZERO.
At that time, rates were deeply into negative territory. In that respect, it was actually a removal (a tightening) of monetary stimulus in the near term — the opposite of what the market was hoping for, though few seemed to understand the concept. But the BOJ saw what was coming.
This move gave the BOJ the ability to do unlimited QE, to keep stimulating the economy, even as growth and inflation started moving well in their direction.
Shortly thereafter, the Trump effect sent U.S. yields on a tear higher. That move pulled global interest rates higher too, including Japanese rates. The Japanese 10-year yield above zero, and that triggered the BOJ to become a buyer of as many Japanese Government Bonds as necessary, to push yields back down to zero. As growth and the outlook in Japan and globally have improved, and as the Fed has continued tightening, the upward pressure on rates has continued, which has continued to trigger more and more QE from the BOJ – which only reinforces growth and the outlook.
So we have the BOJ to thank, in a pretty large part, for the sustained improvement in the global economy over the past year.
As for global rates: As long as this policy at the BOJ appears to have no end, we should expect U.S. yields to remain low, despite what the Fed is doing. But when the BOJ signals it may be time to think about the exit doors, global rates will probably take off. We’ll probably see a 10-year yield in the mid three percent area, rather than the low twos. That will likely mean mortgage rates back well above 5%, car loans several percentage points higher, credit card rates higher, etc.
Join our Billionaire’s Portfolio today to get your portfolio in line with the most influential investors in the world, and hear more of my actionable political, economic and market analysis. Click here to learn more.
With the potential government shutdown looming, let’s look at some perspective on government debt.
As we discussed early in the week, the policy execution pendulum for the Trump administration has swung over the past four months, from winless to potentially two big wins by the year end.
As I’ve said, with a massive corporate tax cut coming and big incentives for companies to build, invest and bring money back home (from overseas), we should be entering an economic boom period — one we have desperately needed, post-recession, but haven’t gotten.
Still, there are people that hate the tax cut idea. They think the economy is fine shape. And that debt is the problem. The Joint Committee on Taxation is the go to study for those that oppose the tax cuts. The study shows not a lot of growth, and disputes the case that the tax cuts will pay for themselves through growth.
What the headlines that cite this study don’t say, is that the study has huge assumptions that drive their conclusions. Among them, that creating incentives to repatriate $3 trillion in offshore corporate money will only contribute about a fifth of the taxable value of that amount of money. And they assume that the Fed will hike rates at a pace to precisely nullify any gains in economic activity (which wouldn’t be smart, unless they want to go revisit another decade of QE).
Now, with this study in mind, people are fearing the debt implications, on what is already a large debt load. And they fear that global investors might start dumping our Treasuries, as a result.
This has been a misguided fear throughout much of the post-financial crisis environment. Conversely, international investors have flocked into our Treasuries (lending us money), as the safest parking place for their capital. Why?
For perspective on the debt load and the fiscal stimulus decision, as we discussed earlier this week: “The national debt is a big number. But so is the size of our economy – about $19 trillion. Sovereign debt isn’t about the absolute number. It’s about the size of debt relative to the size of the economy. With that, it’s about our ability to service that debt at sustainable interest rates. The choice of austerity in this environment, where the economy is fragile and growth has been sluggish for the better part of ten years, would send the U.S. economy back into recession (as it did in Europe). And the outlook for re-emerging would be grim. That would make our debt/gdp far inferior to current levels — and our ability to service the debt, far inferior.”
Add to this, the increase in sovereign debt relative to GDP, has been a global phenomenon, following the financial crisis. Much of it has to do with the contraction in growth and the subsequent sluggish growth throughout the recovery (i.e. the GDP side of the ratio hasn’t been carrying it’s weight).
You can see in the chart above, the increasing debt situation isn’t specific to the U.S.
The euro zone tried the path of austerity back in 2011, and quickly found themselves back in recession, only re-emerging by promising to backstop the failing countries in the monetary union, and launching a massive QE program.
What about the government shutdown threats? Would it derail stocks? Stocks went up about 2% the last time the government shutdown in 2013. Before that was 1995-96 (stocks were flat) – and 1990 (stocks were flat).
Join our Billionaire’s Portfolio today to get your portfolio in line with the most influential investors in the world, and hear more of my actionable political, economic and market analysis. Click here to learn more.
It looks like we’ll get tax cuts approved before year end! And that will give us two of the four pillars of Trumponomics underway in the first year of the new administration.
What a difference four months makes.
Remember, we entered the year with prospects of a big corporate tax cut, a huge infrastructure spend, deregulation and incentives to bring trillions of U.S. corporate money home.
By this summer, the ability to execute on these policies, given the political gridlock and mudslinging, was beginning to look questionable.
The game changer was the hurricanes.
In my note on August 29th, I said: “I think it’s fair to say the optimism toward the President, the administration and Washington policy making has been waning with the lack of policy execution. And from the optics of it all, sentiment couldn’t go much lower. But in markets, turning points (bottoms and tops) in the prevailing trend are often triggered by a catalyst (big trend changes, by some sort of intervention).
With that, the hurricane will likely have little negative impact on overall growth, but it may do something positive for policy making (maybe a turning point).
Given the mess of the political landscape, and an economy that remains vulnerable and in need of fiscal stimulus and structural reform, the crisis in Texas might serve as a needed catalyst: 1) to offer an opportunity for Trump to show leadership in a time of crisis, an opportunity to earn support and approval, and 2) to engage support for rebuilding, not just in Texas but throughout the U.S. (i.e. the much needed economic catalyst of infrastructure spend)…
National crises tend to be unifying. And in the face of national crisis, the barriers to get government spending going get broken down.
So, as we discussed last week, it may be the hurricanes that become the excuse for lawmakers to stamp more spending projects which can ultimately become that big infrastructure spend. And the easing of social tensions and political gridlock on policy making would all be highly positive for the global economic outlook.”
Of course that was followed by the big hurricane in Florida, and then in Puerto Rico. All told, the damages are north of $250 billion.
Congress has approved, to this point, about $60 billion in aid for hurricanes and wildfires (as far as I can track). And that number will likely go much higher — well into nine figure territory (probably more like a quarter of a trillion dollars). For Katrina, the ultimate federal aid disbursed was $120 billion.
On that momentum the first tranche of aid passed back in September, Trump went right to tax cuts. Three months later, and tax cuts are coming.
So, quickly, the policy execution pendulum has swung. This should pop growth nicely next year (and in Q4), which we desperately need to break out of the post-crisis rut of weak demand, slow growth and low inflation.
What about the $20 trillion debt load the media loves to talk about? It’s a big number. So is the size of our economy – about $19 trillion. Sovereign debt isn’t about the absolute number. It’s about the size of debt relative to the size of the economy. With that, it’s about our ability to service that debt at sustainable interest rates. The choice of austerity in this environment, where the economy is fragile and growth has been sluggish for the better part of ten years, would send the U.S. economy back into recession (as it did in Europe). And the outlook for re-emerging would be grim. That would make our debt/gdp far inferior to current levels — and our ability to service the debt, far inferior.
On the other hand, with fiscal stimulus underway, don’t underestimate the value of confidence in the outlook (“animal spirits) to drive economic growth higher than the number crunchers in Washington can imagine (the same one’s that couldn’t project the credit bubble, and didn’t project the sluggish 10 years that have followed).
Join our Billionaire’s Portfolio today to get your portfolio in line with the most influential investors in the world, and hear more of my actionable political, economic and market analysis. Click here to learn