A key piece in the continuation of the global economic recovery will be a weaker dollar. It will drive a more balanced U.S. and global economy, and it will reflect strength in emerging markets (i.e. capital flows to emerging markets).
To this point, as we’ve discussed, higher U.S. rates have meant a stronger dollar. With global central banks moving in opposite directions in recent years, capital has flowed to the United States. But the emerging markets have suffered under this dynamic. As money has moved OUT of emerging market economies, their economies have weakened, their currencies have weakened, and their foreign currency denominated debt has increased.
But now we have a retrenchment from the Fed. And we have coordinated global monetary policy (facing in the same direction).
This sets up to solidify a long-term bear market for the dollar.
Let’s take a look at a couple of charts that argue the long-term trend is already lower, and the next leg will be much lower.
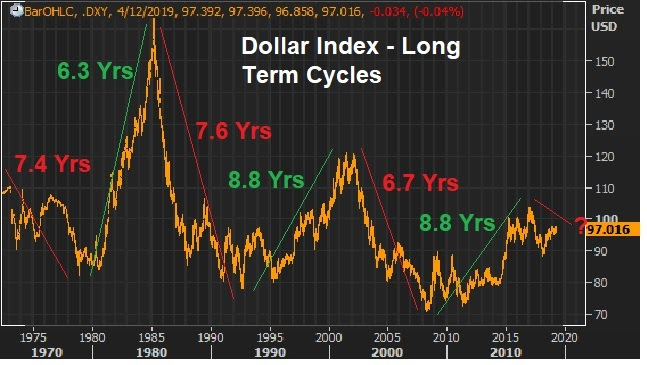
First, here’s a revisit of the long-term dollar cycles, which we’ve looked at quite a bit in this daily note.
Since the failure of the Bretton-Woods system, the dollar has traded in six distinct cycles – spanning 7.6 years on average. Based on the performance and duration of past cycles, the bull cycle is over, and the bear cycle is more than two years in.
With this in mind, if we look within this current bear cycle, technically the dollar is trading into a major resistance area – a 61.8% retracement. The next leg should be lower, and for a long period of time.
Trump wants a weaker dollar, and I suspect he’s going to get it.
Sign up to my Billionaire’s Portfolio and get my market beating Billionaires Portfolio … Live Portfolio Review conference calls … Weekly notes with updates and specific recommendations on following the best billionaire investors … Access to my member’s only area on the Billionaire’s Portfolio. Plus, my blog — full of information that will set you apart from other average investors.
Join now and get your risk free access by signing up here.
With a Fed decision queued up for tomorrow, let’s take a look at how the rates picture has evolved this year.
The Fed has continued to act like speculators, placing bets on the prospects of fiscal stimulus and hotter growth. And they’ve proven not to be very good.
Remember, they finally kicked off their rate “normalization” plan in December of 2015. With things relatively stable globally, the slow U.S. recovery still on path, and with U.S. stocks near the record highs, they pulled the trigger on a 25 basis point hike in late 2015. And they projected at that time to hike another four times over the coming year (2016).
Stocks proceeded to slide by 13% over the next month. Market interest rates (the 10 year yield) went down, not up, following the hike — and not by a little, but by a lot. The 10 year yield fell from 2.33% to 1.53% over the next two months. And by April, the Fed walked back on their big promises for a tightening campaign. And the messaging began turning dark. The Fed went from talking about four hikes in a year, to talking about the prospects of going to negative interest rates.
That was until the U.S. elections. Suddenly, the outlook for the global economy changed, with the idea that big fiscal stimulus could be coming. So without any data justification for changing gears (for an institution that constantly beats the drum of “data dependence”), the Fed went right back to its hawkish mantra/ tightening game plan.
With that, they hit the reset button in December, and went back to the old game plan. They hiked in December. They told us more were coming this year. And, so far, they’ve hiked in March and June.
Below is how the interest rate market has responded. Rates have gone lower after each hike. Just in the past couple of days have, however, we returned to levels (and slightly above) where we stood going into the June hike.
But if you believe in the growing prospects of policy execution, which we’ve been discussing, you have to think this behavior in market rates (going lower) are coming to an end (i.e. higher rates).
As I said, the Hurricanes represented a crisis that May Be The Turning Point For Trump. This was an opportunity for the President to show leadership in a time people were looking for leadership. And it was a chance for the public perception to begin to shift. And it did. The bottom was marked in Trump pessimism. And much needed policy execution has been kickstarted by the need for Congress to come together to get the debt ceiling raised and hurricane aid approved. And I suspect that Trump’s address to the U.N. today will add further support to this building momentum of sentiment turnaround for the administration. With this, I would expect to hear a hawkish Fed tomorrow.
Join our Billionaire’s Portfolio today to get your portfolio in line with the most influential investors in the world, and hear more of my actionable political, economic and market analysis. Click here to learn more.
Last week we discussed the building support for a next leg higher in commodities prices. China is clearly a very important determinant in where commodities go. And with the news last week about cooperation between the Trump team and China, on trade, we may have the catalyst to get commodities moving higher again.It just so happens that oil (the most traded commodity in the world) is rebounding too, on the catalyst of prospects of an OPEC extension to the production cuts they announced last November.In fact, overnight, Saudi Arabia and Russia said they would do “whatever it takes” to cut supply (i.e. whatever it takes to get oil prices higher). Oil was up big today on that news.When you hear these words spoken from policy-makers (those that can dictate outcomes), it should get everyone’s attention. Those are the exact words uttered by ECB head Mario Draghi, that ended the bond market assault in Spain and Italy that were threatening the existence of the euro and euro zone. The Spanish 10-year yield collapsed from 7.8% (unsustainable borrowing rate for the Spanish government, and threatening imminent default) to 1% over the next three years — and the ECB, while threatening to buy an unlimited amount of bonds to push those yields lower, didn’t have to buy a single bond. It was the mere threat of ‘whatever it takes’ that did the trick.
As for oil: From the depths of the oil price crash last year, remember, we discussed the prospects for a huge bounce. Oil prices at $26 were threatening to undo the trillions of dollars of work central banks and governments had done to stabilize the global economy. Central banks couldn’t let it happen. After a series of coordinated responses (from the BOJ, China, ECB and the Fed), oil bottomed and quickly doubled.
Also at that time, two of the best oil traders in the world were calling the bottom and calling for $70-$80 oil by this year (Pierre Andurand and Andy Hall). Another commodities king that called the bottom: Leigh Goehring.
Goehring, one of the best commodities investors on the planet, has also laid out the case for $100 oil by next year. He says he’s “wildly bullish” oil in his recent quarterly investor letter at his new fund, Goehring & Rozencwajg.
Goehring argues that the IEA inventory numbers are flawed. He thinks oil the market is already over-supplied and is in a draw, as of May of last year. With that, he thinks the OPEC cuts will ultimately exacerbate the deficit and send prices aggressively higher. He says “we remain ‘wildly’ bullish and believe that there is a very high probability of oil prices reaching triple digits in the first half of 2018.”
Follow This Billionaire To A 172% WinnerIn our Billionaire’s Portfolio, we have a stock in our portfolio that is controlled by one of the top billion dollar activist hedge funds on the planet. The hedge fund manager has a board seat and has publicly stated that this stock is worth 172% higher than where it trades today. And this is an S&P 500 stock!Even better, the company has been constantly rumored to be a takeover candidate. We think an acquisition could happen soon as the billionaire investor who runs this activist hedge fund has purchased almost $157 million worth of this stock over the past year at levels just above where the stock is trading now.So we have a billionaire hedge fund manager, who is on the board of a company that has been rumored to be a takeover candidate, who has adding aggressively over the past year, on a dip.
This will be an interesting week. We had almost three months of optimism priced into global markets following the November 8th elections. And then the tide turned when Trump gave his speech to the join sessions of Congress.
This is the buy-the-rumor sell-the-fact phenomenon we’ve discussed. People bought on anticipation of a big policy shift. And now they’re taking profit (raising cash) waiting to see it all executed — the prove-it-to-me phase.
I think we’re beginning to see the same phenomenon unfold in the Brexit saga. Brexit came before Trump, but the cycle has been slower and longer. Much like the Trump trend, the Brexit news started with an initial “sell everything” on the fear of the unknown, but soon thereafter, the “buy on anticipation of something better” prevailed. But it’s looking very vulnerable now to a turn in the tide.
On Friday, we looked at this next chart. This trend higher in UK stocks looks much like the Trump trend in U.S. stocks – a nice 45 degree climb from June of last year.
But as we discussed on Friday, the “prove-it-to-me” phase looks set to arrive this week in the Brexit story. With that, here’s what the chart looks like today …
This nine-month trend line in UK stocks gave way today – in part because of the softening in expectations about Trump policies, but largely because the UK Prime Minister is expected to officially notify the European Union on Wednesday, of the UK’s exit from the EU. Again, this would start the clock on the two year wind-down of the UK constituency in the EU. And the official negotiations will begin, on what the UK/EU relationship will look like – namely, on trade.
Expect the negotiations to be ugly in the early stages. Why? Because there is a lot to lose if it looks too easy. The future of the European Union and the common currency (the euro) hang in the balance on these negotiations. The most important job of EU officials, at this stage, is keeping other EU members from hitting the eject button, following the lead of the UK. A domino effect of exits would kill the EU and it would be the end of the euro. And that would have huge, destabilizing global ramifications.
With all of this in mind, it’s very likely that after long period of ultra-low volatility in markets, things will be a little more dicey in the months ahead. That should keep pressure on yields and should keep the correction in U.S. stocks intact.
In our Billionaire’s Portfolio, we’re positioned in a portfolio of deep value stocks that all have the potential to do multiples of what broader stocks do — all stocks owned and influenced by the world’s smartest and most powerful billionaire investors. Join us today and we’ll send you our recently recorded portfolio review that steps through every stock in our portfolio, and the opportunities in each.
As we head into the Fed tomorrow, stocks have fallen back a bit today.
Yesterday we looked at the nice 45 degree climb in stocks since Election Day. And the big trendline that looked vulnerable to any disruption in the optimism that has led to that climb. That line gave way today, as you can see.
The run up, of course, was on the optimism about a pro-growth government, coming in after a decade of underwhelming growth. The dead top in stocks took place the day after President Trump’s first speech before the joint sessions of Congress. There is a phenomenon in markets where things can run up as people “buy the rumor/news” and then sell-off as people “sell the fact.”
It’s a reflection of investors pricing new information in anticipation of an event, and then selling into the event on the notion that the market has already valued the new information. It looks like that phenomenon may be transpiring in stocks here, especially given that the timeline of tax reform and infrastructure spending looks, now, to be a longer timeline than was anticipated early on.
And as we discussed yesterday, it happens to come at a time where some disruptive events are lining up this week: from a Fed rate hike, to Dutch elections, to Brexit, to G20 protectionist rhetoric.
Stocks are up 6% year-to-date, still in the first quarter. That’s an aggressive run for the broad stock market, and we’re now probably seeing the early days of the first dip, on the first spell of profit taking.
What about oil? Oil and stocks traded tick for tick for the better part of last year, first when oil crashed to the mid-$20s, and then when oil proceeded to double from the mid-$20s. Over the past few days, oil has fallen out of it’s roughly $50-$55 range of the Trump era. Is it a drag on stocks and another potential disrupter? I don’t think so. Oil became a risk to stocks and the global economy last year because it was beginning to trigger bankruptcies in the American shale industry, and was on pace to spread to banks, oil producing countries and the global financial system. We now have an OPEC production cut under the belt and a highly influential oil man, Tillerson, running the State Department. With that, oil has been very stable in recent months, relative to the past three years. It should stay that way – until demand effects of fiscal policy start to show up, which should be very bullish for oil.
In our Billionaire’s Portfolio, we’re positioned in a portfolio of deep value stocks that all have the potential to do multiples of what broader stocks do — all stocks owned and influenced by the world’s smartest and most powerful billionaire investors. Join us today and we’ll send you our recently recorded portfolio review that steps through every stock in our portfolio, and the opportunities in each.
After the past two weeks, that included a Fed decision, more BOJ action, the approval of Japanese fiscal stimulus, a rate cut and the return to QE for the Bank of England, and a strong jobs report, this week is a relative snoozer.
With that, every headline this week seems to contain the word Trump. Clearly the media thought a post by the former Fed Chairman, the architect of the global economic recovery and interventionist strategies that continue to dictate the stability of the global economy (and world, in general) today, wasn’t quite as important as Trump watching.
On Monday, Ben Bernanke wrote a blog post that laid out what appears to be his interpretation of a shift in gears for the Fed – an important message. Don’t forget, this is also the guy that may have the most intimate knowledge of where the world has been over the past decade, what it’s vulnerable to, and what the probable outcomes look like for the global economy. And he’s advising one of the biggest hedge funds in the world, the biggest bond fund in the world and one of the most important central banks in the world (at the moment), the Bank of Japan. And it’s safe to assume he still has influence plenty of influence at the Fed.
My takeaway from his post: The Fed’s forward guidance of the past two years has led to a tightening in financial conditions, which has led to weaker growth, lower market interest rates and lower inflation.
Why? Because people have responded to the Fed’s many, many promises of a higher interest rate environment, by pulling in the reins somewhat.
To step back a bit, while still in the midst of its third round of QE, the Fed determined in 2012, under Bernanke’s watch, that words (i.e. perception manipulation) had been as effective, if not more, than actual QE. In Europe, the ECB had proven that idea by warding off a bond market attack and looming defaults in Spain and Italy, and a collapse of the euro, by simply making promises and threats. With that in mind, and with the successful record of Bernanke’s verbal intervention along the way, the Fed ultimately abandoned QE in favor of “forward guidance.” That was the overtly stated gameplan by the Fed. Underpin confidence by telling people we are here, ready to act to ensure the recovery won’t run off of the rails — no more shock events.
The “forward guidance” game was working well until the Fed, under Yellen, started moving the goal posts. They gave a target on unemployment as a signal that the Fed would keep rates ultra low for quite some time. But the unemployment rate hit a lot sooner than they expected. They didn’t hike and they removed the target. Then they telegraphed their first rate hike for September of last year. Global markets then stirred on fears about China’s currency moves, and the Fed balked on its first rate move.
By the time they finally moved in December of last year, the market was already questioning the Fed’s confidence in the robustness of the U.S. economy, and with the first rate hike, the yield curve was flattening. The flattening of the yield curve (money moving out of short term Treasuries and into longer term Treasuries, instead of riskier assets) is a predictor of recession and an indicator that the market is betting the Fed made/is making a mistake.
And then consider the Fed’s economic projections that include the committee’s forecasts on interest rates. By showing the market/the world an expectation that rates will be dramatically higher in the coming months, quarters and years, Bernanke argued in his post that this “guidance” has had the opposite of the desired effect — it’s softened the economy.
So in recent months, starting back in March, the Fed began dramatically dialing back on the levels and speed they had been projecting for rates. It’s all beginning to look like the Fed should show the world they are positioned to well underestimate the outlook, rather than overestimate it, as it’s implied by Bernanke. The thought? Perhaps that can lead to the desired effect of better growth, hotter inflation.
This post by Bernanke is reversing some of the expectations that had been set in the market for a September or December rate hike by the Fed. And the U.S. 10-year yield has, again, fallen back — from 1.62% on Monday to a low of 1.50% today. Still, the Fed showed us in June they expect one to two hikes this year. Given where market rates are, they may still be overly hawkish.
This is the perfect time to join us in our Billionaire’s Portfolio, where we follow the lead of the best billionaire investors in the world. You can join us here.
Yesterday we walked through some charts from key global stock markets. As we know, the S&P 500 has been leading the way, printing new highs this week.
U.S. stocks serve as a proxy on global economic stability confidence, so when stocks go up in the U.S., in this environment, there becomes a feedback loop of stability and confidence (higher stocks = better perception on stability and confidence = higher stocks …)
That said, as they begin to capitulate on the bear stories for stocks, the media is turning attention to opportunities in emerging markets. But as we observed yesterday in the charts, you don’t have to depart from the developed world to find very interesting investment opportunities. The broad stock market indicies in Germany and Japan look like a bullish technical breakout is coming (if not upon us) and should outpace gains in U.S. stocks in second half of the year.
Now, over the past few weeks, we’ve talked about the slide in oil and the potential risks that could re-emerge for the global economy and markets.
On Wednesday of last week, we said this divergence (in the chart below) between oil and stocks has hit an extreme — and said, “the oil ‘sharp bounce’ scenario is the safer bet to close the gap.”
Sources: Billionaire’s Portfolio, Reuters
Given this divergence, a continued slide in oil would unquestionably destabilize the fundamentals again for the nascent recovery in energy companies.
With that, and given the rescue measures that global central banks extended in response to the oil bust earlier this year, it was good bet that the divergence in the chart above would be closed by a bounce back in oil.
That’s been the case as you can see in the updated chart below (the purple line rising).
Sources: Billionaire’s Portfolio, Reuters
At the peak today, oil had bounced 11% in just five trading days. Oil sustaining above the $40 is key for the stability of the energy industry (and thus the quelling the potential knock-on effects through banks and oil producing sovereigns). Below $40 is the danger zone.
In a fairly quiet week for markets (relative to last week), there was a very interesting piece written by former Fed Chairman Ben Bernanke yesterday.
Tomorrow we’ll dig a little deeper into his message, but it appears that the Fed’s recent downgrade on what they have been projecting for the U.S. economy (and the path of policy moves) is an attempt to stimulate economic activity, switching for optimistic forward guidance (which he argues stifled activity) to more pessimistic/dovish guidance (which might produce to opposite).
Remember, we’ve talked in recent months about the effect of positive surprises on markets and the economy. We’ve said that, given the ratcheting down of earnings expectations and expectations on economic data, that we were/are set up for positive surprises. Like it or not, that’s good for sentiment. And it’s good for markets. And it can translate into good things for the economy (more hiring, more investment, more spending).
The positive surprises have been clear in earnings. It’s happening in economic data. It looks like the Fed is consciously playing the game too.
This is the perfect time to join us in our Billionaire’s Portfolio, where we follow the lead of the best billionaire investors in the world. You can join us here.
Today we want to look at some key charts as we head into the week.
First, to step back a bit, as we started last week, we had some big market events ahead of us. Japan was due to approve a big fiscal stimulus plan. The Bank of England was meeting on rates and the U.S. jobs report was on the docket to wrap up the first week of August.
As we discussed Thursday, the BOE announced they’ve returned to the QE game. Japan doubled the size of its stock buying plan. And the jobs report came in Friday with another solid report. As we thought, despite the volatility in the monthly numbers the media likes to overanalyze, the longer term trend continues to clearly argue the health of the job market is in good shape, and not a legitimate concern for the Fed’s rate path.
All together, the events of the week only solidified reasons to be long stocks.
Most importantly, stocks have been, and continue to be, a key tool for central bankers in this global economic recovery. They want and need stocks higher. A higher stock market provides fuel for economic activity by underpinning confidence and wealth creation, which encourages hiring, spending and more investment.
With that, as we’ve said, this is the sweet spot for stocks, where good news is good news for stocks (better outlook triggers capital flows out of cash and bonds, and into stocks), and bad news is good news for stocks (it triggers more stimulus).
When it comes to stocks, back on May 25th, we said “everyone could benefit by having a healthy dose of ‘fear of missing out.’ Stock returns tend to be lumpy over the long run. When we you wait to buy strength, you miss out on A LOT of the punch that contributes to the long run return for stocks.”
Fast forward to today, and the S&P 500 has printed yet another new record high.
But the horse is not already out of the barn on global stocks (including U.S. stocks).
Let’s take a look at the chart on the S&P 500…
Sources: Billionaire’s Portfolio, Reuters
You can see, we’ve broken out in U.S. stocks (very bullish).
Next, in the UK, the place people were most afraid of, just a little more than a month ago, traded near 14-month highs today and is nearing a breakout to record highs, with support of fresh central bank easing from the Bank of England.
Sources: Billionaire’s Portfolio, Reuters
In the next two charts, we can see the opportunities to buy the laggards, in areas that have been beaten down on broader global economic concerns, but also benefiting directly from domestic central bank easing.
In the chart below, you can see German stocks have fallen hard from the highs of last year, but have technically broken the corrective downtrend. A return to the April highs of last year would be a 19% return for current levels.
Sources: Billionaire’s Portfolio, Reuters
In the next chart, Japanese stocks also look like a break of this corrective downtrend is upon us. A return to the highs of last year would be a 25% run for the Nikkei. As we discussed last week, the sharp ascent in the chart below from the lower left corner of the chart can be attributed to the BOJ’s QE program, which first included a 1 trillion yen stock buying program and was later tripled to three trillion (a driver of the run from around 15k to 21k in the index). Last week, that stock buying program was doubled to six trillion yen.
Sources: Billionaire’s Portfolio, Reuters
Given the trajectory of the charts above (global stocks), which both promote and reflect global confidence, and the given lack of consequence that QE has had on meaningful inflation, the world’s inflation-fear hedge, gold, looks like its run into brick wall up here.
Sources: Billionaire’s Portfolio, Reuters
Remember, we have a convergence of fresh monetary policy in the world this year, with fiscal policy in Japan, and the growing appetite for fiscal policy in other key economies. That’s powerful fuel for global economic growth, risk appetite and stocks.
This is the perfect time to join us in our Billionaire’s Portfolio, where we follow the lead of the best billionaire investors in the world. You can join us here.
As we’ve said, oil has been quietly sliding over the past three weeks. It closed yesterday more than 20% off of the highs of the year.
And we looked at this chart and said, this divergence has hit an extreme, something has to give.
Source: Billionaire’s Portfolio, Reuters
Yesterday it was stocks. Today it was a sharp bounce in crude – up 4%. The oil “sharp bounce” scenario is the safer bet to close the gap on the chart above.
Alternatively, oil under $40 puts it in the danger zone for the global economy and broad financial market stability. With that, we had a close in the danger zone, under $40, yesterday. But it may turn out to be just a brief visit.
If we look at the longer term chart, the 200 day moving average comes in right in this $40 area ($40.67). Again, we had a close below yesterday, but a close back above the 200 day moving average today.
Sources: Billionaire’s Portfolio, TradingView
For technicians, two consecutive closes below the 200 day moving average would create some concern for this post-oil price bust recovery.
In that case, many companies in the struggling energy sector would be back on bankruptcy watch. But the global economic recovery can’t afford another bout with weaker oil prices, and the ugly baggage that comes with it (oil company defaults, which would lead to financial system instability and sovereign defaults). If two of the best billionaire oil traders in the world are right about oil, and we see $80 in the next year, this dip is a great buying opportunity (for the underlying commodity and energy stocks).
Tomorrow, we hear from the Bank of England. The expectations are that the BOE will cut rates to support economic activity in the face of Brexit uncertainty. But there’s also a decent bet being wagered that the BOE will return to QE (a second post-global financial crisis bond buying program). History tells us that, in this environment, central banks like to save bullets for the moments when crisis and fear is peaking. With that, the BOE may disappoint tomorrow. If so, it could pour some gas on the nascent rise in market rates that started yesterday in Japanese, German and American 10-year yields.
Don’t Miss Out On This Stock
In our Billionaire’s Portfolio we followed the number one performing hedge fund on the planet into a stock that has the potential to triple on an upcoming event.
This fund returned an incredible 52% last year, while the S&P 500 was flat. And since 1999, they’ve done 40% a year. And they’ve done it without one losing year. For perspective, that takes every $100,000 to $30 million.
We want you on board. To find out the name of this hedge fund, the stock we followed them into, and the catalyst that could cause the stock to triple by the end of the month, click here and join us in our Billionaire’s Portfolio.
Yesterday we pointed to the renewed risk that oil represented for stocks.
The persistent bleed in the price of oil for the past three weeks has been with little attention. Even the energy stocks, which have had huge runs since oil bottomed in February, were largely ignoring the slide in the most significant input for those businesses.
As we said yesterday, oil continued to leak lower, even as stocks printed a fresh record high yesterday. As oil went out at the key $40 level, the divergence between oil and stocks had reached an extreme. We said something has to give.
Today, it’s been stocks. Stocks have fallen back, following the lead of further declines in crude — which settles BELOW $40 today.
Why is oil important for stocks?
As we’ve said in a world where stability is king, central bankers have been very sensitive to swings in key financial markets, with the idea that confidence and the perception of stability can quickly become unhinged by market moves. When that happens, it becomes a big, viable threat to the global economic recovery and outlook.
Now, we’ve talked a lot about the divergence between yields and stocks too. In this post-global financial crisis world, when people feel better about the global outlook, they take risk. That means they buy stocks and they move money OUT of the “safe-haven” treasury market. That means yields should move higher, while stock move higher.
That hasn’t been the case. Yields have continued to trade toward the record lows in recent weeks, even as stocks have traded to new record highs. Why? It’s being driven by capital flows and speculation related to central bank action in Japan and Europe. U.S. Treasuries are offering both a relative safe haven, and a positive yield in a world of negative yields. That keeps freshly printed global money flowing into U.S. Treasuries, which drives up price, and drives down the yield.
With that, logic has again been tossed on its head today. Stocks are falling, along with oil. This is typically a trigger for some elevated risk aversion. One would think Treasuries would be rallying today, pushing yields lower. It has been the opposite.
It may have a lot to do with the fiscal stimulus package that was approved today (overnight) in Japan. The central banks have had the pedal pinned to the floor on monetary policy for the better part of the past seven years, and they’ve gotten no help from governments on fiscal stimulus. Today’s move in Japan may represent a changing of the stimulus guard. With that, the bet on lower yields is being reversed, not just in the U.S., but in Europe and Japan.
Don’t Miss Out On This Stock
In our Billionaire’s Portfolio we followed the number one performing hedge fund on the planet into a stock that has the potential to triple on an upcoming event.
This fund returned an incredible 52% last year, while the S&P 500 was flat. And since 1999, they’ve done 40% a year. And they’ve done it without one losing year. For perspective, that takes every $100,000 to $30 million.
We want you on board. To find out the name of this hedge fund, the stock we followed them into, and the catalyst that could cause the stock to triple by the end of the month, click here and join us in our Billionaire’s Portfolio.
We make investing easy. We follow the guys with the power and the influence to control their own destiny – and a record of unmatchable success. And you come along for the ride.


 With a Fed decision queued up for
 Last week we discussed the building support for a next leg higher in commodities prices. China is clearly a very important determinant in where commodities go. And with the news last week about cooperation between the Trump team and China, on trade, we may have the catalyst to get commodities moving higher again.It just so happens that oil (the most traded commodity in the world) is rebounding too, on the catalyst of prospects of an OPEC extension to the production cuts they announced last November.In fact, overnight, Saudi Arabia and Russia said they would do “whatever it takes” to cut supply (i.e. whatever it takes to get oil prices higher). Oil was up big today on that news.When you hear these words spoken from policy-makers (those that can dictate outcomes), it should get everyone’s attention. Those are the exact words uttered by ECB head Mario Draghi, that ended the bond market assault in Spain and Italy that were threatening the existence of the euro and euro zone. The Spanish 10-year yield collapsed from 7.8% (unsustainable borrowing rate for the Spanish government, and threatening imminent default) to 1% over the next three years — and the ECB, while threatening to buy an unlimited amount of bonds to push those yields lower, didn’t have to buy a single bond. It was the mere threat of ‘whatever it takes’ that did the trick.


 This will be an interesting week. We had almost three months of optimism priced into global markets following the November 8th elections. And then the tide turned when Trump gave his speech to the join sessions of Congress.


