June 21,  5:00 pm EST

As we end the week, any questions on whether or not the central banks have your back, have been answered.

Just as they have for the better part of a decade, they have no choice but to respond to any shocks that might knock the global economic recovery off path.  And as I said yesterday, the major central banks of the world have lined up, because they are unable to predict what Trump will do on trade.  To maintain market confidence, they have to posture as if they assume the trade war will go on indefinitely.

On that note, it seems to be priced into the global treasury markets and the gold market that China can’t accept Trump’s deal (or at least can’t deliver on the current demands of the deal).  It’s politically unpalatable and an existential threat to the Chinese Communist Party.  So, the question is, will Trump end the trade dispute with more bark than bite?  Will he do a deal (not the deal) and remove the overhang of uncertainty from the global economy, and an election coming next year.   Next week should be interesting, as we await the Trump/Xi meeting at the G20 (scheduled for Friday 6/28 and Saturday 6/29).

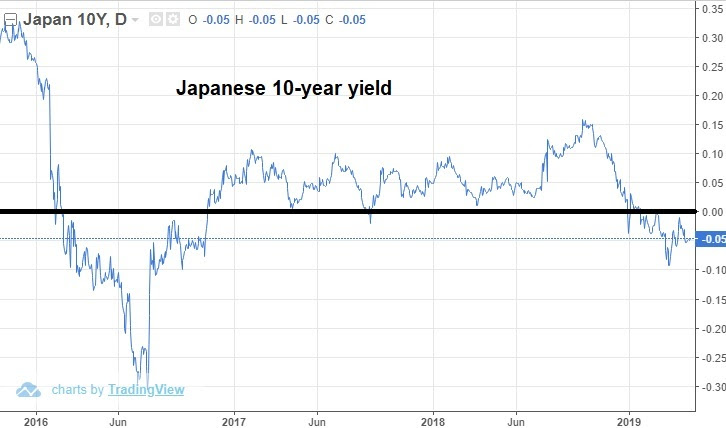
As we head into this weekend, markets hang around big levels: record highs in stocks, the big 1,400 level in gold, just above 2% on the 10-year, and closing in on 10k in Bitcoin (a haven for Chinese capital flight).

June 12,  5:00 pm EST

Remember, last week we talked about why $50 is a very important level for oil.

A recent Dallas Fed survey has the breakeven level for shale producers at $50.  In other words, the shale industry needs oil prices above $50 to produce profitably.

If the shale industry becomes unprofitable, that becomes a problem. As we found in 2016, when oil prices crashed, the shale industry became vulnerable.  Defaults started lining up in the industry, which made banks vulnerable.  When banks are vulnerable, credit tends to tighten and the financial system can quickly become unstable.

Now, as we know, the price of oil bounced from that $50 area last week, but we’re getting another test today.  Oil was the mover of the day — down close to 4%, and back under $51.

This, I suspect, will play a very important role in the Fed decision next week.

Despite the fact that expectations point to a rate cut in July, we’ve discussed the pressures building that might lead the Fed to move next week (which would be a big surprise for markets). Oil plays into that scenario.

Stocks and crude oil have been two clear influences on Fed policy over the past few years.  The latter weighs on inflation.  While the Fed claims to ignore the influence of food and energy in their inflation measure, they have a history of acting when oil moves sharply.  On that note, oil is down 22% over the past year.  And, again, we’re testing an important level that can have spillover effects into the economy.  That’s why a sharp decline in oil prices tends to influence stocks.  That’s why the charts of stocks and oil have tracked so closely …


So, we’ve had a nice bounce in stocks over the past week or so.  We had the same for crude.  But now crude is back testing the lows of this decline.

If you haven’t signed up for my Billionaire’s Portfolio, don’t delay … we’ve just had another big exit in our portfolio, and we’ve replaced it with the favorite stock of the most revered investor in corporate America — it’s a stock with double potential.

Join now and get your risk free access by signing up here.

June 11,  5:00 pm EST

Yesterday we talked about the surgical manipulation Trump is (seemingly) attempting to perform, to force the Fed’s hand on a rate cut — and therefore, to optimize the economy heading into the election.

At this stage, the harder he is on China, the lower stocks go, which puts more pressure on the Fed to cut rates.  But as the Fed has now signaled it’s prepared to act, stocks have risen, which makes it less likely that the Fed will act.

With that, yesterday, I surmised that Trump might ramp up the rhetoric as we near the June 19th Fed meeting, to keep a lid on the bounce in stocks.

On that note, Trump had some very firm comments on China trade this morning, implying he’s not willing to give any ground.  He says “we’re going to either do a great deal with China or we’re not doing a deal at all.”  He gets his demands, or no deal.  Again, as we discussed yesterday, he’s in the driver’s seat.  And he said as much today:  “It’s me right now that’s holding up the deal.”

Stocks have given some back today, after a six day rally from the lows of this recent correction.  And we get this chart going into the close…


As you can see, the S&P 500 put in a big technical reversal signal — a bearish outside day.  The last signal like this we observed was on May 1, which resulted in a 7.6% correction.  Perhaps we have a signal here of some softness in stocks to come, until we get to the June 19 Fed meeting.

If you haven’t signed up for my Billionaire’s Portfolio, don’t delay … we’ve just had another big exit in our portfolio, and we’ve replaced it with the favorite stock of the most revered investor in corporate America — it’s a stock with double potential.

Join now and get your risk free access by signing up here.

May 31, 5:00 pm EST

We end the month of May today.  Things were going quite well for markets, with stocks sitting on record highs, until Trump did this over the first weekend of the month …


With the above in mind, let’s look back at my May 6th note: “Why would Trump risk complicating a deal, even more, by threatening China with a deadline/tariff increase? Because he has leverage. He has a stock market near record highs, and a strong economy and the winds of ultra-easy global monetary policy at his back …

So, Trump has a winwin going into the week. If the threat works, he gets a deal done, and likely gives less to get it done. If China backs off, stocks go down, and he gets the Fed’s rate cut he’s been looking for–stocks go back up.”

As we know, China walked.  And Trump is now using a similar position of strength to influence policy with Mexico.  As such, stocks have now fallen nearly 7% from the highs. And the prospects for a Fed rate cut are looking very strong.

How strong?  The interest rate market is pricing in a 90% chance of a rate cut by year end, and a 60% chance of a two rate cuts.  But despite the sharp decline in global interest rates, the market seems to be well underestimating the chances for a Fed rate cut this month — at the June 19 Fed meeting.

There are two clear influences on Fed policy over the past few years.  Stocks and crude oil.  The latter weighs on inflation.  While the Fed claims to ignore the influence of food and energy in their inflation measure, they have a history of acting when oil moves sharply.  And inflation is already running at very soft levels.  On that note, what was the biggest loser for the day, week and month?  Crude oil.  Crude was down 7.5% today, 10% for the week, and 16% for the month.

If you haven’t signed up for my Billionaire’s Portfolio, don’t delay … we’ve just had another big exit in our portfolio, and we’ve replaced it with the favorite stock of the most revered investor in corporate America — it’s a stock with double potential.

Join now and get your risk free access by signing up here.

May 30, 5:00 pm EST

The first revision of Q1 GDP came in this morning, in-line with expectations (at 3.1%).  As yields swoon, and stocks have given back some gains for the month, this growth number today is good reminder that the state of the U.S. economy is good. 

Remember, back in April, the first look at Q1 GDP came in as a huge positive surprise (at 3.2%).   Many were expecting it to be a terrible quarter.  Goldman Sachs thought the quarter would produce just 0.7% growth.  They were wrong, and they weren’t alone.  At the end of the first quarter, the Atlanta Fed’s GDP model was estimating that the economy grew at only 0.3% in Q1.

With that in mind, don’t get too caught up in the souring growth story.  At the moment, the consensus view on Wall Street is for Q2 growth to come in at 1.8%.   And the Atlanta Fed model is looking for 1.3%.  Both are well lower than the White House envisioned 3%+ growth trend.

But, for perspective, there are some clear factors working in favor of the higher (not lower) growth case.

The job market is strong.  We have monthly new jobs running at a 12-month average of 218k.  That’s well above pre-financial crisis average monthly job growth. The unemployment number at 3.6% is the lowest since 1969.

Most importantly:  Wage growth has been on the move for the past 18 months, now sustaining above 3%.  And Q1 productivity came in at 3.6%, the hottest productivity reading in almost a decade.  The economy can grow by expanding the size of the workforce or the productivity of the workforce.  We’re finally getting solid productivity growth.


May 29, 5:00 pm EST

We’ve talked about the signal the interest rate market is giving: with rates at these levels, the bond market may force the Fed’s hand — forcing a June rate cut.

Still, the slide in the 10-year yield from 2.75 (in March) to 2.20 (the low today) is well overstating the risks in the global economy.  That’s more than 100 basis points off of the highs of just six months ago.  And the high to low of the last five trading days has been almost a full quarter point (23 basis points).  It makes no sense.

Many would assume it’s related due to the trade standstill.  But the IMF has only cut its growth estimate by 3/10ths of a percent from the tariff escalations.  That still projects a 3% growth from the global economy (much better than the average of the past 10-years).

Meanwhile, a U.S. 10-year and 2.20%, and German and Japanese yields well in negative territory are pricing in global recession (if not worse).  Is Japan buying U.S. Treasuries, and therefore pushing down global yields?  Maybe.

As we know, the slide in yields has weighed on confidence, and therefore stocks for the month of May.  But today, we ran into a huge technical level in the S&P 500 — the 200-day moving average.  And we had a big bounce.  I suspect we’ve seen the bottom of this move in stocks and yields.  We shall see. 


If you haven’t signed up for my Billionaire’s Portfolio, don’t delay … we’ve just had another big exit in our portfolio, and we’ve replaced it with the favorite stock of the most revered investor in corporate America — it’s a stock with double potential.

Join now and get your risk free access by signing up here.

May 15, 5:00 pm EST

The bounce for stocks continued today.  But global yields were broadly weak.

Why?  Is this a market that’s pricing in more global central bank easing (therefore lower rates, higher asset prices)?

It might appear that way.  Trump has been asking for a rate cut.  In fact, yesterday he tried to make the case for more QE (let’s assume he means ending the Fed’s balance sheet reduction program).  The fed funds futures market has been pricing in a rate cut for a while now — now looking for a 50% chance of a cut by September and a 75% chance of a cut by year end.

Additionally, the German 10-year yield hit the lowest level since 2016 — negative 10 basis points.  And the Japanese 10-year yield traded down to negative 5 basis points today (chart below).  


Now, as you can see, the 10-year in Japan has been back in negative yield territory all year — and sustainably, for the first time since 2016.

The last time rates were down here, the BOJ added some wrinkles in their QE plan.  Instead of targeting a size of asset purchases, they began targeting a zero yield on the Japanese government bond.  So, as long as the yield is positive in Japan, the Bank of Japan has the mandate to buy unlimited assets (print unlimited yen) to push the yield back to zero.  They already own half of the JGB market.  So, how can they influence yields higher from here?  They can sell JGB’s.  What might they do with those proceeds?  Buy global stocks?

If you haven’t signed up for my Billionaire’s Portfolio, don’t delay … we’ve just had another big exit in our portfolio, and we’ve replaced it with the favorite stock of the most revered investor in corporate America — it’s a stock with double potential.

Join now and get your risk free access by signing up here.

May 14, 5:00 pm EST

Yesterday we looked at the big technical support level for the Dow — the 200-day moving average.

That level held beautifully, and stocks bounced aggressively today.

Here’s a look at that chart now ….


With stocks bouncing after a quick 5% correction, we also have a big technical area of support holding in the interest rate market.  As you can see in this next chart, the 10-year yield is holding this big trendline into 2.40%.

So, we have a stronger dollar today, strong commodities prices, higher global stocks and higher rates.  What’s different today, relative to yesterday?  Nothing.

We have a market underpinned by better than expected economic data and earnings. And (different than December) we have a Fed that is in a relatively accommodative stand, promising to do nothing to disrupt the trajectory of the economy and stock market.  That makes stocks a buy on dips.

May 10, 5:00 pm EST

We end the week with continued stalemate on a trade deal.  Given that trade talks will continue (despite the tariff escalation), it’s not considered a “no deal.”  That’s a relative positive for markets.

As we discussed, as long as Trump will keep the door open, the Chinese will keep talking, and will (in the meantime) protect their exports by weakening the currency.  The yuan is now trading at its weakest level since early January, when trade talks were re-opened after a month long stalemate.

Now, let’s talk about the Uber IPO today …

It didn’t go well for Silicon Valley.  Uber started trading publicly below the range they expected, and instead of getting a huge opening day “lyft”, it traded down on the day.

We’ve talked quite a bit about the IPOs coming from the Silicon Valley hype machine.  Lyft got it all started, and here’s what that chart looks like now…


With this above chart in mind and the performance of Uber today, let’s revisit an excerpt from my note from last month …

Pro Perspectives – April 16, 2019

Lyft and Uber, dumping shares on the public at a combined $140 billion plus valuation, may mark the end to the Silicon Valley boom cycle.

As we know, Lyft was valued as high as $25 billion when it started trading publicly.  Some paid a $25 billion valuation for the privilege of owning a company that did a little over $2 billion in revenue, while losing almost a billion dollars — with slowing revenue growth and widening losses. It has now shed about $9 billion in market cap in thirteen days.

Uber is on deck.  Uber filed its S-1 this week.  In this public disclosure document, we find a company that has privately raised $24 billion, valued at $68 billion in the private market, that has been thought to float shares at as much as $120 billion valuation.  This is a company that (like Lyft) also with slowing revenue growth and widening losses.  Losses?  The S-1 shows a swing from $ 4 billion loss in 2017, to a near $1 billion profit in 2018.  But if we back out the a couple of unusual items (like the gain of a divestiture of some foreign businesses and an unrealized gain in an “investment”) the company lost $4.2 billion on $11 billion in revenue.

As we discussed last month, the hyper-growth valuations on these perceived hyper-growth companies, are unlikely to get hyper-growth at this stage.  That will be a problem for those taking the bait on the IPO.”

If you haven’t signed up for my Billionaire’s Portfolio, don’t delay … we’ve just had another big exit in our portfolio, and we’ve replaced it with the favorite stock of the most revered investor in corporate America — it’s a stock with double potential.

Join now and get your risk free access by signing up here.

May 7, 5:00 pm EST

As we get closer to the hard deadline on a U.S./China trade deal, markets are adjusting for the potential of a no deal/ tariff escalation.

What does that look like?  U.S. stocks are now off 2% from the highs of the year.  That still puts us up 15% year-to-date.

The bigger adjustment is coming in China.  As we discussed yesterday, China is in the position of weakness in these negotiations.  The U.S. economy is strong.  China’s economy has been very weak.  A more expensive and indefinite trade dispute puts downward pressure on both economies (and the global economy), but it puts the Chinese in dangerously slow economy — which becomes politically dangerous for the Chinese Communist Party.

As such, here’s what Chinese stocks have done in the past eight days …


And, perhaps as a warning shot, China is starting to move their currency.

As we’ve discussed, China has used their currency (a weak currency) as the primary tool to achieve their extraordinary economic ascent over the past two decades — cornering the world’s export market.

We should expect, when their backs are against the wall, with a dim economic outlook, they will go back to weakening the yuan.  That’s what they have been doing since Trump’s tariff threat on Sunday.  They adjusted down the yuan yesterday by almost 1%.  That doesn’t sound like much, within China’s currency regime, it’s a big move.  We saw a one-off move like that once last year.  The other time was August of 2015, which led to fears that China might devalue the yuan. That set off a global market rout.

With the above said, China is sending Hui for the meetings that are scheduled to run Thursday and Friday.  Hui has been the point-man on trade negotiations.  His presence, in light of the tariff threats, give some encouragement that China has intentions to get a deal done.

If you haven’t signed up for my Billionaire’s Portfolio, don’t delay … we’ve just had another big exit in our portfolio, and we’ve replaced it with the favorite stock of the most revered investor in corporate America — it’s a stock with double potential.

Join now and get your risk free access by signing up here.