Stocks have now opened the year up 4%. Global interest rates are on the move, with the U.S. 2-year Treasury trading above 2% for the first time since 2008. Oil is trading in the mid $60s. And base metals are trading toward the highest levels of the young, two-year bull market in commodities.
This all looks like a market that’s beginning to confirm a real, sustainable economic recovery – anticipating much better growth than what we’ve experienced over the past decade.
If that’s the case, we should expect a big adjustment coming in inflation readings. And with that, we should expect a big adjustment coming for global interest rates. We’ll likely have a 10-year yield with a “3” in front of it before long. And that will have a meaningful impact on key consumer borrowing rates (especially mortgages).
On the inflation note, we’ve talked this week about the impact of higher oil prices on inflation and the impact it may have on the path of central bank policies (most importantly, the speed at which QE may be coming to an end in Europe and Japan).
You can see in this chart, the very tight relationship of oil prices and inflation expectations.
Now remember, one of the best research-driven commodities investors (Leigh Goehring) thinks we may see triple-digit oil prices — this year! This has been a very contrarian viewpoint, but beginning to look more and more likely. He predicted a surge in global oil demand (which has happened) and a drawdown on supplies (which has been happening at “the fastest rate ever experienced”). He says, with the OPEC production cuts (from November 2016), we’re “traveling down the same road” as 2006, which drove oil prices to $147 barrel by 2008.
Bottom line, this is an inflationary tale. If we had to search for a market that might be telling us this story (i.e. inflation is finally leaving the station), the first place people might look is the price of gold. What has gold been doing? It has been on a tear. Gold is up 8.3% over the past month.
For help building a high potential portfolio, follow me in our Billionaire’s Portfolio subscription service, where you look over my shoulder as I follow the world’s best investors into their best stocks. Our portfolio of highest conviction, billionaire-owned stocks is up close to 50% over the past two years. You can join me here and get positioned for a big 2018.
Interest rates are on the move today. So is oil. And the latter has a lot to do with the former.
For much of the past quarter we’ve talked about how disconnected the interest rate market has been from the stock market and the economy.
With stocks putting up 20% last year, the economy growing at close to 3% and unemployment at 4%, and with FIVE Fed rate hikes now in this tightening cycle, the yield on the 10-year Treasury has defied logic.
But as we’ve discussed, we should expect that logic to be a little warped when we’re coming out of an unprecedented global economic crisis that was combatted by an unprecedented and globally coordinated monetary policy. And that continues to create dislocations in financial markets. Specifically, when global central banks continue to print money, and indiscriminately buy U.S. Treasurys with that freshly printed money (i.e. the dollars the trade for it), they will keep market rates pinned down. And they have done just that. Of course, that helps fuel the U.S. and global recovery, as it keeps borrowing and service rates cheap for things like mortgages, consumer loans, corporate debt and sovereign debt.
But last month, we talked about where the real anchor now exists for global interest rates. It’s in Japan. As long as Japan is pegging the yield on the 10-year Japanese government bond at zero, they will have license to print unlimited yen, and buy unlimited global government bonds, and anchor rates.
What would move Japan off of that policy? That’s the question. When they do abandon that policy (pegging JGB yields at zero), it will signal the end of QE in Japan and the end of global QE. Rates will go on a tear.
With that the architect of the stimulus program in Japan, Shinzo Abe, said today that he would keep the pedal to the metal, but indicated a possibility that they could achieve their goal of beating deflation this year.
That sent global rates moving. The benchmark 10-year yield jumped to 2.54% today, the highest since March of last year.
Another big influence on rates is, and will be, the price of oil. As we’ve discussed, the price of oil has played a huge role in the Fed’s view toward inflation. And that influence (of oil prices) on the inflation view is shared at other major central banks.
On that note, oil broke above $63 today, the highest levels since 2014.
Remember we looked at this chart for oil back in November, which projected a move toward $80.
With oil now up 26% from November, here’s an updated look …
For help building a high potential portfolio, follow me in our Billionaire’s Portfolio, where you look over my shoulder as I follow the world’s best investors into their best stocks. Our portfolio of highest conviction, billionaire-owned stocks is up close to 50% over the past two years. And 25% of our portfolio is in commodities stocks. You can join me here and get positioned for a big 2018.
As we head into the Thanksgiving day weekend, let’s talk about oil and Saudi Arabia.
On Thanksgiving night three years ago oil was trading around $73, when the Saudis blocked a vote on an OPEC production cut. Oil dropped 10% that night, and that set off a massive oil price bust that ultimately bottomed out early last year at $26.
The goal of the Saudis was to put the emerging, competitive U.S. shale industry out of business–to force oil prices lower so that these shale companies couldn’t product profitably. The plan: They go away, and Saudi Arabia retains its power on global oil. It nearly worked. Shale companies started dropping like flies, with more than 100 bankruptcies between 2015 and 2016.
But cheap oil had broader implications for the global economy, following the Great Recession. It exposed the global banks that had lent the shale industry hundreds of billions of dollars.
Additionally, collapsing oil prices directly weighed on inflation measures and the inflation expectations. That was bad news for the central banks that had committed trillions of dollars to avert a deflationary spiral and promote a normalization of inflation. High inflation is bad. Deflation is worse. Once a deflationary mindset takes hold, it feeds into more deflation. Central banks can raise rates to kill inflation. They have few tools to fight deflation (especially after the financial crisis).
So cheap oil became bad news for the fragile global economic recovery. With that, central banks stepped in early last year and responded with coordinated easing (which included direct asset purchases, which likely included outright oil and oil-related ETFs). Oil bottomed the day the Bank of Japan intervened in the currency market, and prices jumped 50% in a month as other major central banks followed with intervention.
Now, the other piece of this story: cheap oil damaged the shale industry and the global economy, but it also damaged the same folks that set the collapse into motion–Saudi Arabia and other oil producing countries. These countries, which are heavily reliant on oil revenues, have seen their budget deficits balloon. So, with all of the above in mind, in November of last year, the oil producing countries (led by Saudi Arabia) reversed course on their plan, by promising the first production cuts since 2008.
Oil prices have now recovered to the mid-$50s. And since OPEC announced production cuts last year at this time, U.S. petroleum supply has drawn down 5%. Meanwhile, global demand is running far hotter than forecasts of last year. Yet, OPEC is extending their production cuts into this market and may get even bolder next week at their November meeting. Why? Because now it suits them. Remember, Saudi Arabia’s next king has been cleaning house over the past two weeks, in the process of seizing hundreds of billions of dollars from his political foes. Higher oil prices help his efforts to reshape the Saudi economy.
As liquidity dries up into the end of year and holidays, we may see oil find its way back up toward those November 2014 levels (low $70s)–where the whole price-bust debacle started.
Join our Billionaire’s Portfolio today to get your portfolio in line with the most influential investors in the world, and hear more of my actionable political, economic and market analysis. Click hereto learn more.
Yesterday we talked about the comeback underway in Wal-Mart and the steps it has made to challenge Amazon, and to challenge the idea that Amazon will crush everyone.
It’s beginning to look like the “decline of the retail store” may have bottomed too.
And it so happens that it may have bottomed precisely when a new ETF launched to capitalize on that story. ProShares launched it yesterday, and that is the name of it –ProShares Decline Of The Retail Store ETF. It gives you short exposure to bricks and mortar retailers.
It’s off to a bad start–down 3% in the first day of trading.
For retail, the week started with a big earnings beat for Advance Auto Parts (the stock was up as much as 20% on Tuesday). Then it was Wal-Mart. And today we had earnings beats in Foot Locker and Abercrombie and Fitch.
With this, while the Dow and S&P 500 were down on the day, the small-cap (Russell 2000) was up nicely. Here’s why …
As bad as retail has been, the energy sector remains the worst performing for the year–down 11% year-to-date as a sector and the only sector in the red. This, as oil has reversed from down 22% on the year, to up around 5%, with a very bullish outlook.
This sets up for a big year ahead for energy stocks. And if you believe the worst of the economic challenges are behind us, the survivors in retail could have quite a revival–especially if Amazon begins to see more regulatory scrutiny.
Join our Billionaire’s Portfolio today to get your portfolio in line with the most influential investors in the world, and hear more of my actionable political, economic and market analysis. Click hereto learn more.
Into the latter part of last week, we had some indiscriminate selling in some key markets. First it was Japanese stocks that followed a new 25-year high with a 1,100 point drop. Then we had some significant selling in junk bonds and U.S. Treasuries. And then four million ounces of gold was sold in about a 10 minute period on Friday.
Markets were tame today, but as I said on Friday, the potential ripples from the political shakeup and related asset freeze in Saudi Arabia is a risk that still doesn’t seem to be given enough attention. I often talk about the many fundamental reasons to believe stocks can go much higher. But experience has shown me that markets don’t go in a straight line. There are corrections along the way, and we haven’t had one in a while.
With that said, since 1946, the S&P 500 has had a 10% decline about once a year (according to American Funds research).
The largest decline this year has been only 3.4%.
I could see a scenario play out, with forced selling related to the Saudi events, that looks a lot like this correction in 2014.
This chart was fear driven – when the Ebola fears were ramping up. You can see how quickly the slide accelerated. The decline hit 10% on the nose, and quickly reversed. Fear and forced selling are great opportunities to buy-into. This decline was completely recovered in 30 trading days.
We constantly hear predictions of impending corrections, pointing to all of the clear evidence that should drive it, but corrections are often caused by events that are less pervasive in the market psyche. The Saudi story would qualify. And we’re in a market that is underpricing volatility at the moment – with the VIX sitting only a couple of points off of record lows (i.e. little to no fear). Forced liquidations can create some fear.
Join our Billionaire’s Portfolio subscription service today to get your portfolio in line with the most influential investors in the world, and hear more of my actionable political, economic and market analysis. Click here to learn more.
All eyes continue to be on U.S. stocks. But the bigger opportunities are elsewhere.
Japanese stocks were up another 1.3% today. The Nikkei is up 20% since September 8th. Oil is up 26% over just about the same period.
We’ve talked about the case for oil to continue its run. And with oil at 2 1/2 year highs and closing in on $60 a barrel, I’ve said we should expect the inflation chatter to start picking up. For those that have been looking for a catalyst to get bonds finally moving (and continuing) lower, this could be it. The Fed will find it very hard to ignore the impact of higher oil prices.
Here’s a look at that oil/ rates relationship we looked at a few weeks ago. At 2.30% on the 10 year yield, we sit 100 basis points off of the all-time lows (of last year). And coincidentally, we have 100 basis points of post-QE tightening in the market. With the strength in oil of the past two weeks, the divergence should be narrowing. But it has widened.
But we have another 25 basis points of tightening coming next month. This, along with this chart above, would argue we should be on the way up to 2.65ish in the 10-year yield (i.e. rates higher, bond prices lower).
With the oil story in mind, here’s another interesting chart: natural gas.
Natural gas is closing on this big four-year trendline. This momentum needs to continue, to close the sector performance gap in stocks (in the graphic below).
The energy sector has made up about three percentage points of ground since we looked at this chart last month.
Join our Billionaire’s Portfolio subscription service today to get your portfolio in line with the most influential investors in the world, and hear more of my actionable political, economic and market analysis. Click here to learn more.
Oil is up over 3% today, trading up to the highest levels since June of 2015.
We were already at new highs for the year as of Friday’s close, and then we get news over the weekend of the political shakeup and arrests in Saudi Arabia.
We’ve talked about the fundamental case for much higher oil prices throughout the recovery last year, and again this summer. You never know what catalyst may come in to accelerate the move in price. We may have had it with this Saudi news.
Among the reasons to expect a potential violent move in oil prices: OPEC has been cutting production into a (ex OPEC, ex U.S.) world that’s not producing (i.e. there’s negative production growth). Given the scars of last year’s oil price bust, oil producers haven’t been spending on new production.
Meanwhile, there’s U.S. supply that is supposed to fill that void, but U.S. supply has been in consistent draw down, 26 of the past 31 weeks, to the tune of 8% lower supply.
Add to this, we have a global economy that’s improving, and with that, demand is increasing. And we have U.S. fiscal stimulus entering to stoke those flames.
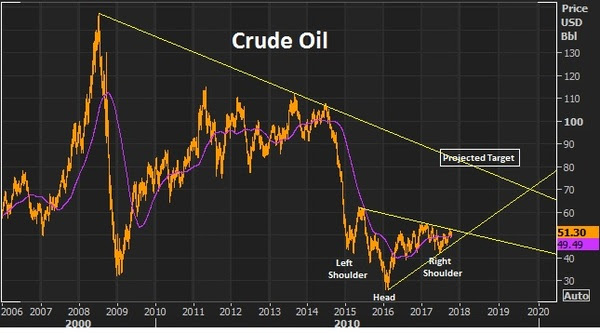
We looked at this chart last month.
Source: Billionaire’s Portfolio
We had this this inverse head and shoulders (in the chart above) that projected a move back to the low $80s. And as part of that technical picture, we were setting up for a break of a big two-year trendline that would open the doors to a move back into the $70+ oil area.
That line broke at around $51.50, confirming that head and shoulders pattern, and the move has been aggressive since. We now have this chart …
Source: Billionaire’s Portfolio
This is beginning to play out according to script for the star commodity investors we talked about this summer, Leigh Goehring and Adam Rozencwajg. They’ve been wildly bullish oil calling for $75 to $110 oil. Earlier in the summer, they said “when inventory gets this low we run the risk of triple digit oil prices.” And they suspected a supply disruption could give us a sharp move higher.
Do the events in Saudi Arabia present a potential supply disruption? Earlier this year, Stratus Advisors, an energy research and consulting shop, projected potential oil-supply disruption scenarios. Among the scenarios, was “internal instability in Saudi Arabia.”
Join our Billionaire’s Portfolio subscription service today to get your portfolio in line with the most influential investors in the world, and hear more of my actionable political, economic and market analysis. Click here to learn more.
The Fed decision today was a snoozer, as expected. The market continues to think we get a third rate hike for the year in December (fourth since the election).
Thus far, with three hikes, we’ve had just about the equivalent (just shy of 75 basis points) priced-in to the 10-year Treasury market. Yields popped from about 1.70% on election night (just about a year ago) to a high of 2.64%. We’ve had some swings since, but we sit now at roughly 2.40% (70 basis points higher over the past year).
We revisited yesterday, the prospects for some significant wage growth (and therefore inflation), with the fuel of fiscal stimulus feeding into an already tight (but underemployed) labor market.
The Treasury market isn’t pricing that scenario in, at all.
In fact, the yield curve continues to look more like a world that doesn’t fully believe fiscal stimulus is happening (or will happen), and does believe the Fed is more likely damaging the economy through its rate “normalization.”
That’s a bet that continues to underprice the prospects of fiscal stimulus. And, therefore, that’s a bet that continues to be disconnected from the message other key markets are sending. Over the past six months, we’ve talked the case for stocks to go much higher. We’ve talked about the opportunities in European and Japanese stocks (German stocks hitting new record highs and Japanese stocks nearing new 26-year highs today). We’ve talked a lot about the building bull market in commodities. We’ve talked about the positive signals that copper has been sending, as the leading indicator of a global economic turning point. We’ve talked about the outlook for much higher oil prices – oil hit $55 today. (July 30: Explosive Move Coming For Oil And Commodities Stocks).
And oil prices, whether the central banks like to admit it or not, heavily impact inflation, inflation expectations and policy making decisions.
With that, this next chart suggests that market interest rates are about to make a move (higher).
Source: Billionaire’s Portfolio
Join our Billionaire’s Portfolio subscription service today to get your portfolio in line with the most influential investors in the world, and hear more of my actionable political, economic and market analysis. Click here to learn more.
On Friday we talked about the biggest market movers: oil, copper and iron ore.
Oil was up 5.3% on the week. Copper was up 4%. And iron ore reversed sharply on Friday to jump 6%.
All were stronger again today.
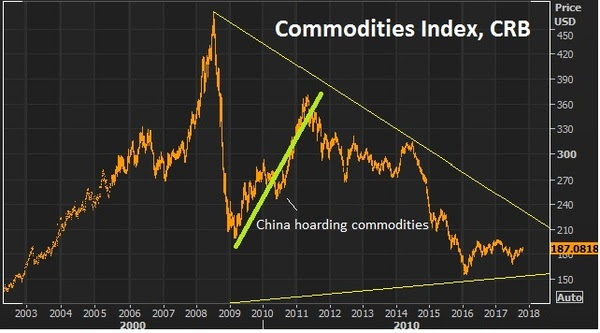
Remember, China is the world’s largest consumer of commodities. And the import data late last week out of China showed hotter imports in copper and copper products (26.5% growth, year over year), iron ore (record high imports, up 10% from a year earlier), and crude oil imports hit the second highest level on record (up 12% year over year).
This leaves us wondering: Is China’s economy doing better than most think? And/or is this China hoarding commodities again?
At the depths of the financial crisis, China opportunistically stepped in and started gobbling up global commodities on the cheap (at the time).
Remember, China has $3 trillion in currency reserves, about $2 trillion of which are in U.S. dollars. Commodities are a good way to put those dollars to work.
And there always seems to be currency play at work in China, to gain some sort of advantage. You can see in the chart below, as the PBOC has weakened the yuan, commodities prices have fallen. And as they’ve been strengthening the currency this year, we may be seeing commodities coming back as a result.
Join our Billionaire’s Portfolio today to get your portfolio in line with the most influential investors in the world, and hear more of my actionable political, economic and market analysis. Click here to learn more.
Yesterday we talked about the case for commodities and the opportunity for a rotation into commodities stocks.
The valuation of commodities relative to stocks has only been this disconnected (stocks strong, commodities weak) twice, historically over the past 100 years: at the depths of the Great Depression in the early 30s and toward the end of the Bretton Woods currency system.
That supports the case that we’re in the early days of a bull market in commodities, especially considering where we stand in the global economic recovery, underpinned by the “reflation” focus at both the monetary and fiscal policy levels. It’s a recipe for hotter demand for commodities.
With that, let’s take a look at a few charts as we close the week.
Copper
We talked about copper yesterday. This continues to ring the bell, alerting us that better economic growth is coming – maybe a boom.
Copper is up 6.5% in the past two weeks, back of $3 and closing in on the highs of the year – which is a three year high. And remember, we looked at the potential break of this big six-year downtrend back in August. That has broken, retested and confirms the trend change.
Crude Oil
We talked about the fundamental case for oil this week. And we looked at the technical case, as it made a brief test of the 200 day moving average and quickly bounced back. It’s up about 4% on the week.
We have this inverse head and shoulder (in the chart below) that projects a move back to the low $80s. And as part of that technical picture, we’re setting up for a break of a big two-year trendline that should open the doors to a move back into the $70+ oil area.
Iron Ore
Iron ore was the biggest mover of the day – up 6% today. This has been a deeply depressed market through the post-financial crisis era. In addition to the broad commodities weakness, iron ore prices have suffered from the dumping of poor quailty iron ore by Chinese producers. Those times seem to be changing.
This week there was a fraud claim on a big Japanese steel maker for fudging it’s quality data. Keep an eye on this one as it could lead to more, and could lead to a supply disruption in industrial metals.
Then today we had Chinese data that showed record imports of iron ore. This is a signal that there’s both an envirionmental movement and an anti-dumping movement against low grade iron ore that has been influencing supply and prices (and crushing producers). This big Chinese data point is also in line with the message copper is sending: perhaps the Chinese economy is doing better than most think.
With that, let’s take a look at a few charts as we close the week. The valuation of commodities relative to stocks has only been this disconnected (stocks strong, commodities weak) twice, historically over the past 100 years: at the depths of the Great Depression in the early 30s and toward the end of the Bretton Woods currency system.
Join our Billionaire’s Portfolio today to get your portfolio in line with the most influential investors in the world, and hear more of my actionable political, economic and market analysis. Click here to learn more.


 As we head into the Thanksgiving day weekend, let’s talk about oil and Saudi Arabia.
 Yesterday we talked about the comeback underway in Wal-Mart and the steps it has made to challenge Amazon, and to challenge the idea that Amazon will crush everyone.

 Into the latter part of last week, we had some indiscriminate selling in some key markets. First it was Japanese stocks that followed a new 25-year high with a 1,100 point drop. Then we had some significant selling in junk bonds and U.S. Treasuries. And then four million ounces of gold was sold in about a 10 minute period

 All eyes continue to be on U.S. stocks. But the bigger opportunities are elsewhere.