
|
May 25, 5:00 pm EST
As we head into the long holiday weekend, let’s look at some key charts.
First, just a week ago, the U.S. interest rate market was spooking investors, as 10-year yields were hanging around 3.10%. The fear was, would 3% yields quickly turn into 4% yields, and hit economic activity.
As of today, we’re trading closer to 2.90% again, back below 3%.

But you can see, we run into this big trendline that represents this ascent in rates for 2018, which also reflects the outlook of a hotter economy, thanks to tax cuts (fiscal stimulus).
Bottom line here: The concern in interest rates is speed, not trajectory. The trajectory should continue to be UP, which is a signal that the economy is improving, and finally gaining the tracking to perform at trend, if not better than trend growth. The concern about ‘speed’ should be far less than it was a week ago.
Next, here’s a look at the S&P 500.

You can see in the chart above, we’ve broken the downtrend of this correction cycle. The longer-term trend is UP. And this bull trend started, not coincidentally, at the bottom of the oil price crash in 2016, when global central banks stepped in with measures to stem the slide in confidence.
So, we’ve had a healthy 12% correction in stocks, we’ve held the 200-day moving average, we’ve maintained the longer-term trend, and we’ve broken out of the downtrend of the correction. Small cap stocks have already returned to new record highs. And we have an economy on pace to grow at 3% this year or better, with corporate earnings expected to grow at 20% for the year. So, the second half of the year should be very good for stocks.
Have a great Memorial Day weekend!
March 27, 4:00 pm EST
The sharp swings continue in stocks, with the bias toward the downside. And as we’ve discussed over the past two weeks, it’s all led by the tech giants. Remember, on Friday we looked at the most important chart in the stock market: the chart of Amazon (as a proxy on the tech giants). Early this afternoon, Amazon was outpacing the S&P 500 to the downside by 4-to-1, and finally the broader market cracked to follow it.
This all continues to look like the market is beginning to price in a world where the tech giants, that have taken dangerously significant market share over the past decade, are on the path of tighter regulation and a leveling of the playing field, which will result in higher costs of doing business. That will change their position of strength and open the door to a resurrection of the competition.
Remember, on the stock slide of this past Friday, the S&P 500 hit the 200-day moving average and bounced sharply. It now looks like we’ll get another test of it, probably a break, and maybe take another peak at the February lows.
Here’s a look at the chart ….

You can see in the chart above the technical significance of these levels. This represents the trend from the oil price induced lows of 2016. And the slope of this trend incorporates the optimism from the Trump election and the outlook on pro-growth policies.
With that significance at play, a breach of this support, at least for a short time, would all play into the scenario that we’ll see more swings in stocks (pain for the bulls) until we get to earnings season, which kicks into gear on April 13. And as we discussed, that should begin the data-driven catalyst for stocks (earnings and growth, fueled by fiscal stimulus).
For help building a high potential portfolio, follow me in our Billionaire’s Portfolio subscription service, where you look over my shoulder as I follow the world’s best investors into their best stocks. Our portfolio of highest conviction, billionaire-owned stocks is up close to 50% over the past two years. You can join me here for the best stocks to buy in this market correction.
October 23, 2017, 4:00 pm EST
 Forbes has just ranked the top 400 richest people in America for 2017.
Among the top 50, a fifth have created their wealth from some sort of Wall Street activity (mostly hedge funds, but also brokerage and asset management). There’s not much new there–the rich have gotten richer on Wall Street despite the challenges of the past decade. But as we’ve discussed, the torch was, in many respects, passed to Silicon Valley over the past decade, as the best spot to create–that’s where the biggest proportion of the wealthiest 50 have built their wealth.
But much of that technology wealth can be refined down to the very industries that are being displaced on the wealth list, such as publishing, energy and retail.
That makes you wonder how long some of these companies can command a software-like valuation when the core of their business models are rather traditional things like selling ads, distributing content, making cars or selling retail products.
To this point, as long as they started in Silicon Valley, they tend to get a very long leash. They can lose money with immunity.
Consider this: GM is valued at $66 billion. Telsa is valued at $57 billion. GM has made (net profit) $43 billion over the past six years. Tesla has lost$2.5 billion over the past six years. Meanwhile, Elon Musk, Tesla’s founder, has amassed a $20 billion net worth.
The question is how defensible are these businesses (Facebook, Netflix, Tesla, Twitter)? How wide is their moat? A couple of years ago, the answer was probably very wide–very defensible given the adoption, the scale, and the deep pocket investors that were willing to continue plowing money into them. But, as we’ve discussed, if the regulatory environment becomes less favorable and the money dries up (in the case of private companies, like Uber), the operating advantages can begin to evaporate. This bubble-up of regulatory scrutiny on tech is something to keep a close eye on. It may become one of the big themes in the coming year.
Bryan Rich
June 9, 2017, 3:45 pm EST Invest Alongside Billionaires For $297/Qtr
The Nasdaq trade unwound some today. From the peak this morning in the futures of 5898 the tumble started around 11am, falling to as low as 5660. That’s 238 Nasdaq futures points or 4% – quite a sharp move.
Remember, it seems like an overdone trade (driven by the big tech stocks). But as we discussed last week, the tech heavy Nasdaq has simply been a catch up trade — something that has lagged the strength in the broader market.
Here’s the chart we looked at last week.
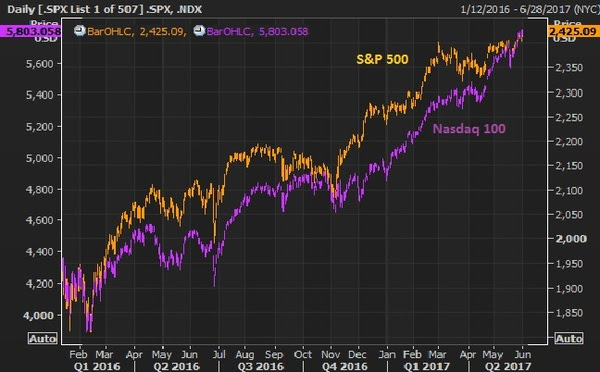
This chart goes back to the lows driven by the oil price crash that bottomed out earlier last year.
Still, with the Nasdaq at +18% ytd and S&P 500 +9% ytd, as of this morning, as we’ve seen many times in this post-crisis era, the air pockets of illiquidity in stocks can give back gains very, very quickly. As they say, stocks go up on an escalator and down in an elevator.
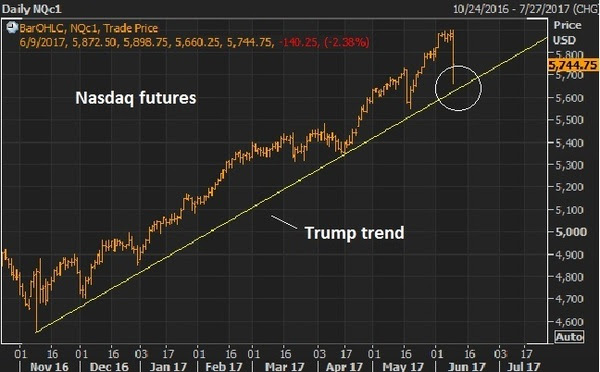
The Trump trend, in the chart above, was nearly tested today — the same day a new all-time high was marked!
If we get another few days of sharp downside, it will be a tremendous buying opportunity – get your shopping list ready. And if that downside slide does indeed come, it could come at a very interesting time. It would add another (but very signficant) reason the Fed may balk on a rate hike next week. The other reasons? We discussed them yesterday (here).
Have a great weekend.
What stocks should be on your shopping list, to buy on a big market dip? Join my Billionaire’s Portfolio to find out. It’s risk-free. If for any reason you find it doesn’t suit you, just email me within 30-days.
May 25, 2017, 4:00pm EST Invest Alongside Billionaires For $297/Qtr
We talked yesterday about run up in bitcoin. The price of bitcoin jumped another 14% today before falling back.
As I said yesterday, it looks like Chinese money is finding it’s way out of China (despite the capital controls) and finding a home in bitcoin (among other global assets). If you own it, be careful. The last time the price of bitcoin ran wild, was 2013. It took about 11 days to triple, and about 18 days to give it all back. This time around, it’s taken two months to triple (as of today).
If you’re looking for a warning signal on why it might not be sustainable (this bitcoin move), just look at the behavior across global markets. It’s not exactly an environment that would inspire confidence.
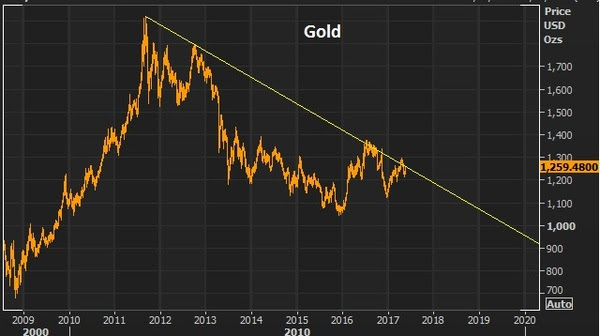
Gold is flat. Interest rates are soft. Stocks are constantly climbing. Commodities are quiet, except for oil — which fell back below $50 today on news that OPEC did indeed agree to extend its production cuts out to March of next year (bullish, though oil went south).
When the story is confusing, conviction levels go down, and cash levels go up (i.e. people de-risk). And maybe for good reason.
In looking at the bitcoin chart today, I thought back to the run up in Chinese stocks in early 2015. Here’s a look at the two charts side by side, possibly influenced by a lot of the same money.

The crash in Chinese stocks took global markets with it. It’s often hard to predict that catalyst that might prick a bubble and even harder to see the links that might lead to broader market instability. In this case, though, there are plenty of signs across markets that things are a little weird.
Invitation to my daily readers: Join my premium service members atBillionaire’s Portfolio to hear more of my big picture analysis and get my hand-selected, diverse stock portfolio where I follow the lead of the best activist investors in the world. Our goal is to do multiples of what broader stocks do. Our portfolio was up 27% in 2016. Join me today, risk-free. If for any reason you find it doesn’t suit you, just email me within 30-days.
May 18, 2017, 6:00pm EST Invest Alongside Billionaires For $297/Qtr
 Yesterday, following the slide in stocks, we looked at some charts on stocks, gold and the dollar. We talked about the media and Wall Street’s need to fit price action to a story. And we asked if the story did indeed warrant fitting it to the price action. Was a crisis beginning or just a correction for stocks?The answer: It still looks like a market that values fiscal stimulus and structural change over political mudslinging and scandal. For stocks, the news may have been the catalyst to start a healthy technical correction. Yesterday, following the slide in stocks, we looked at some charts on stocks, gold and the dollar. We talked about the media and Wall Street’s need to fit price action to a story. And we asked if the story did indeed warrant fitting it to the price action. Was a crisis beginning or just a correction for stocks?The answer: It still looks like a market that values fiscal stimulus and structural change over political mudslinging and scandal. For stocks, the news may have been the catalyst to start a healthy technical correction.
Today, the market behavior appears to support that view. Now, with the idea that a technical correction is (I think) underway for stocks, and maybe for months, until we get a better handle on policy action, remember this: a correction in stocks is a buying opportunity. Major asset classes, over time, will rise (stocks, bonds, real estate). The value of these core assets will grow faster than the value of cash. That comes with one simple assumption. The world, over time, will improve, will grow and will be a better and more efficient place to live than it was before. If that assumption turned out to be wrong, we have a lot more to worry about than the value of our stock portfolio. With that said, as an average investor that is not leveraged, dips in stocks, particularly U.S. stocks—the largest economy in the world, with the deepest financial markets—should be bought, because in the simplest terms, over time, the broad stock market has an upward sloping trajectory. Instead, dips in stocks tend to create fear, and fear creates selling, at precisely the time we should be buying. With this in mind, we’ve had a brief dip of about 4% in stocks within the “Trump trend” (the post–election rise in stocks). A typical correction is around 10%. But strong bull markets tend to have shallow retracements. A 6%–10% correction in stocks would take us back to the 200–day moving average (minimum), and maybe as low as 2,200 in the S&P 500. Invitation to my daily readers: Join my premium service members at Billionaire’s Portfolio to hear more of my big picture analysis and get my hand-selected, diverse portfolio of the most high potential stocks.
|
May 17, 2017, 4:00pm EST Invest Alongside Billionaires For $297/Qtr
 Yesterday we talked about the disconnect between the daily drama from the media in Washington (doom and gloom), and what the markets have been communicating (an economic expansion is underway). Today, you might think that connection is happening — the doom and gloom scenario is finally being realized in markets. Probably not.
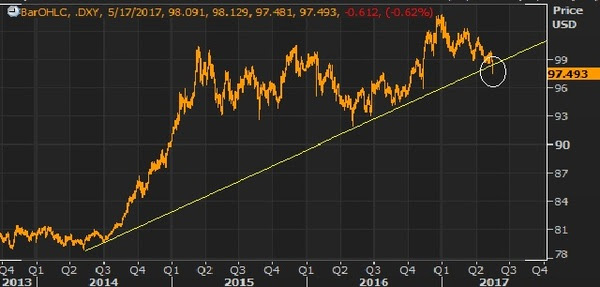
For perspective: As of the close yesterday, the Nasdaq was up 18% year to date (just five months in). Gold was in the middle of a three year range. Market interest rates (the U.S. 10-year government bond yield) was just above the middle of the range of the past four years. The dollar was not far off its strongest levels in 15 years.
Today the media has explicitly printed the headline of impeachment for Trump (actually, they’ve run those headlines a various times over the past several months). Nonetheless, stocks (the S&P 500) today are off by 1.6%.
This gets the bears very excited. I saw the story about consumer debt, surpassing 2008 levels, floating all over the internet today. People tried to make the bubble connection — implying another debt crisis was coming.
The real story: Total household indebtedness finally surpassed the previous peak from 2008. That’s precisely what the Fed was attempting to do with zero interest rates. Make existing debt cheaper to manage, and at some point, break the psychology of the debt burden and get people borrowing (at ultra-cheap rates), investing and spending again. Otherwise, our economy and the world economy would have gone into a deflationary spiral.
That said, as I’ve found in my 20 years in this business, people tend to find a story to fit the price. The story hadn’t been fitting the price for much of the past six months. Today, it seems pretty easy. See the chart below of stocks ….
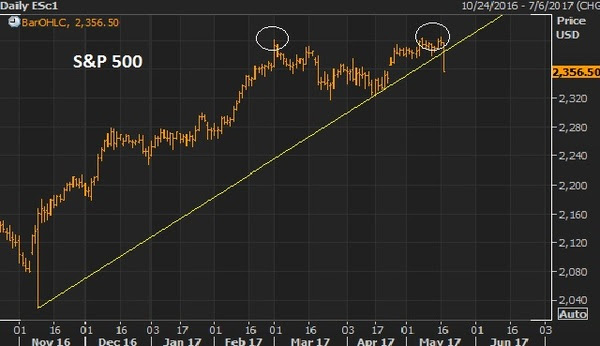
What about the Trump/Comey saga? Aren’t people dumping dollars because of that? Not likely. If that were potentially destabilizing to the U.S., it would be destabilizing to the global economy, and people would buy dollars not sell them.
Follow This Billionaire To A 172% Winner
In our Billionaire’s Portfolio, we have a stock in our portfolio that is controlled by one of the top billion dollar activist hedge funds on the planet. The hedge fund manager has a board seat and has publicly stated that this stock is worth 172% higher than where it trades today. And this is an S&P 500 stock!
Even better, the company has been constantly rumored to be a takeover candidate. We think an acquisition could happen soon as the billionaire investor who runs this activist hedge fund has purchased almost $157 million worth of this stock over the past year at levels just above where the stock is trading now.
So we have a billionaire hedge fund manager, who is on the board of a company that has been rumored to be a takeover candidate, who has adding aggressively over the past year, on a dip.
Join us today and get our full recommendation on this stock, and get your portfolio in line with our BILLIONAIRE’S PORTFOLIO.