James Bullard, the President of the St. Louis Fed, said today that even if unemployment went to 3% it would have little impact on the current low inflationevironment. That’s quite a statement. And with that, he argued no need to do anything with rates at this stage.And he said the low growth environment seems to be well intact too — even though we well exceeded the target the Fed put on employment years ago. In the Bernanke Fed, they slapped a target on unemployment at 6.5% back in 2012, which, if reached, they said they would start removing accomodation, including raising rates. The assumption was that the recovery in jobs to that point would stoke inflation to the point it would warrant normalization policy. Yet, here we are in the mid 4%s on unemployment and the Fed’s favored inflation guage has not only fallen short of their 2% target, its trending the other way (lower).
As I’ve said before, what gets little attention in this “lack of inflation” confoundment, is the impact of the internet. With the internet has come transparency, low barriers-to-entry into businesses (and therefore increased competition), and reduced overhead. And with that, I’ve always thought the Internet to be massively deflationary. When you can stand in a store and make a salesman compete on best price anywhere in the country–if not world–prices go down.
And this Internet 2.0 phase has been all about attacking industries that have been built upon overcharging and underdelivering to consumers. The power is shifting to the consumer and it’s resulting in cheaper stuff and cheaper services. And we’re just in the early stages of the proliferation of consumer to consumer (C2C) business — where neighbors are selling products and services to other neighbors, swapping or just giving things away. It all extracts demand from the mainstream business and forces them to compete on price and improve service. So we get lower inflation. But maybe the most misunderstood piece is how it all impacts GDP. Is it all being accounted for, or is it possible that we’re in a world with better growth than the numbers would suggest, yet accompanied by very low inflation?
Join our Billionaire’s Portfolio and get my most recent recommendation – a stock that can double on a resolution on healthcare. Click here to learn more.
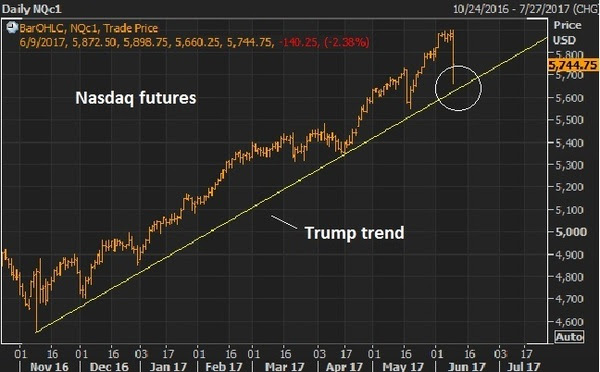
The Nasdaq trade unwound some today. From the peak this morning in the futures of 5898 the tumble started around 11am, falling to as low as 5660. That’s 238 Nasdaq futures points or 4% – quite a sharp move.
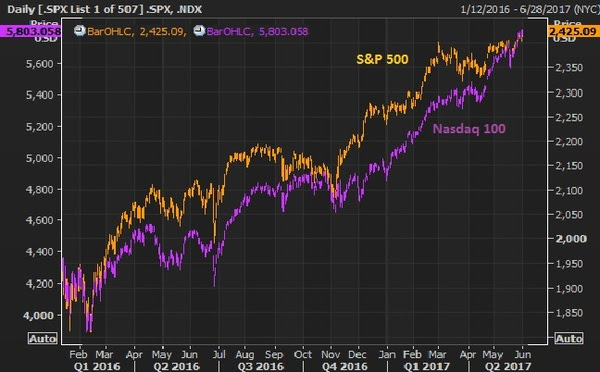
Remember, it seems like an overdone trade (driven by the big tech stocks). But as we discussed last week, the tech heavy Nasdaq has simply been a catch up trade — something that has lagged the strength in the broader market.
Here’s the chart we looked at last week.
This chart goes back to the lows driven by the oil price crash that bottomed out earlier last year.
Still, with the Nasdaq at +18% ytd and S&P 500 +9% ytd, as of this morning, as we’ve seen many times in this post-crisis era, the air pockets of illiquidity in stocks can give back gains very, very quickly. As they say, stocks go up on an escalator and down in an elevator.
The Trump trend, in the chart above, was nearly tested today — the same day a new all-time high was marked!
If we get another few days of sharp downside, it will be a tremendous buying opportunity – get your shopping list ready. And if that downside slide does indeed come, it could come at a very interesting time. It would add another (but very signficant) reason the Fed may balk on a rate hike next week. The other reasons? We discussed them yesterday (here).
Have a great weekend.
What stocks should be on your shopping list, to buy on a big market dip? Join my Billionaire’s Portfolio to find out. It’s risk-free. If for any reason you find it doesn’t suit you, just email me within 30-days.
The past few days we’ve looked at the run up in bitcoin. Remember, I said: “If you own it, be careful. The last time the price of bitcoin ran wild, was 2013. It took about 11 days to triple, and about 18 days to give it all back. This time around, it’s taken two months to triple (as of today). ”
It looks to be fueled by speculation, and likely Chinese money finding its way out of China (beating capital controls). And yesterday we talked about the potential disruption to global markets that could come with a crash in bitcoin prices.
I suspect that’s why gold is finally beginning to move today, up almost 1%, and among the biggest movers of the day as we head into the long holiday weekend (an indication of some money moving to gold to hedge some shock risk).
Remember yesterday we looked at the chart on Chinese stocks back in 2015 and compared it to bitcoin. The speculative stock market frenzy back thin was pricked when the PBOC devalued the yuan later in the summer.
Probably no coincidence that bitcoin’s recent acceleration happened as Moody’s downgraded China’s credit rating this week for the first time since 1989 (an event to take note of). Yesterday, the PBOC was thought to be in buying Chinese stocks (another event to take note of). And this morning, the PBOC stepped in with another currency move! Historically, major turning points in markets tend to come with some form of intervention. Will a currency move be the catalyst to end the bitcoin run, as it did the runup in Chinese stocks two years ago?
Let’s take a look at what the currency move overnight means …
Keep in mind, the currency is China’s go-to tool for fixing problems. And they have problems. The economy is crawling around recession like territory. The debt was just downgraded. And they’ve had a tough time managing capital flight. As an easy indicator: Global stocks are soaring. Chinese stocks are dead (flat on the year).
Remember, their rapid economic ascent in the world came through exports (via a weak currency). The move overnight is a move back toward tying its currency more closely to the dollar. Which, if this next chart plays out, will also weaken the yuan compared to other big exporting competitors in the world.
That should help the Chinese economic outlook, which may help stem the capital flight (which has likely been a significant contributor to bitcoin’s rise).
We talked yesterday about run up in bitcoin. The price of bitcoin jumped another 14% today before falling back.
As I said yesterday, it looks like Chinese money is finding it’s way out of China (despite the capital controls) and finding a home in bitcoin (among other global assets). If you own it, be careful. The last time the price of bitcoin ran wild, was 2013. It took about 11 days to triple, and about 18 days to give it all back. This time around, it’s taken two months to triple (as of today).
If you’re looking for a warning signal on why it might not be sustainable (this bitcoin move), just look at the behavior across global markets. It’s not exactly an environment that would inspire confidence.
Gold is flat. Interest rates are soft. Stocks are constantly climbing. Commodities are quiet, except for oil — which fell back below $50 today on news that OPEC did indeed agree to extend its production cuts out to March of next year (bullish, though oil went south).
When the story is confusing, conviction levels go down, and cash levels go up (i.e. people de-risk). And maybe for good reason.
In looking at the bitcoin chart today, I thought back to the run up in Chinese stocks in early 2015. Here’s a look at the two charts side by side, possibly influenced by a lot of the same money.
The crash in Chinese stocks took global markets with it. It’s often hard to predict that catalyst that might prick a bubble and even harder to see the links that might lead to broader market instability. In this case, though, there are plenty of signs across markets that things are a little weird.
Invitation to my daily readers: Join my premium service members atBillionaire’s Portfolio to hear more of my big picture analysis and get my hand-selected, diverse stock portfolio where I follow the lead of the best activist investors in the world. Our goal is to do multiples of what broader stocks do. Our portfolio was up 27% in 2016. Join me today, risk-free. If for any reason you find it doesn’t suit you, just email me within 30-days.
Stocks continue to bounce back today. But the technical breakdown of the Trump Trend on Wednesday
still looks intact. As I said on Wednesday, this looks like a technical correction in stocks (even considering today’s bounce), not a fundamental crisis-driven sell-off.
With that in mind, let’s take a look at the charts on key markets as we head into the weekend.
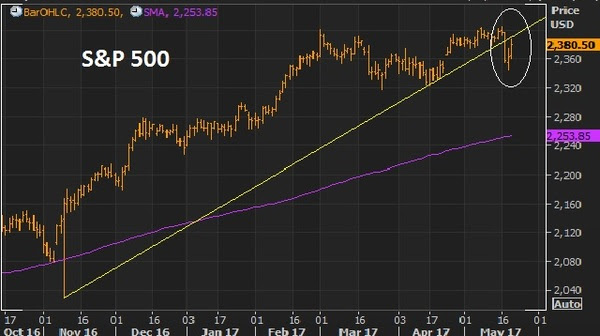
Here’s a look at the S&P 500 chart….
For technicians, this is a classic “break-comeback” … where the previous trendline support becomes resistance. That means today’s highs were a great spot to sell against, as it bumped up against this trendline.
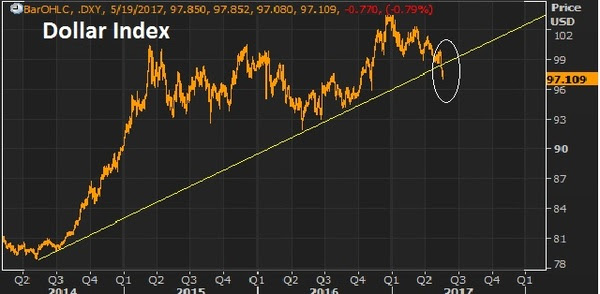
Very much like the chart above, the dollar had a big trend break on Wednesday, and then aggressively reversed Thursday, only to follow through on the trend break to end the week, closing on the lows.
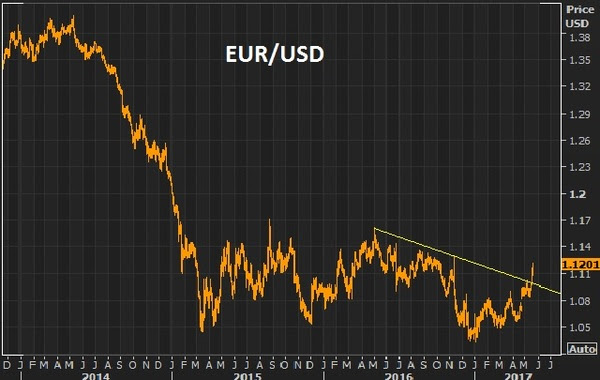
On that note, the biggest contributor to the weakness in the dollar index, is the strength in the euro (next chart).
The euro had everything including the kitchen sink thrown at it and it still could muster a run toward parity. If it can’t go lower with an onslaught of events that kept threatening the existence of the euro, then any sign of that clearing, it will go higher. With the French elections past, and optimism that U.S. growth initiatives will spur global growth (namely recovery in Europe), then the European Central Bank’s next move will likely be toward exit of QE and extraordinary monetary policies, not going deeper. With that, the euro looks like it can go much higher. That means a lower dollar. And it means, European stocks look like, maybe, the best buy in global stocks.
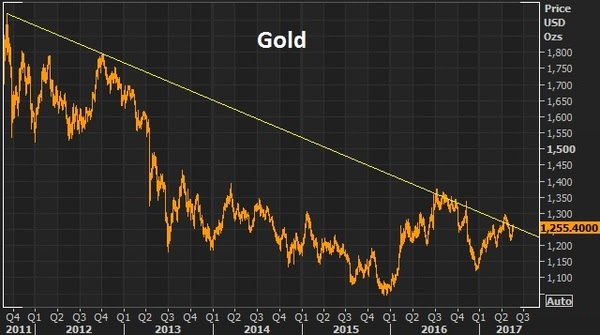
A lower dollar should be good for gold. As I’ve said, if Trump policies come to fruition, inflation could get a pop. And that’s bullish for gold. If Trump policies don’t come to fruition, the U.S. and global growth looks grim, as does the post-financial crisis recovery in general. That’s bullish for gold.
This big trendline in gold continues to look like a break is coming and higher gold prices are coming.
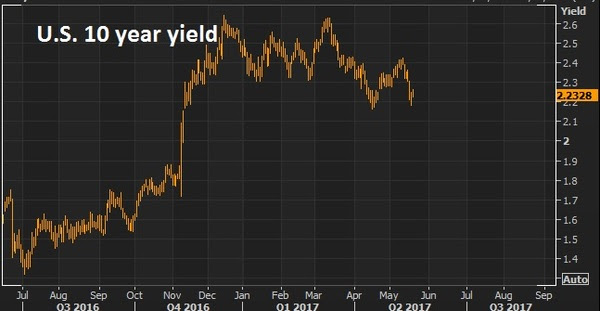
With all of the above, the most important chart of the week is probably this one …
The 10 year yield has come all the way back to 2.20%. The best reason to wish for a technical correction in stocks, is not to buy the dip (which is a good one), but so that the pressure comes out of the interest rate market (and off of the Fed). The run in the stock market has clearly had an effect on Fed policy. And the Fed has been walking rates up to a point that could choke off the existing economic recovery momentum and, worse, neutralize the impact of any fiscal stimulus to come. Stable, low rates are key to get the full punch out of pro-growth policies, given the 10 year economic malaise we’re coming out of.Invitation to my daily readers: Join my premium service members at Billionaire’s Portfolio to hear more of my big picture analysis and get my hand-selected, diverse portfolio of the most high potential stocks.
Yesterday, following the slide in stocks, we looked at some charts on stocks, gold and the dollar. We talked about the media and Wall Street’s need to fit price action to a story. And we asked if the story did indeed warrant fitting it to the price action. Was a crisis beginning or just a correction for stocks?The answer: It still looks like a market that values fiscal stimulus and structural change over political mudslinging and scandal. For stocks, the news may have been the catalyst to start a healthy technical correction.
Today, the market behavior appears to support that view.
Now, with the idea that a technical correction is (I think) underway for stocks, and maybe for months, until we get a better handle on policy action, remember this: a correction in stocks is a buying opportunity.
Major asset classes, over time, will rise (stocks, bonds, real estate). The value of these core assets will grow faster than the value of cash.
That comes with one simple assumption. The world, over time, will improve, will grow and will be a better and more efficient place to live than it was before. If that assumption turned out to be wrong, we have a lot more to worry about than the value of our stock portfolio.
With that said, as an average investor that is not leveraged, dips in stocks, particularly U.S. stocks—the largest economy in the world, with the deepest financial markets—should be bought, because in the simplest terms, over time, the broad stock market has an upward sloping trajectory. Instead, dips in stocks tend to create fear, and fear creates selling, at precisely the time we should be buying.
With this in mind, we’ve had a brief dip of about 4% in stocks within the “Trump trend” (the post–election rise in stocks). A typical correction is around 10%. But strong bull markets tend to have shallow retracements. A 6%–10% correction in stocks would take us back to the 200–day moving average (minimum), and maybe as low as 2,200 in the S&P 500.
Invitation to my daily readers: Join my premium service members at Billionaire’s Portfolio to hear more of my big picture analysis and get my hand-selected, diverse portfolio of the most high potential stocks.
The noise surrounding the Trump administration continues by the day, as the media tries desperately to prosecute the elected President at daily briefings.The chaos and dysfunction message is loud, but markets aren’t hearing it. The real story is very different. Stocks continue to surge. Stock market volatility continues to sit 10-year (pre-crisis) lows. The interest rate market is much higher than it was before the election, but now quiet and stable. Gold, the fear-of-the-unknown trade, is relatively quiet. This all looks very much like a world that believes a real economic expansion is underway, and that a long-term sustainable global economic recovery has supplanted the shaky post-crisis (central bank-driven) recovery that was teetering back toward recession.
Why is the messaging so different? Remember, the financial media and Wall Street are easily distractible. Not only do they have short attention spans, but they’ve been trained throughout their careers to find new stories to obsess about. They need to interpret, pontificate, strategize to feel valued. Approaching their jobs with the idea that a slow moving dominant theme is at work is just too boring.
This is the disconnect between markets and the narrative. We have major central banks around the world that continue to print money. These central banks buy assets with that freshly printed money. That means, stocks, bonds, commodities go higher. And now we have everyone’s fate (the global economy) tied to the outcome of new policies from the leading economy in the world – efforts to restore sustainable growth through structural reform and fiscal stimulus. That hopeful outlook does nothing but underpin the rise in asset prices (stocks, bonds, commodities, real estate).
Yesterday we got a look under the hood of the portfolios of the biggest money managers in the world, via their 13F filings (required quarterly portfolio disclosures to the SEC). It’s been clear that the biggest and best, embrace this big theme, and have been aggressively positioning to take advantage of the very bullish proposed policy tailwinds for stocks, which are: 1) a corporate tax rate cut, which will go right to the bottom line for profitable companies. Not surprisingly, which stocks have been leading the way in the climb in the indicies? The one’s that make a lot of money (Apple, Microsoft, Google). 2) a repatriation tax holiday that will bring back trillions of dollars onshore, to be paid back to shareholders and put to work in the economy through investment and projects. 3) a trillion dollar infrastructure spend that, regardless of how difficult it may be to legislate, should happen in one form or another.
Among the reports on portfolio holdings yesterday, we heard from the Swiss National Bank. As I said above, don’t forget there are still central banks deeply entrenched in QE and, beyond local government bonds, are buying foreign assets (in large amounts). Switzerland’s central bank has more freshly printed money to put to work every quarter, and has been increasing their allocation to equities dramatically – $80 billion of which is now (as of the end of Q1) in U.S. stocks! That’s a 29% bigger stake than they had at the end of 2016. The SNB is the world’s eighth biggest public investor.
So keep this big theme in mind: Central banks remain involved, but the baton has been passed, from a central bank-driven recovery to a fiscal stimulus-driven recovery. And everyone needs it to work.
Follow This Billionaire To A 172% Winner
In our Billionaire’s Portfolio, we have a stock in our portfolio that is controlled by one of the top billion dollar activist hedge funds on the planet. The hedge fund manager has a board seat and has publicly stated that this stock is worth 172% higher than where it trades today. And this is an S&P 500 stock!
Even better, the company has been constantly rumored to be a takeover candidate. We think an acquisition could happen soon as the billionaire investor who runs this activist hedge fund has purchased almost $157 million worth of this stock over the past year at levels just above where the stock is trading now.
So we have a billionaire hedge fund manager, who is on the board of a company that has been rumored to be a takeover candidate, who has adding aggressively over the past year, on a dip.
Over the past week, I’ve talked about the potential for disruption in what has been very smooth sailing for financial markets (led by stocks). While the picture has grown increasingly murkier, markets had been pricing in the exact opposite – which makes things even more vulnerable to a shakeout of the weak hands.
With that, it looked like we are indeed working on a correction in stocks. But it’s not just because stocks are down. It’s because we have some very important technical developments across key markets. The Trump trend has been broken.
Let’s take a look at the charts …
The above chart is the S&P 500. We looked at a break in the futures market last week. Today we get a big break in the cash market. This trendline represents the nice 45 degree climb in stocks since election night on November 8th. We have a clean break today.
Stocks ran up on the prospects that Trumponomics can end the decade long malaise in, not just the U.S. economy, but the global economy too. With that, the money that has been parked in U.S. Treasuries begins to leave. Moreover, any speculators that were betting the U.S. would follow the world into negative rate territory run for the exit doors. That sends Treasury bond prices lower and yields higher (as you can see in the chart above). So today, we also get a break of this “Trump trend” in rates as well (the yellow line). Remember, this is after the Fed’s rate hike last week — rates are moving lower, not higher.
Next up, gold …
I talked about gold yesterday — as being the clearest trade (higher) in an increasingly murkier picture for global financial markets. You can see in the chart above, gold is now knocking on the door of a break in this post-election Trump trend.
Remember, we’ve talked about the buy-the-rumor sell-the-fact phenomenon in markets. The beginning of the Trump trend in stocks started on election night (buying “the rumor” in anticipation of pro-growth policies). The top in stocks came the day following the President’s speech to the joint sessions of Congress (selling “the fact”, entering the “show me” phase).
In our Billionaire’s Portfolio, we’re positioned in a portfolio of deep value stocks that all have the potential to do multiples of what broader stocks do — all stocks owned and influenced by the world’s smartest and most powerful billionaire investors. Join us today and we’ll send you our recent addition to the portfolio – a stock that one of the best activist investors in the world thinks will double.
Stocks are hitting new record highs today. That includes the Dow, the S&P 500 and the Nasdaq.
We’ve now seen about 60% of the earnings for Q4, and earnings are very good. As we’ve discussed, earnings guidance and consensus views are made to be beaten. Factset says that, on average, about 67% of S&P 500 companies beat the consensus view on earnings. For Q4, that number, as of last Friday, was 65%.
More importantly, the earnings growth rate for Q4 is +4.6% thus far. That’s better than the 3.1% that was predicted, coming into the earnings season. And that’s the first two consecutive quarters of year-over-year positive EPS growth in a couple of years.
So we have positive earnings surprises driving stocks higher. And finally, revenue growth is coming. After six consecutive quarters of revenue contraction, earnings for U.S. companies had a second consecutive quarter of growth. And the quarters ahead should be much better.
Clearly, in the weak growth environment, the focus has clearly been cutting costs, refinancing debt, selling non-core assets, and buying back shares. That’s all a recipe for juicing EPS, even though revenue growth is sluggish, if existent.
So for all of the people that are constantly hand wringing about the levels of the stock market, ask them this: What happens when you take these companies that are growing earnings by optimizing margins in a 1% growth world, and you give them 3%-4% economic growth? Earnings go up. What happens when you take a profitable company and cut the tax burden by 15 to 20 percentage points? Earnings go up.
When earnings go up, price to earnings goes down. And valuations can become very, very cheap.
We have companies that have been forced to streamline to survive. And now we’re in the early days of a regime shift, where tax cuts will work for them, deregulation will work for them, and a big infrastructure spend will pop demand, to actually fuel some revenue growth.
Below is a nice chart from Yardeni. You can see the flattish revenue growth, but earnings divergence over the past five years.
On the right hand axis, next year’s earnings on the S&P 500 are expected around $133. That doesn’t take into account the impact of a corporate tax cut, which Standard & Poors research has suggested could bump that number up to the mid $150s ($1.31 added for every 1% cut in the corporate tax rate). That would dramatically widen the revenue, earnings divergence — or make the closing of this gap that much more aggressive.
For help building a high potential portfolio for 2017, follow me in our Billionaire’s Portfolio, where you look over my shoulder as I follow the world’s best investors into their best stocks. Our portfolio more than doubled the return of the S&P 500 in 2016. You can join me here and get positioned for a big 2017.
We ended last week with a very strong jobs report, yet the measure of wage pressure was soft. That, for the near term, reduces expectations on how aggressive the Fed might be (but not a lot).
Still, the 10-year yield has drifted lower to start the week. It was 2.50% Friday afternoon. Today it’s closer to 2.40%. When the 10-year yield drifts lower, mortgage rates drift a little lower, back very close to 4% today. This all helps two of the most important tools the Fed has been focused on for the past eight years to drive economic recovery: stocks and housing.
The Trump administration, like the Fed, will need both stocks and housing to continue higher to maintain confidence in the economy, and in the agenda.
Now, on Friday I said Trump was hosting Japan’s Prime Minister Abe in Florida over the weekend for a round of golf at Mar-a-Lago. It looks like it’s this coming weekend, instead.
Interestingly, this comes as the Trump administration made a conscious effort on Friday to refocus the messaging from a protectionist narrative to an economic growth narrative.
Abe will be entering this meeting with President Trump under some peripheral scrutiny about trade imbalances. Japan runs about a $60 billion surplus with the United States. That’s about on par with Mexico, which has become a target for Trump in recent weeks. Still, as I said last week, it’s peanuts compared to China, and that’s where the Trump administration’s real attention lies.
Nonetheless, Abe is expected to come in with a plan to balance trade with the U.S., which includes working together on a big U.S. infrastructure program. And there is still considerable sensitivity surrounding the value of the yen (the Japanese currency).
As we know, under Abenomics, the yen has devalued by about 40% against the dollar. But as China has done often over the past decade, as they have headed into big meetings with global leaders, Japan seems to be walking its currency up in the days heading into the Abe/Trump meeting.
You can see in the chart above, the dollar has been in decline against the yen this year (the orange line falling represents a weaker dollar, stronger yen). The top in the USD/JPY exchange rate this year came when Trump’s chief trade negotiator was named on January 3rd. Robert Lighthizer worked in the Reagan administration and happened to be behind stiff tariffs imposed on Japan during that era on electronics.
Trump’s tough talk on trade, and the market’s continued focus on upcoming elections in Europe (that threaten to continue the trend of nationalism and protectionism) have stocks in Japan and Europe diverging from the strength we’re seeing in U.S. stocks. The Dow is above 20k. Meanwhile, Japanese stocks are still 10% off of the 2015 highs. German stocks are 7% off of 2015 highs.
But as I’ve said, growth solves a lot of problems. In addition to the underlying current of a better performing U.S. economy (with the pro-growth agenda in the pipeline), the data is already improving in both Germany and Japan. I suspect that Europe and Japan will soon be cleared from the fray of the trade protectionist rhetoric, and we’ll start seeing major European stock markets and the Japanese stock market climbing, and ultimately putting up a big number in 2017.
For help building a high potential portfolio for 2017, follow me in our Billionaire’s Portfolio, where you look over my shoulder as I follow the world’s best investors into their best stocks. Our portfolio more than doubled the return of the S&P 500 in 2016. You can join me here and get positioned for a big 2017.


 Yesterday, following the slide in stocks, we looked at some charts on stocks, gold and the dollar. We talked about the media and Wall Street’s need to fit price action to a story. And we asked if the story did indeed warrant fitting it to the price action. Was a crisis beginning or just a correction for stocks?The answer: It still looks like a market that values fiscal stimulus and structural change over political mudslinging and scandal. For stocks, the news may have been the catalyst to start a healthy technical correction.
 The noise surrounding the Trump administration continues by the day, as the media tries desperately to prosecute the elected President at daily briefings.The chaos and dysfunction message is loud, but markets aren’t hearing it. The real story is very different. Stocks continue to surge. Stock market volatility continues to sit 10-year (pre-crisis) lows. The interest rate market is much higher than it was before the election, but now quiet and stable. Gold, the fear-of-the-unknown trade, is relatively quiet. This all looks very much like a world that believes a real economic expansion is underway, and that a long-term sustainable global economic recovery has supplanted the shaky post-crisis (central bank-driven) recovery that was teetering back toward recession.


