January 4, 2023
On this day a year ago the stock market posted the all-time high.
If you recall, coming into 2022, the Fed, staring down the barrel of 7% inflation, told us that they would tame inflation, and land close to their target of 2% by the end of 2022. And, they told us that they would do so while producing a 4% growth economy (well above trend) at 3.5% unemployment (near record levels) — all while keeping the Fed Funds rate under 1%.
What did they do? They took rates above 4%, crushed growth (induced a technical recession) and didn’t get near their inflation target.
As I said in my Pro Perspectives note last year this time, a new year can often come with regime change in markets.
We had the extreme of regime change.
Not only did we go from an easing to a tightening cycle, for global monetary policy. But we went from a long-era of low inflation, and ultra-easy money, to a high inflation, and inflation fighting policy.
We went from a fed that was a fervent defender of financial market stability, and promoter of economic prosperity, to a Fed that explicitly attacked jobs and demand, and went to great lengths to talk down the stock market (in effort to tighten financial conditions).
With that about face, for anyone looking to earn investment returns, much less preserve buying power against inflation, there were few places to hide. Not only did stocks do poorly, but bonds did worse — an outcome with few historical reference points in down stock markets and higher uncertainty environments.
The good news: The rate-of-change in monetary policy tightening will slow dramatically this year (and could possibly be a zero rate-of-change, which would be a positive surprise for markets). The rate-of-change in the fiscal policy madness will be zero, with a split Congress (= gridlock). The latter takes pressure off of the Fed.
Remember, the Fed was ready to pause on rates at 2.25% back in July. That was before the Biden White House and democrat-controlled Congress decided to greenlight another $1 trillion-plus spending binge. The Fed won’t get sideswiped with any more ofthese surprises, with a split Congress.
On a related note, remember, going back to 1950, there has never been a 12-month period, following a midterm election, in which stocks were down. And the average one-year return following the eighteen midterm elections of the past seventy years was 15% (about double the long-term average return of the S&P 500).
Keep in mind, markets have priced in a lot of negative expectations (from the rate path, to earnings erosion, to recession). That sets up for positive surprises. Stocks like positive surprises.
What is among the best performing asset coming out of a bear market in stocks? Small cap value stocks. That’s precisely what we hold in our Billionaire’s Portfolio (with the extra kicker of a catalyst, often from the direct influence of a billionaire investor). We significantly outperformed broader markets in 2022, and are positioned to have an explosive bounce in 2023 (perhaps similar to what we saw in 2016, where we bounced 40 percentage points from the low point of the broader market correction — outpacing the S&P by 2 to 1).
Click here to join me, and get your portfolio in line with ours.
April 25, 5:00 pm EST
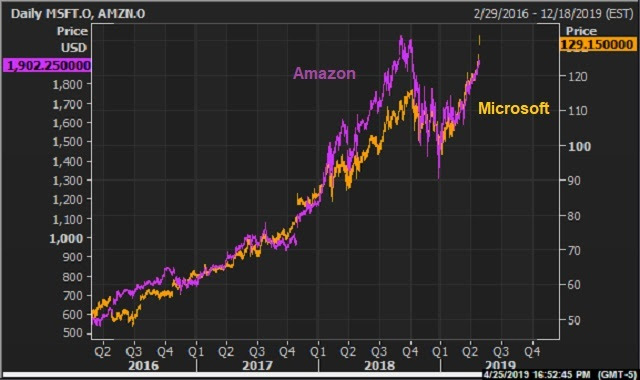
Today, Microsoft was the third company to hit the trillion-dollar market cap threshold.
Apple was the first, back in August. Amazon followed in September.
Let’s talk about how Microsoft has transformed itself from a path of obsolescence to quadrupling in value in six years.
Back in April of 2013, an activist investor named Jeff Ubben took a $2 billion stake in MSFT. That same month Business Insider wrote a story titled: “Microsoft Could Be Obsolete By 2017.” The stock had gone nowhere for more than a decade.
Ubben won a board seat and he pushed for stock buybacks and a strategy reset. He pushed out the CEO, Steve Balmer. He replaced him with Satya Nadella, who was running the Miscrosoft cloud business. His job was to turn Miscrosoft into a cloud computing company. He has done it.
Microsoft is now the number two cloud computing platform globally, behind Amazon. For perspective, cloud computing is a $200 billion market growing at close to 20% a year. And Microsoft’s cloud business, Azure,grew revenue by 73% last quarter.
Bottom line: Amazon and Microsoft have a duopoly in the high growth digital storage business (i.e. cloud computing).
Amazon’s retail business gets all of the attention, but it’s cloud business has been subsidizing it’s retail business for a long time. The hyper-growth in cloud and the market dominance held by Amazon and Microsoft are why their market value has gone to a trillion-dollars, and why their charts look so similar …
|
 |
If you haven’t signed up for my Billionaire’s Portfolio, don’t delay … we’ve just had another big exit in our portfolio, and we’ve replaced it with the favorite stock of the most revered investor in corporate America — it’s a stock with double potential.
Join now and get your risk free access by signing up here.
|
|
|
|
|
September 4, 5:00 pm EST
Today, Amazon became the second company (following Apple) to cross the one trillion-dollar valuation threshold.
This stock is up 72% year-to-date. It has doubled in the past year and has nearly tripled since Trump’s election. That’s what happens when you have a pour gasoline (economic growth) on a fire (a monopoly). No one should love Trump more than Jeff Bezos.
But at 161 times earnings, the market seems to be betting on the Amazon monopoly being left to corner all of the world’s industries. That’s a bad bet.
Much like China undercut the competition on price and cornered the world’s export market, Amazon has undercut the retail industry on price, and cornered the world’s retail business. That tipping point (on retail) has well passed. And as sales growth accelerates for Amazon, so does the speed at which competition is being destroyed. But Amazon is now moving aggressively into almost every industry. This company has to be/will be broken up.
The question is, how will the market value an ecommerce business that would no longer be subsidized by the high margin Amazon cloud business (AWS)? A separation of the businesses would put Amazon’s ecommerce margins under the Wall Street microscope (as every other retailer is subjected to) and materially impact a key sales growth driver for Amazon, which is investment in innovation (R&D).
If you haven’t joined the Billionaire’s Portfolio, where you can look over my shoulder and follow my hand selected 20-stock portfolio of the best billionaire owned and influenced stocks, you can join me here.
Nasdaq:AMZN, Nasdaq:AAPL, Nasdaq:FB, Nasdaq:GOOG
January 29, 7:00 pm EST
For the first time in a decade, the mood at the World Economic Forum in Davos was of optimism and opportunity. And Trump economic policies have had a lot to do with it.
That optimism has continued to drive markets higher this year: global stocks, global interest rates, global commodities – practically everything.
The S&P 500 is up nearly 7% on the year now — just a little less than a month into the New Year. And we’ve yet to see the real impact of tax incentives hit earnings and investment.
But, with the rising price of oil (now above $65), and improving consumption (on the better outlook), we will likely start seeing the inflation numbers tick up.
Now, what will be the catalyst to cap this very sharp run higher in stocks to start the year? It will probably be the first “hotter than expected” inflation number.
That would start the speculation that the Fed might need to move rates faster, and it might speed-up the exit talks from QE in Europe and Japan.
If the inflation outlook triggers a correction (which would be healthy), that would set the table for hotter earnings and hotter economic growth (coming down the pike) to ultimately drive the remainder of stock returns for the year.
For help building a high potential portfolio, follow me in our Billionaire’s Portfolio subscription service, where you look over my shoulder as I follow the world’s best investors into their best stocks. Our portfolio of highest conviction, billionaire-owned stocks is up close to 50% over the past two years. You can join me here and get positioned for a big 2018.
August 7, 2017, 4:00 pm EST Invest Alongside Billionaires For $297/Qtr
| James Bullard, the President of the St. Louis Fed, said today that even if unemployment went to 3% it would have little impact on the current low inflationevironment. That’s quite a statement. And with that, he argued no need to do anything with rates at this stage.And he said the low growth environment seems to be well intact too — even though we well exceeded the target the Fed put on employment years ago. In the Bernanke Fed, they slapped a target on unemployment at 6.5% back in 2012, which, if reached, they said they would start removing accomodation, including raising rates. The assumption was that the recovery in jobs to that point would stoke inflation to the point it would warrant normalization policy. Yet, here we are in the mid 4%s on unemployment and the Fed’s favored inflation guage has not only fallen short of their 2% target, its trending the other way (lower).
As I’ve said before, what gets little attention in this “lack of inflation” confoundment, is the impact of the internet. With the internet has come transparency, low barriers-to-entry into businesses (and therefore increased competition), and reduced overhead. And with that, I’ve always thought the Internet to be massively deflationary. When you can stand in a store and make a salesman compete on best price anywhere in the country–if not world–prices go down.
And this Internet 2.0 phase has been all about attacking industries that have been built upon overcharging and underdelivering to consumers. The power is shifting to the consumer and it’s resulting in cheaper stuff and cheaper services. And we’re just in the early stages of the proliferation of consumer to consumer (C2C) business — where neighbors are selling products and services to other neighbors, swapping or just giving things away. It all extracts demand from the mainstream business and forces them to compete on price and improve service. So we get lower inflation. But maybe the most misunderstood piece is how it all impacts GDP. Is it all being accounted for, or is it possible that we’re in a world with better growth than the numbers would suggest, yet accompanied by very low inflation?
Join our Billionaire’s Portfolio and get my most recent recommendation – a stock that can double on a resolution on healthcare. Click here to learn more. |
July 13, 2017, 4:00 pm EST Invest Alongside Billionaires For $297/Qtr
 With some global stock barometers hitting new highs this morning, there is one spot that might benefit the most from this recently coordinated central bank promotion of a higher interest environment to come. It’s Japanese stocks.
First, a little background: Remember, in early 2016, the BOJ shocked markets when it cut its benchmark rate below zero. Counter to their desires, it shook global markets, including Japanese stocks (which they desperately wanted and needed higher). And it sent capital flowing into the yen (somewhat as a flight to safety), driving the value of the yen higher and undoing a lot of the work the BOJ had done through the first three years of its QE program. And that move to negative territory by Japan sent global yields on a mass slide.
By June, $12 trillion worth of global government bond yields were negative. That put borrowers in position to earn money by borrowing (mainly you are paying governments to park money in the “safety” of government bonds).
The move to negative yields, sponsored by Japan (the world’s third largest economy), began souring global sentiment and building in a mindset that a deflationary spiral was coming and may not be leaving, ever—for example, the world was Japan.
And then the second piece of the move by Japan came in September. It was a very important move, but widely under-valued by the media and Wall Street. It was a move that countered the negative rate mistake.
By pegging its ten-year yield at zero, Japan put a floor under global yields and opened itself to the opportunity to doing unlimited QE. They had the license to buy JGBs in unlimited amounts to maintain its zero target, in a scenario where Japan’s ten-year bond yield rises above zero. And that has been the case since the election.
The upward pressure on global interest rates since the election has put Japan in the unlimited QE zone — gobbling up JGBs to push yields back down toward zero — constantly leaning against the tide of upward pressure. That became exacerbated late last month when Draghi tipped that QE had done the job there and implied that a Fed-like normalization was in the future.
So, with the Bank of Japan fighting a tide of upward pressure on yields with unlimited QE, it should serve as a booster rocket for Japanese stocks, which still sit below the 2015 highs, and are about half of all-time record highs — even as its major economic counterparts are trading at or near all-time record highs.

May 17, 2017, 4:00pm EST Invest Alongside Billionaires For $297/Qtr
 Yesterday we talked about the disconnect between the daily drama from the media in Washington (doom and gloom), and what the markets have been communicating (an economic expansion is underway). Today, you might think that connection is happening — the doom and gloom scenario is finally being realized in markets. Probably not.
For perspective: As of the close yesterday, the Nasdaq was up 18% year to date (just five months in). Gold was in the middle of a three year range. Market interest rates (the U.S. 10-year government bond yield) was just above the middle of the range of the past four years. The dollar was not far off its strongest levels in 15 years.
Today the media has explicitly printed the headline of impeachment for Trump (actually, they’ve run those headlines a various times over the past several months). Nonetheless, stocks (the S&P 500) today are off by 1.6%.
This gets the bears very excited. I saw the story about consumer debt, surpassing 2008 levels, floating all over the internet today. People tried to make the bubble connection — implying another debt crisis was coming.
The real story: Total household indebtedness finally surpassed the previous peak from 2008. That’s precisely what the Fed was attempting to do with zero interest rates. Make existing debt cheaper to manage, and at some point, break the psychology of the debt burden and get people borrowing (at ultra-cheap rates), investing and spending again. Otherwise, our economy and the world economy would have gone into a deflationary spiral.
That said, as I’ve found in my 20 years in this business, people tend to find a story to fit the price. The story hadn’t been fitting the price for much of the past six months. Today, it seems pretty easy. See the chart below of stocks ….
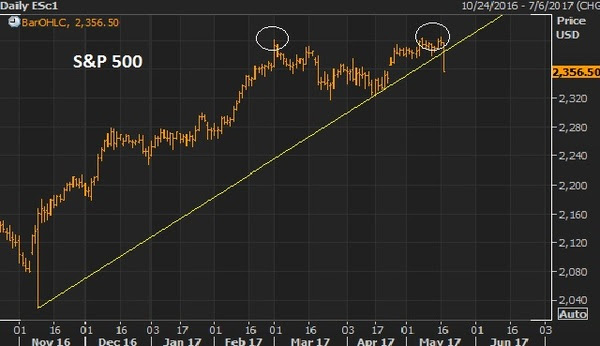
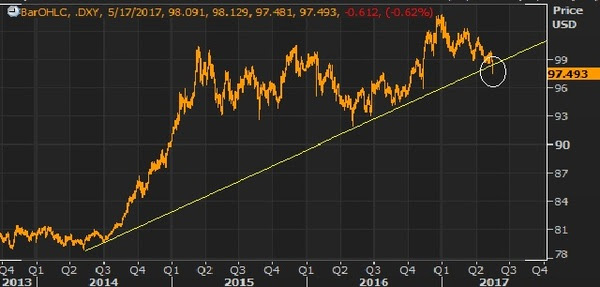
We had the first breakdown of the Trump trend in March, but all it could muster was about a 3% correction. This looks much more like a technical correction (a double top, and trend break today) – than a Trump impeachment trade. I suspect with the earnings catalyst behind us, this is the start of a deeper technical correction, which is healthy in a bull market. And it may take significant progress made in tax reform to see new highs in the broad stock indicies. We shall see.This next chart is the dollar index. This too had a significant trend break today. This translates into a higher euro, which would spell out a story where Europe is improving and the ECB is able in start discussing exit from QE.
What about the Trump/Comey saga? Aren’t people dumping dollars because of that? Not likely. If that were potentially destabilizing to the U.S., it would be destabilizing to the global economy, and people would buy dollars not sell them.
With that in mind, here’s gold. Gold sits on the brink of a big trend break (higher). When looking at gold and the dollar, it’s important to remember this: back in the heat of the crisis, gold and the dollar moved
together, higher! That’s opposite of the traditional correlation. They moved higher together because people bought gold and they bought dollars (and dollar denominated assets, like Treasuries) as they viewed it the safest alternative in the world to park money – with the chance of getting it back.
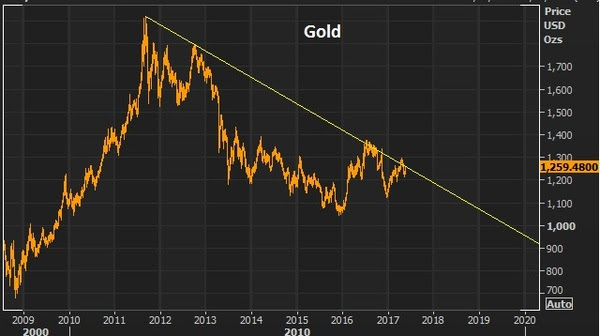
With a break higher in gold looking imminent, and the dollar looking lower, it looks like a more traditional relationship. It’s not communicating crisis.
Follow This Billionaire To A 172% Winner
In our Billionaire’s Portfolio, we have a stock in our portfolio that is controlled by one of the top billion dollar activist hedge funds on the planet. The hedge fund manager has a board seat and has publicly stated that this stock is worth 172% higher than where it trades today. And this is an S&P 500 stock!
Even better, the company has been constantly rumored to be a takeover candidate. We think an acquisition could happen soon as the billionaire investor who runs this activist hedge fund has purchased almost $157 million worth of this stock over the past year at levels just above where the stock is trading now.
So we have a billionaire hedge fund manager, who is on the board of a company that has been rumored to be a takeover candidate, who has adding aggressively over the past year, on a dip.
Join us today and get our full recommendation on this stock, and get your portfolio in line with our BILLIONAIRE’S PORTFOLIO.
November 21, 2016, 6:30pm EST
Stocks hit new record highs again in the U.S. today. This continues the tear from the lows of election night. But if we ignore the wild swing of that night, in an illiquid market, stocks are only up a whopping 1.2% from the highs of last month — and just 8% for the year. That’s in line with the long term average annual return for the S&P 500.
And while yields have ripped higher since November 8th, we still have a 10 year yield of just 2.32%. Mortgages are under 4%. Car loans are still practically free money. That’s off of “world ending” type of levels, but very far from levels of an economy and markets that are running away (i.e. you haven’t missed the boat – far from it).
Despite this, we’re starting to see experts come out of the wood works telling us that the economy has been in great shape for a while. That’s what this is about – what’s with all the fuss? Not true.
Remember, it was just eight months ago that the world was edging toward the cliff again, as the oil price bust was threatening to unleash another global financial crisis. And that risk wasn’t emerging because the economy was in great shape. It was because the economy was incredibly fragile — fueled by the central banks ability to produce stability, which produced confidence, which produced some spending, hiring and investment, which produced meager growth. But given that global economic stability was completely predicated on central banks defending against shocks to the system, not on demand, that environment of stability was highly vulnerable.
Now, of course, we finally have policies and initiatives coming down the pike that will promote demand (not just stability). If have perspective on where markets stand, instead of how far they’ve come from the trough of election night, we’re sitting at levels that scream of opportunity as we head into a new pro-growth government.
When the economic crisis was in the early stages of unraveling, the most thorough study on past debt crises (by Reinhart and Rogoff) found that delevering periods (the time after the bust) took about as long as the leveraging period (the bubble building period before the bust). With that, it was thought that the deleveraging period would take about 10 years. History gave us the playbook, in hand, from very early on in the crisis.
With that in mind, the peak in the housing market was June of 2006. That would put 10 years at this past June. The first real event, in the unraveling of it all, was the bust of two hedge funds at Bear Stearns in mid 2007. That would put the 10 year mark at seven months out or so.
That argues that we’re not in the late stages of an economic growth cycle that was just unfortunately weak (as some say), but that we should just be entering a new growth phase and turning the final page on the debt crisis. And that would argue that asset prices are not just very cheap now, but will be for quite some time as a decade long (or two) prosperity gap closes.
Follow me in our Billionaire’s Portfolio, where you look over my shoulder as I follow the world’s best investors into their best stocks. Our portfolio is up 20% this year. That’s almost 3 times the performance of the broader stock market. Join me here.
Despite the powerful recovery in stocks, the rally has had few believers. All along the way, skeptics have pointed to threats in Europe, domestic debt issues, political stalemates, perceived asset bubbles — you name it. As it relates to stocks, they’ve all been dead wrong.
The S&P 500 is now more than 200% higher than it was at its crisis-induced 2009 lows, and 34% higher than its all-time highs. Meanwhile, the Nasdaq 100 is still shy of its March 2000 high of 4816. That creates a scenario for an explosive rise still to come for the Nasdaq.
For those that have been cautious about the level of stocks, many have argued that the economy is fragile. The bond market disagrees. The yield curve may be THE best predictor of recessions historically. Yield curve inversions (where short rates move above longer-term rates) have preceded each of the last seven recessions. Based on this yield curve analysis, the Cleveland Fed puts the current recession risk at just 5.97% — a level more consistent with economic boom times.

With this economic backdrop in mind, our research at BillionairesPortoflio.com shows that stocks will continue to march higher, likely a lot higher.
Consider this: If we applied the long-run annualized return for stocks (8%) to the pre-crisis highs of 1,576 on the S&P 500, we get 2,917 by the end of this year, when the Fed is expected to start a slow process toward normalizing rates. That’s 38% higher than current levels. Below you can see the table of the S&P 500, projecting this “normal” growth rate to stocks.

In addition to the above, consider this: The P/E on next year’s S&P 500 earnings estimate is just 17.1, in line with the long-term average (16). But we are not just in a low-interest-rate environment, we are in the mother of all low-interest-rate environments (ZERO). With that, when the 10-year yield runs on the low side, historically, the P/E on the S&P 500 runs closer to 20, if not north of it. A P/E at 20 on next year’s earnings consensus estimate from Wall Street would put the S&P 500 at 2,454, or 16% higher than current levels for stocks.
What about the impending end to zero interest rates in the United States? Well, guess what? Asset prices are driven by capital flows. Barron’s reports a $1.63 trillion spread between bond-fund inflows and equity-fund outflows from January 2007 to January 2013, said to be the widest spread ever. Over that period, $1.23 trillion flowed into bond funds and $409 billion exited equity funds. This means, an official end to zero interest rates should mean a flood of capital leaving bond markets and entering equity markets.
Now, how might all of this bode for the Nasdaq? In March 2000 when the Nasdaq traded at its all-time highs, the index traded at well over 100 times earnings. And the ten year yield was 6.66%. As an investor, you could exit a market with record high valuations and get a risk free, nearly 7% return on your money in Treasuries. Today, the Nasdaq has a price/earnings multiple of just 21. And the ten year yield is a paltry 2%. This dynamic continues to underpin demand and capital flows favoring stocks.
With that said, here are the top four constituents in the Nasdaq 100, their current valuation and the equivalent investment option in the year 2000, when the Nasdaq last peaked.
1) Apple (AAPL) – Apple trades at just 15 times next year’s earnings estimates. Back in 2000, Microsoft (MSFT), the biggest constituent company of the Nasdaq traded 57 times forward earnings.
2) Google (GOOG) – Google trades at 19 times next year’s earnings estimates. Back in 2000, Cisco (CSCO), the second biggest constituent company of the Nasdaq traded 127 times forward earnings.
3) Microsoft (MSFT) – Microsoft trades at just 16 times next year’s earnings estimates. Back in 2000, Intel (INTC), the third biggest constituent company of the Nasdaq traded 43 times forward earnings.
4) Facebook (FB) – Facebook trades at 39 times next year’s earnings estimates. Back in 2000, Oracle (ORCL), the fourth biggest constituent company of the Nasdaq traded 103 times forward earnings.
BillionairesPortfolio.com helps average investors invest alongside Wall Street billionaires. By selecting the best ideas from the best billionaire investors and hedge funds, our exited stock investment recommendations have averaged a 31% gain since 2012, beating even the great Carl Icahn’s record for the same period.
How to Invest Alongside Billionaire Investors without Having a Billion Dollars
Five Stocks with Triple-Digit Potential If Boone Pickens Is Right About $80 Oil
This morning the Swiss National Bank (SNB) surprised the world by abandoning its managed Swiss franc floor against the euro. The SNB said as recently as Monday that they remained committed to the 1.20 minimum EUR/CHF rate, a floor they have maintained for three years. They also announced a further reduction to an already negative deposit rate. Swiss bank account holders will now be paying 0.75% for the privilege of having funds on deposit in the Swiss banking system.
The move by the SNB created a violent 28% collapse in EUR/CHF.

And, as you can see in the chart below, there was an equally violent collapse in USD/CHF.

After the initial massive gap in CHF pairs, the CHF is now trading well off of its strongest levels of the day. SNB chief Jordan said in his postpartum press conference that the Swiss franc dramatically overshot and that he expected it to ultimately reflect the fundamentals of a soft Swiss economy with negative deposit rates. This statement acknowledges the huge dislocation in USD/CHF that has resulted from the SNB’s actions.
The Fed and the SNB remain on divergent monetary policy paths. The Fed is exiting emergency policies, while the SNB is going further down the path of aggressive, extraordinary easing policies. This fundamentally drives capital out of Switzerland and into U.S. assets. The Swiss can now buy 10% more U.S. treasuries and U.S. stocks than they could yesterday at this time.
Why did the SNB do it?
Why did they reverse course on a policy they’ve held steadfastly for three years, and to which they have promised to remain committed? It’s likely because they are expecting big and bold actions from the ECB next week. The ECB has been explicitly devaluing the euro through their policies and policy guidance. Meanwhile, the Swiss National Bank has been persistently gobbling up euros in defense of their EUR/CHF exchange rate floor. That euro stockpile has been persistently losing value, and all evidence points to much larger losses ahead. With that, it appears most likely that the SNB decided to step out of the way of the downhill freight train, the euro.
For global markets, attention continues to be squarely on Europe. And today’s events highlight that point. Stocks, interest rates and currencies have been swinging around, driven primarily by fears that the deflationary problems in Europe are a deeper signal of weak global demand. But weak global demand isn’t a new problem. It has been a clear problem from the outset of the 7+ year global financial and economic crisis. That dynamic has been improving, not worsening. Europe, however, is facing deflationary pressures and no growth due to other factors, most importantly, while they should have been rolling out policies to promote growth in 2010, they further strangled growth by tightening the fiscal belt.
We will hear from the ECB on January 22. European officials have been on a media assault in recent days in an attempt to manage expectations on the ECB decision. With today’s SNB actions, an announcement of outright purchases of sovereign debt by the ECB are expected, and likely more to go along with it (like a further cut in the deposit rate).
On January 25th we get results on the Greek elections, which will determine whether or not a new administration takes the reins. The anti-euro, anti-bailout, Syriza party is favored to take control. This poses a risk to the Eurozone and the euro. This party is expected to, at best, demand softer conditions on their bailout and reform program. At worst, they are a threat to take Greece out of the European Monetary Union altogether.
But if we look at yields in the weak countries in the EMU (including Greece), those markets tell us that Greece isn’t a threat to euro zone stability.
Instead of yields in the troubled euro zone countries trading at unsustainable/default levels, yields in Italy and Spain are now trading below that of U.S. 10 year yields (well below 2%). Greek 10 year yields were trading over 40% at the peak of the European sovereign debt crisis. Now, Greek yields are well below 10%. So again, for those looking for smoke before fire, the European sovereign debt markets are giving you no signals.
For now, it’s about how big and how bold Draghi and company will be. Big action should be very good for the global economy and very good for global markets.
The theme of the year has been divergent policies, with the Fed positioned to exit emergency policies this year, while the ECB and BOJ are positioned to do more aggressive QE. When you step back from the day to day noise, that theme continues to play out, and it is good for global stocks, good for the dollar and good for global growth.


