March 11, 5:00 pm EST

We ended last week with a 4.4% plunge in Chinese stocks.  What followed, Friday morning (EST time), was an announcement that the Fed Chair (Jerome Powell) would be appearing on an exclusive 60 Minutes sit down interview Sunday night.

This is a rare occurrence, that the Fed Chair does a mainstream media interview/Q&A.  These Q&A’s are typically done in Congressional hearings, following Fed meetings or at select economic conferences.  The common theme:  He speaks economics and policy to economic and policy practitioners.

With that, this interview with 60 Minutes was clearly a desire to speak to the broader public.  In part, it was a response to the growing risks of a confidence shock (given the December stock market decline, Brexit drama and China/U.S. trade uncertainty).  It was an opportunity to tell the public that the economy is doing well, despite the media’s doom and gloom stories.

Also, in part, it was an opportunity to tell the public that the Fed is there to defend against shocks and panics, and that they won’t be swayed by politics.

Powell was also specifically asked about a few of the cherry picked data points the financial media has been parading around in recent days.  As we discussed Friday, without context, some of the data can sound ominous.  He added context, including for the  dip in retail sales from December.  Of course the retail sales hit was the result in the knee-jerk swing in confidence that comes with the December plunge in the stock market.  He said they would be watching the January number closely.  The January number today, indeed, was strong.

That (the interview and the confirmation of the retail sales data) was a catalyst for a big bounceback in stocks today.

Powell is following the script of the Ben Bernanke.  When Bernanke was directing the Fed through the storm of the financial crisis, he (and the Fed) were being killed in the media.  And the media set the tone for global leaders to take shots at the Fed too.  So, Bernanke took to 60 minutes to speak directly to the people – to set the record straight.  That interview set the bottom in the stock market — and it turned the tide in global sentiment.

Join me here to get my curated portfolio of 20 stocks that I think can do multiples of what broader stocks do, coming out of this market correction environment.

March 5, 5:00 pm EST

There’s a lot of excitement about the building IPO docket for the year.  Let’s take a look of the lay of the land …

There is said to be more than 220 companies planning to go public in 2019.

On Friday, Lyft filed an S1 with the SEC (a prospectus like document) in preparation for an IPO.  This will be the first Silicon Valley darling to go public this year.

Lyft is the second largest ride-sharing company — owns about a third of the U.S. market, with Uber owning the rest.  Uber is expected to go public this year.  The other big ones coming:  Airbnb, WeWork and Palantir.

We’ve clearly had a boom cycle in Silicon Valley over the past decade.  But are these IPOs coming late the party?

Remember, we have an administration in Washington that has tightened the regulatory screws on the dominant publicly-traded tech giants (Facebook, Amazon, Google).  The regulatory tailwinds (or lack thereof) that they enjoyed along the path of their disruptive growth, have now turned into headwinds.  And the stocks have all been hit, as a result.

Keep in mind, the private market valuations were pumped-up in these IPO candidates when public equity markets were offering little optimism about future returns.  With that, pension money was flowing into the coffers of Silicon Valley private equity firms.  And private equity fund managers were throwing money at things — and companies have been burning through that money, ramping staff, buying fancy offices and inundating us with blitz advertising campaigns.

Safe to say there has been an overhyping of the term “disrupters.”  In many cases, we’re looking at startups trying to underprice and outspend (with our pension money) in a traditional business, without having the hurdle of making money (maybe ever).  Not surprisingly, there have been market share wins.

But public companies tend to be held to a standard: profitability.  We’ll see how they do with the shifting market environment (i.e. late cycle Silicon Valley).

Lyft will be an early indicator.  Its last private investment valued the company at $15.1 billion.  For that, in their filing, they revealed a company doing a little over $2 billion in revenue, while losing almost a billion dollars last year.  Revenue growth has been slowing, losses have been widening as the private equity investors attempt to cash out in the public markets.

Join me here to get my curated portfolio of 20 stocks that I think can do multiples of what broader stocks do, coming out of this market correction environment.

February 12, 5:00 pm EST

Yesterday we talked about the big trend break in the S&P 500 and the big 200-day moving average hurdle, above.  Today we closed right on that 200-day moving average.

Here’s an update of the chart …


With this momentum, the chart tonight to watch is in Japan.  Here’s a look at Japanese stocks.  

As you can see, U.S. stocks have broken the downtrend of the past quarter, but Japanese stocks have yet to follow.  The Nikkei remains 15% off of the highs of October.  But with the strength in U.S. stocks today, we may get the breakout in Japanese stocks tonight, ahead of Japanese Q4 GDP (which is due tomorrow night). These are some ETFs that track the Nikkei. We own DBJP in my Forbes Billionaire’s Portfolio, an ETF that tracks the dollar-denominated Nikkei.  

Join me here to get my curated portfolio of 20 stocks that I think can do multiples of what broader stocks do, coming out of this market correction environment.

February 9, 5:00 pm EST

It’s a fairly light data week this week.  And we’re in the final stretch of Q4 earnings season, which has been good, despite a bad stock market for the quarter.

As for stocks, after a very huge bounce back in January, February has been flat.

But we’re working on this chart … 

As you can see, the S&P 500 has broken out of the downtrend that started October 3rd, but has failed (thus far) at the 200-day moving average (the purple line).  That 2,742 level is a key area to overcome for a return back to the levels of December 3.  That would complete this V-shaped recovery (about 3.5% higher than current levels).

Mnuchin and Lighthizer are in China this week.  So we’ll get more information on the U.S./China trade front.  However, it now looks like the March 1 trade truce deadline will be pushed back.  And maybe the whole thing culminates with a meeting between Trump and Xi at Mar-A-Lago next month.

Perhaps a good signal, after the holiday week in China for the Lunar New Year, Chinese stocks opened the week strong.  The index that tracks smaller cap stocks and higher risk tech names jumped 3.5%, for the biggest two day gain since early October.  Broad stocks in China are now up 9% from the January lows.

Join me here to get my curated portfolio of 20 stocks that I think can do multiples of what broader stocks do, coming out of this market correction environment.

February 8, 5:00 pm EST

Let’s take a look at some key charts as we end the week.

As we discussed yesterday, we had growth downgrades from Europe this week, and it was driven by the worst case scenarios of a no-deal on Brexit, and/or a continued stalemate/no deal on U.S. China trade.

Let’s see how that’s being interpreted in the key global interest rate markets.

First, we should acknowledge that the big swing in global economic sentiment was driven by the optimism surrounding the 2016 elections (i.e. a pro-growth U.S. President).

That gave us a sharp rise in global interest rates, and a sharp rise in global stock markets.  But now some of the air has been taken out of the optimism-balloon, and some big levels are being tested.

First, here’s a look at the U.S. 10-year yield.  On election night the 10-year was trading around 1.75%.  It has traded as high as 3.25% since.  But now we have this big line representing the rise from election night …


The 2.55% area is a big area for U.S. rates.

And in Germany, the German 10-year yield has returned to pre-Trump levels this week. 

After a decade of global QE, loads of global fiscal stimulus and countless backstops/intervention, lending your money to the German government for 10 years (the strongest economy in the euro zone) will pay you 9 basis points a year.
So, the interest rate market sits on critical levels heading into next week.
While a lot of attention by global politicians has been given to U.S. policy, this should be a clear signal to eurozone politicians to stop relying on the ECB, and to take some aggressive action to stimulate the economy (i.e. fiscal stimulus and structural reform).
Still, the move in rates looks well overdone.  Probably a good time to sell bonds – looking for rates to move higher from here.
Join me here to get my curated portfolio of 20 stocks that I think can do multiples of what broader stocks do, coming out of this market correction environment.

February 7, 5:00 pm EST

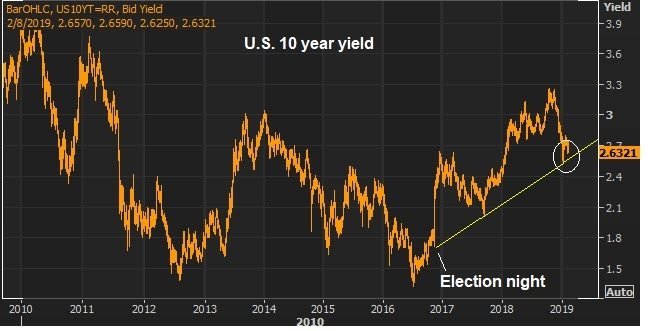
Downgrades on growth today weighed on global markets.

First, the European Commission slashed growth expectations for 2019 for all the major euro economies. For the EU overall, they are looking for 1.3% growth, versus 1.9% a few months ago.

Next up was the Bank of England decision on rates this morning.  They left rates unchanged, but downgraded growth for ’19 and ’20.  Keep in mind, this all incorporates the reset of expectations on global interest rates that have taken place over the past month (i.e. acommodative and staying that way).

So, why the downgrades? It’s all driven by fears of the worst case scenario on Brexit and U.S./China trade negotations.  That worst case scenario would be “no deal.”

Importantly, if we get these deals, the upgrades will come, quickly.

For the moment, though, we’re continuing to see an environment that looks much like 2016.  Central banks responded to the crash in oil prices by resetting expectations on monetary policy (easier).  And then the growth downgrades followed.

By the end of 2016, the U.S. election had swung sentiment from pessimism to optimism, and the growth upgrades came in — the Fed actually raised rates before the year-end.

I suspect if the fog of uncertainty clears, we will see the same.  But in the meantime, promoting the worst case scenario for growth may get policymakers in Europe motivated to follow the lead of the U.S. with some needed fiscal stimulus.  That would be good for European and global growth.


Join me here to get my curated portfolio of 20 stocks that I think can do multiples of what broader stocks do, coming out of this market correction environment.
.

February 6, 5:00 pm EST

Trump’s State of the Union address last night telegraphed the next priority in his economic plan:  Infrastructure.

Just two years in, this has become one of the final pillars of his Trumponomics plan, yet to be executed on.

Remember, when Trump took office he quickly went to work on reversing regulations that were stifling industries.  By the end of 2017, we got big tax cuts, which included incentives for companies to repatriate trillions of dollars of money held offshore.  And, of course, the fight for “fair trade” is ongoing, and maybe close to a resolution.

With these pro-growth policies, we have an economy that has finally escaped the decade-long rut of sub-2% growth.  We’ve returned to long-term trend growth (3%+).

So things look good, but we’ve yet to get the big kicker of an infrastructure spend. This is where we could see a real economic boom kick in.

And a split Congress is thought to be supportive of an infrastructure plan.  We’ve heard the Trump plan, which is $1.5 trillion funded through a private/public partnership.  After the Democrats won the house they said infrastructure would be high on the party’s agenda.  Back in March, the Democratic Senators proposed a $1 trillion plan.

If we get it, a big infrastructure spend could finally give us the big bounce back we typically see after a recession (i.e. some very big numbers).

Remember, the recovery of the past decade was manufactured by central banks.  The monetary stimulus and central bank intervention was good enough to keep the patient alive, but not to restore the global economy back to sustained, trend-growth. So we needed fiscal stimulus.  And we’ve gotten it.  But we’ve yet to see the type of big bounce back in growth typical of a post-recession recovery.

For context, in the left column of the table below, you can see the GDP numbers following the Great Depression.  And on the right, you can see the growth of the post-Great Recession (pre-Trump).

FBP_122717.jpg


Join me here to get my curated portfolio of 20 stocks that I think can do multiples of what broader stocks do, coming out of this market correction environment.

January 29, 5:00 pm EST

Today let’s take a look at the recent moves the U.S. administration has made against Venezuela, and what that means for oil prices.

It was August of 2017, when Trump first stepped up pressure on Venezuela.  Venezuela is (and has been) in a humanitarian, political and economic crisis–led by what the U.S. administration has officially called a dictator. Trump slapped sanctions on the Venezuelan President back in 2017 (freezing his U.S assets) and was said to be considering broad oil sanctions. That finally came yesterday (seventeen months later).

For a country that relied heavily on oil exports (ninety-five percent of export revenues in Venezuela come from oil), the U.S. will no longer be sending money to Venezuela for oil.

This is a crushing blow for an already suffering country.

What does it mean for oil prices?

Venezuela has the world’s largest oil reserves. With oil sanctions, should come supply disruptions for the oil market, which could likely send oil aggressively higher.

Back in 2017, when Trump threatened sanctions, oil broke out of its $40-$55 range, and ultimately traded up to $76.

Today, we’re nearing the top end of that same range.

Join me here to get my curated portfolio of 20 stocks that I think can do multiples of what broader stocks do, coming out of this market correction environment.

January 28, 5:00 pm EST

This is a huge week.  We’re following a down 9% month for stocks with a big bounceback.  But it will all hinge on the events of the week.

We get Q4 earnings from about quarter of the companies in the S&P 500 – and a third of the Dow.  We have the Fed on Wednesday.  And the U.S. hosts trade talk meetings with China on Wednesday and Thursday.  And then on Friday, we’ll get the jobs report.

We kicked off earnings season with reports from the big banks two weeks ago.  And the reports broadly painted the picture of a healthy consumer and healthy economy.

This week, we hear from a broad swath of blue chips, including big multinational businesses.  Among them:  We heard from Caterpillar today. We’ll hear from Apple and Boeing tomorrow.  McDonalds and 3M report on Wednesday.  Amazon is on Thursday.

Expect a lot of discussions about “concerns” on the outlook (as we heard from Caterpillar today), but with a picture about Q4 that looked good (continuing with the theme of 2018).

Remember, much of the talk about slowdown has been about what might happen, in the year (or two) ahead – which primarily assumes a long-term stalemate on the Trump trade war.  With that, never underestimate Wall Street and corporate America’s willingness to set the bar low (when given the opportunity), so that they can jump over a very low bar (i.e. set up for earnings beats in future quarters).

Far more important than those “concerns” voiced by CEO’s, is what the Fed has already done, and what will come out of the U.S./China talks this week.

Remember on January 4th, the Fed responded to the calamity in financial markets by backing down from their rate hiking plans.  This week, the Fed Chair will likely use his post-meeting press conference to further massage markets. The Fed, the ECB and the BOJ have already positioned themselves (in recent weeks) to be the shock absorbers if the trade war continues to drag out.

As for trade talks, the calendar continues to approach the March 1 deadline on the tariff truce.  And China has been gasping for air.  I suspect we will get progress — maybe an official agreement on trade, leaving the intellectual property and technology transfer negotiations still on the table. That would be good progress.

Join me here to get my curated portfolio of 20 stocks that I think can do multiples of what broader stocks do, coming out of this market correction environment.

January 25, 5:00 pm EST

We end the week with a weaker dollar, stronger commodities and recovering stocks.  I suspect this is a building theme for the year – and that it will be a very lucrative one.

With that, let’s take a look at some key charts.

For perspective, here’s a longer term picture of the S&P 500.  As you can see, even after the deep decline of the last quarter, the trend from the crisis lows of 2009 remains intact … and we’ve seen plenty of V-shaped recoveries along the path of this trend …

To this point, stocks have followed a December loss of 9% with a bouncein January of 6%.

We remain about 10% off of the October highs (all-time highs).

The opportunity to take advantage of this bounce in stocks is very attractive, but there are even more attractive opportunities in stocks outside of the U.S.

First, and importantly, the dollar is in a long-term bear cycle….and it’s early.

Here’s a look at the long-term dollar cycles dating back to the failure of the Bretton-Woods system …

The dollar is down 8% in this new bear cycle, and about two-years into a cycle that should run another five to six years. These are the early innings.

A lower dollar should fuel capital flows into foreign stock markets.

Among the most interesting:  Japanese stocks and emerging markets.

Here’s a look at the Nikkei…

Back in late 2012, Shinzo Abe, then candidate for Japanese Prime Minister, promised a big and bold QE plan to beat two decades of deflation, and he had his hand selected candidate to run the BOJ, in waiting, to execute it.  As you can see in the chart on stocks, that beganthe sharp rise in Japanese equities. And that trend too, still holds after the recent sell-off.

Seven years later, the Bank of Japan is now the lone global economic shock absorber (i.e. they are the last major central bank still easing and will be in QE mode for the foreseeable future).  As part of their QE program, they continue to outright buy Japanese stocks.  While U.S. stocks are 10% from the highs of last year, Japanese stocks would still need another 20% to regain the 2018 highs.

As for EM:  If we consider where emerging market stocks were a year ago, and now introduce the possibility that China may be coming to the table later this month with a deal (at least on trade) that will include balancing trade with the U.S. over six years.  How might EM economies look if the world’s leading exporter (China) no longer unfairly floods the world with its cheap products?

Here’s a look at the chart on emerging markets.  You can see we’re getting a big trend-break this month of the ugly downtrend of the past year. 

Finally, a falling dollar and a deal with China is jet fuel for commodities. And you can see in the chart below, this huge downtrend of the past decade is nearing a break.  

With all of the above in mind, I suspect we’ve seen peak pessimism over the past quarter.  And markets are showing signs that we might see a spillover of prosperity from the U.S. economy to the rest of the world, rather than another retrenchment in the global economy.
Have a great weekend!
Join me here to get my curated portfolio of 20 stocks that I think can do multiples of what broader stocks do, coming out of this market correction environment.