
|


|


|
January 31, 5:00 pm EST With the Fed officially on hold, asset prices continue to lift-off. But with U.S./China talks concluding today, there was the potential for a spoiler. Trump quickly stepped in front of that risk this morning, saying that no final deal would be made until he and President Xi meet “in the very near future.” So the expectations of a final “yea or nay” on a China deal today were managed down. And with that, the recovery in global markets finished the month of January on a strong note. What a difference a month makes. In December, people were beginning to worry that collapsing global financial markets would kill the global economic recovery — and maybe fuel another financial crisis. A month later, and the S&P 500 sits just 2% lower than the close of November (before the December rout). And in January, almost every market is in the green (from stocks to bonds to commodities to currencies).
|
 |
|
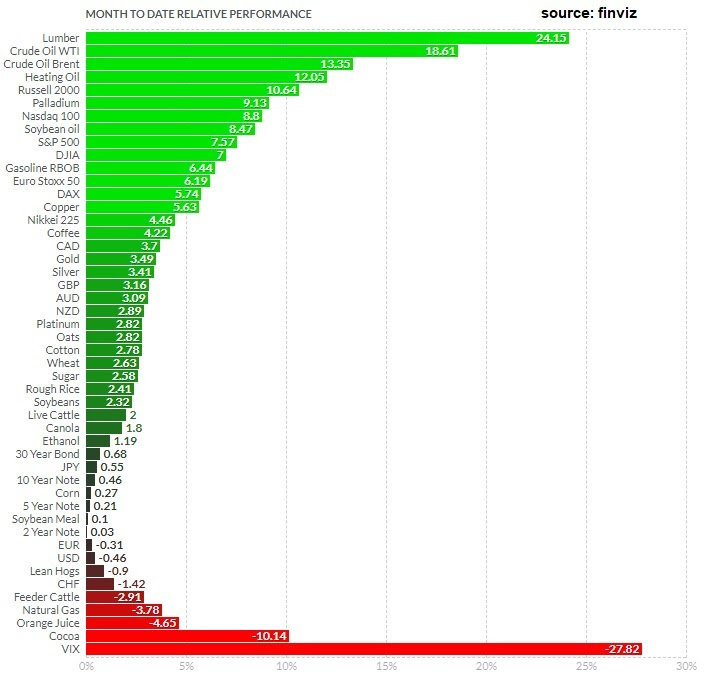
Remember, if we compare this to last year, cash was the best performing major asset class (returning just less than 2% in dollar terms). On Friday, we talked about the set up for a big run in commodities this year. Commodities continue to lead the way. Crude is up close to 20%on the month. Copper is up 6% for January (the commodity known to be a early indicator of turning points in the economy), and gold is up 3.5% just in the past week. We also end the month with another very solid opening to earnings season. Despite all of the pessimism of the past quarter. The Q4 earnings continue to beat expectations. Importantly, the widely held tech giants have posted good reports: Facebook, Apple and Amazon. Importantly, with the expectations bar set low coming into 2019 (for earnings, the economy and a China deal), I’d say we finish the first month of the year in position to exceed expectations on those fronts – thanks, in no small part, to the pivot by the Fed.
Join me here to get my curated portfolio of 20 stocks that I think can do multiples of what broader stocks do, coming out of this market correction environment.
|
|
August 27, 5:00 pm EST The momentum is building for a big run for markets and the economy into the year end. And there are a ton of opportunities. We have the Dow, which has massively lagged performance of the Nasdaq throughout this post-correction recovery. And even as the S&P 500 has regained new record highs, the Dow remained about 900 points from the January highs. That gap is quickly closing. This makes blue-chip stocks a buy. Commodities are in the early stages of a bull market, but have been stalled by trade uncertainty and a stronger dollar. Both have now cleared. Trump is winning on trade. And he now appears to have successfully influenced a turning point in the dollar. Both are fuel for commodities prices that have every fundamental reason to be soaring (including a hot economy and a big infrastructure spend coming). This makes commodities stocks a buy. On the interest rate front, as we discussed Friday, the Fed Chair’s recent comments indicate that the current level of rates could be appropriate, given they don’t see risk of inflation accelerating over their target nor do they see an elevated risk that the economy may overheat. That has turned the tide in the dollar (lower). And it may actually be the catalyst to steepen the yield curve, as the interest rate market starts pricing OUT the risk of overtightening on the economy. Remember, the skittish crowd has been pointing to the flattening yield curve as an indicator that recession is brewing for the economy. A steepening yield curve would take that debate off the table, and would be very good for financial stocks. And the calming on trade and rates make emerging market stocks very interesting. Remember, when the news hit that China would make concessions on trade, we looked at this chart in Chinese stocks and said the bottom is probably in. Chinese stocks are up 5% already, and have a lot of room to run.
|
 |
|
If you haven’t joined the Billionaire’s Portfolio, where you can look over my shoulder and follow my hand selected 20-stock portfolio of the best billionaire owned and influenced stocks, you can join me here. |
|
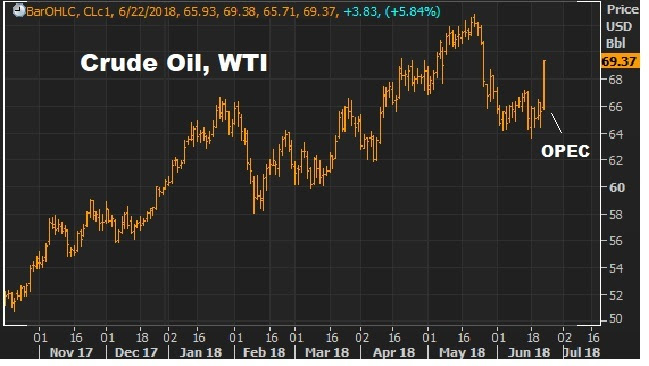
June 22, 5:00 pm EST We’ve talked about the big OPEC decision this week, and the prospects for oil prices. When we get a market that thinks they know the outcome, we get a market that begins leaning too hard in one direction. And that creates an market outcome that can be asymmetric (i.e. lopsided). That’s what we had today. In this case, Trump’s verbal attacks on OPEC’s price manipulation generated a media frenzy surrounding the OPEC meeting. And with the media swarming, the oil ministers seemed happy to oblige with commentary and pontification. And that set expectations for the outcome. And this morning, OPEC released their communique, but it was far from the clean production increase the market was looking for. With that, we got this chart … |
 |
|
It went straight up. Oil was up almost 6% on the day and nearing $70 again. And this lack of enough action (as we should expect) from OPEC, to balance the oil market, may serve as a catalyst to push oil much higher from here (which serves OPEC’s interests). And as we discussed yesterday, with high oil prices now squarely on the radar (for Trump, the media and the market), we may begin seeing oil prices weigh on stock prices. Join our Billionaire’s Portfolio today to get your portfolio in line with the most influential investors in the world, and hear more of my actionable political, economic and market analysis. Click her
|
June 18, 5:00 pm EST
For much of last summer, we talked about the building bull market in commodities.
The price of crude oil has nearly doubled since that time. But broader commodities have yet to take off.
Remember, we’ve looked at this chart of commodities versus stocks quite a bit.

As we’ve discussed, the only two times commodities have been this cheap relative to stocks were at the depths of the Great Depression in the early 30s and at the end of the Bretton Woods currency system in the early 70s.
And from deeply depressed valuations, commodities went on a tear, both times.
Now, since last summer, the trajectory of commodities has been up. But so have stocks. Still, this gap has narrowed a bit. Stocks are up 13% in the past year. The CRB index is up 17%.
The big difference between this year and last year, is the level on the 10-year yield. Last year this time, yields were 2.20%. Today, yields are closer to 3%. That’s because the economy is hotter, and inflation is finally reaching the Fed’s target of 2%.
What asset class should perform the best in a rising inflation environment? Commodities. As we’ve discussed in recent weeks, the data on the economy is lining up for some big positive surprises. That will be fuel for commodities prices.
If you are hunting for the right stocks to buy, in my Forbes Billionaire’s Portfolio. We have a roster of 20 billionaire-owned stocks that are positioned to be among the biggest winners as the market recovers.
May 22, 5:00 pm EST
Yesterday we talked the set up for a turn in the dollar (lower) and in commodities (higher). The broad commodities index hit a fresh three-year high yesterday, and hit another one today – led by natural gas and copper.
This is where we will likely see the next big boom: commodities.
Throughout the post-financial crisis period, we’ve had a disconnect between what has happened in global asset prices (like the recovery in stocks and real estate) and commodities.
Stocks have soared back to record highs. Real estate has fully recovered in most spots, if not set new records. But commodities have been dead. That’s because inflation has been dead.
And that has created this massive dislocation in valuation between commodities and stocks.
You can see in this chart below from Goehring and Rozenzwajg.

The only two times commodities have been this cheap relative to stocks was at the depths of the Great Depression in the early 30s and at the end of the Bretton Woods currency system in the early 70s. Commodities went on a tear both times.
The last time commodities were this cheap, relative to stocks, a broad basket of commodities returned 50% annualized for the next four years – up seven-fold over 10 years. With the economy heating up, and inflation finally nearing the Fed’s target, it’s time for commodities prices to finally catch up.
May 21, 5:00 pm EST
Last week, rising market interest rates in the U.S. were becoming a concern. But as we discussed on Friday, we ended the week with a big bearish reversal signal in the 10-year yield. This week, the market focus seems to be shifting toward a lower dollar and higher commodities.
Friday’s bearish signal in rates seems to have foreshadowed the news coming into today’s session, that Italy is putting forward an agreement for a coalition government that would break compliance from EU rules (an “Italy first” approach to an economic and social agenda).
That has created some flight to safety in the bond market. You can see in this chart below, money moving out of Italian bonds (yields go up) and into German bonds (yields go down).

And that means money goes into U.S. Treasuries too. So you can see U.S. yields (the purple line in the chart below) backing off of the highs of last week, and with room to move back toward 3% (or below) if this dynamic in Italy continues to elevate the risk environment.

Now, with the rate picture softening, the dollar may be on the path of softening too. That would be a welcome site for emerging market currencies. We discussed last week how the push higher in U.S. yields was putting pressure on emerging market currencies. And the combination of weaker currencies and higher dollar-denominated oil prices was a recipe for economic strain.
Today, Larry Kudlow, the Chief Economic Advisor to the White House, carefully crafted a response on the dollar, as to not say they favored it “stronger.” That’s probably enough, given the rising risks in emerging markets, to get the dollar moving lower (to alleviate some of the pain of buying dollar-denominated oil for some of the EM countries).
And it may be the signal for commodities to start moving again. Because most commodities are priced in dollar, commodities prices tend to be inversely correlated to the dollar.
Today we had a fresh three-year high in the benchmark commodities index (the CRB Index).

Here’s an excerpt from one of my Forbes Billionaire’s Portfolio notes back in June, on the building momentum for commodities: “The technology sector minted billionaires over the past decade. It’s in commodities that I think we’ll see the new billionaires minted over the next decade. The only two times commodities have been this cheap relative to stocks was at the depths of the Great Depression in the early 30s and at the end of the Bretton Woods currency system in the early 70s. Commodities went on a tear both times.”
We’ll take a closer look at this tomorrow.
January 25, 7:00 pm EST
Yesterday we talked about the commodities bull market and the move underway in natural gas.
That all continued today, thanks in part to a comment by the U.S. Treasury Secretary, saying “obviously a weaker dollar is good for us.” When the dollar goes down, commodities prices tend to go up, since they are largely priced in dollars. As such, commodities were the top performers of the day – beginning to gain more momentum at multi-year highs.
But as we’ve seen from this chart, this recovery in commodities, which has dramatically lagged in the reflation trade, has a long way to go.

While the markets reacted as if Mnuchin, the Treasury Secretary, was talking down the dollar, the dollar is already in a long-term bear market cycle.
Remember, we looked at this chart (below) of the long-term dollar cycles back in June…

And I said, “if we mark the top of the most recent cycle in early January, this bull cycle has matched the longest cycle in duration (at 8.8 years) and comes in just shy of the long-term average performance of the five complete cycles. The most recent bull cycle added 47%. The average change over a long-term cycle has been 56%. This all argues that the dollar bull cycle is over. And a weaker dollar is ahead. That should go over very well with the Trump administration.”
The dollar is down about 8% since then and is breaking down technically now.

The dollar index is now down 14% in this new bear cycle. And these are the early innings. Based on the dollar cycle, it has a long way to go, and should last for another 5 to 7 years.
So, this dollar outlook is further support for the case for a big run in commodities we’ve been discussing. And as we observed yesterday, in the case of Chesapeake Energy (CHK), the second largest producer of natural gas in the country, the commodities stocks are still extremely underpriced if this scenario for commodities plays out.
For help building a high potential portfolio, follow me in our Billionaire’s Portfolio subscription service, where you look over my shoulder as I follow the world’s best investors into their best stocks. Our portfolio of highest conviction, billionaire-owned stocks is up close to 50% over the past two years. You can join me here and get positioned for a big 2018.
January 9, 4:00 pm EST
Interest rates are on the move today. So is oil. And the latter has a lot to do with the former.
For much of the past quarter we’ve talked about how disconnected the interest rate market has been from the stock market and the economy.
With stocks putting up 20% last year, the economy growing at close to 3% and unemployment at 4%, and with FIVE Fed rate hikes now in this tightening cycle, the yield on the 10-year Treasury has defied logic.
But as we’ve discussed, we should expect that logic to be a little warped when we’re coming out of an unprecedented global economic crisis that was combatted by an unprecedented and globally coordinated monetary policy. And that continues to create dislocations in financial markets. Specifically, when global central banks continue to print money, and indiscriminately buy U.S. Treasurys with that freshly printed money (i.e. the dollars the trade for it), they will keep market rates pinned down. And they have done just that. Of course, that helps fuel the U.S. and global recovery, as it keeps borrowing and service rates cheap for things like mortgages, consumer loans, corporate debt and sovereign debt.
But last month, we talked about where the real anchor now exists for global interest rates. It’s in Japan. As long as Japan is pegging the yield on the 10-year Japanese government bond at zero, they will have license to print unlimited yen, and buy unlimited global government bonds, and anchor rates.
What would move Japan off of that policy? That’s the question. When they do abandon that policy (pegging JGB yields at zero), it will signal the end of QE in Japan and the end of global QE. Rates will go on a tear.
With that the architect of the stimulus program in Japan, Shinzo Abe, said today that he would keep the pedal to the metal, but indicated a possibility that they could achieve their goal of beating deflation this year.
That sent global rates moving. The benchmark 10-year yield jumped to 2.54% today, the highest since March of last year.
Another big influence on rates is, and will be, the price of oil. As we’ve discussed, the price of oil has played a huge role in the Fed’s view toward inflation. And that influence (of oil prices) on the inflation view is shared at other major central banks.
On that note, oil broke above $63 today, the highest levels since 2014.
Remember we looked at this chart for oil back in November, which projected a move toward $80.

