Predictably, Trump extended the timeline on new tariffs in his meeting with China’s President Xi over the weekend.
This is kicking the trade war can down the road. That extends the timeline on the trade war and resets the opportunity to force the Fed’s hand this coming month–to get a rate cut at the July 30-31 Fed meeting.
As we’ve discussed, with a rate cut under his belt, this would clear the way for Trump to, then, claim victory on the China trade war by doing ‘a’ deal, giving himself enough runway into the 2020 elections to have a booming stock market and booming economy.
Since December, we’ve been talking about the parallels between the current period and the 1994-1995 period. It’s worth repeating again. The script continues to play out. In 1994, an overly aggressive Fed raised rates into a recovering, low inflation economy. By 1995, they were cutting. That led to a 36% rise in stocks in 1995. And it led to 4% growth in the economy through late 2000–18 consecutive quarters of more than 4% growth. Stocks tripled over the five-year period.
Think about that, and then remove the overhang of a trade war with the two biggest economies of the world and you can see the path to some very good times ahead. Moreover, if the above scenario plays out, Trump would then likely turn back to Congress and green-light a $2 trillion infrastructure plan.
While many have been predicting economic bust, this is a formula for an economic boom!
We end the week, month and quarter today. Stocks are up 17% year-to-date.
With the big Trump/Xi meeting coming over the weekend, let’s talk about how Fed policy has flipped from a headwind (adding to the risks), to a tailwind (backstopping against the risks – an implicit “put”).
And that’s why the chart on the S&P 500 looks like this …
Of course we’ve had big geopolitical risks along the timeline of this chart, that include an historic trade war (which continues) and potential sanctions against Saudi Arabia (late last year).
The geopolitics have consumed the markets attention. But maybe it’s all about the Fed, and their ability to interpret (or lack thereof) the impact of trade disputes and structural reform in the global economy – and position correctly.
If we look back at the timeline, the tops and bottoms in these V-shaped moves in the chart above all align perfectly with Fed speak.
Stocks topped on October 3rd and proceeded to drop 20% through the end of December. What happened on October 3rd? The Fed chair, Jay Powell, did a sit down interview with PBS, where he said, after raising rates three times for the year, that they remain far away from the ‘neutral’ rate. And he said they may go past neutral. Why? He thought tariffs and the uptick in wage growth would feed into inflation. He was wrong.
With that view of tighter and tighter monetary policy into a low inflation and recovering economy, with hurdles of trade reform in the path, the markets started signaling the contra-viewpoint: the trade war weighs on global growth, and within that context, rising U.S. rates are a killer for emerging market economies, and for the slow recovering developed markets.
Powell’s comments started the decline, which ultimately led to a big decline. Yet, the tone-deaf Fed raised rates in December, again, right into a falling stock market. Moreover, following the December Fed meeting, the Fed made it clear that they were prepared to mechanically keep raise rates — another four times in 2019.
When did it turn? It turned the day (January 4th) the Fed marched out Powell, Bernanke and Yellen, (tails between their legs) to tell the world ‘no more rate hikes/ the Fed is done.’
Stocks bottomed, on that day, and did a perfect ‘V’ back to the record highs over the following months.
When did it top again? May 1. What happened on May 1? The Fed met and Jay Powell had his post-meeting press conference. After months of running Fed officials out in the media to tell us the Fed’s got your back, Powell fumbled.
The interest rate market (10-year yields) had fallen 75 basis points from the highs of just six months prior, giving a very clear message to the Fed that, at the very least, the December hike was a policy mistake. But Powell was unwilling to show any leaning toward a rate cut. In fact, he said the risks that precipitated their “pause” on the rate path (China and European growth, Brexit risks, and trade negotiations), have been largely improving. Again, the Fed was tone-deaf and unwilling to take a defensive stance against the unknowns of geopolitical risks. Stocks go down.
A few days later, U.S./China trade talks come to a standstill. Stocks continue on for a 7% decline.
When did stocks bottom? June 3rd. What happened? A voting Fed member, Jim Bullard said that a Fed cut may be “warranted soon” to “provide some insurance” in case of a sharper slowdown. That was a primer for a June 4th speech by Jay Powell. Powell came out of the gates, in a prepared speech that morning, telling us they “will act as appropriate to sustain the expansion.” That spurred the second “V-shaped recovery” on the above chart.
The conversation at the Fed has now, finally, turned to rate cuts. And the market is now expecting a 100% chance the Fed will cut at the July 31 meeting.
Perhaps now the Fed is in the right position, trade deal or no trade deal. And that should be very good for stocks.
Remember, the last time the Fed was in this position in 1994, they cut rates and that led to a huge year for stocks — and stocks and the economy boomed through the end of the nineties.
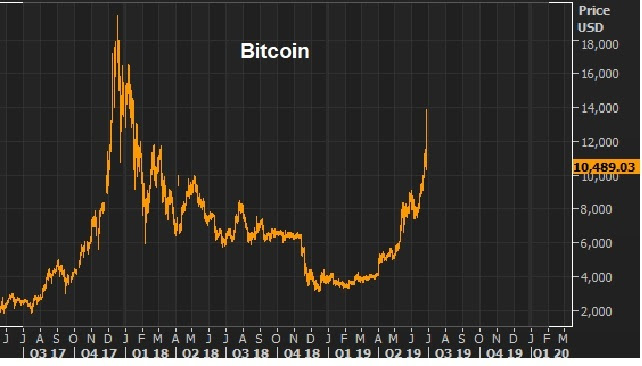
Bitcoin has had another huge move over the past three months — more than tripling. And then late yesterday afternoon, it collapsed 15% in just minutes. It lost 25% in value on the day.
The first rise and fall in Bitcoin, from $1,000 to $19,000 and back to $3,000, took place from early 2017 to early 2018. Most of the move was over just four months.
Here’s a look at the chart. You can see the first run-up and this most recent run-up …
Remember, this first run-up had everything money moving out of China, and less to do with Silicon Valley genius/ global monetary system disruption.
In late 2016, with rapid expansion of credit in China, growing non-performing loans, a soft economy and the prospects of a Trump administration that could put pressure on China trade, capital was moving aggressively out of China. That’s when the government stepped UP capital controls — better policing movement of capital out of China, from transfers to foreign investment (individuals can move just $50,000 out of the country a year).
Of course, resourceful Chinese still found ways to move money. Among them, buying Bitcoin. And that’s when Bitcoin started to really move (from sub-$1,000). China cryptocurrency exchanges were said to account for 90% of global bitcoin trading. Capital flows were confused with Silicon Valley genius.
But in September of last year China crackdown on Bitcoin – with a total ban. A few months later, Bitcoin futures launched, which gave hedge funds a liquid way to short the madness. Bitcoin topped the day the futures contract launched. And a few months later it was worth 1/6th of its value at the top.
Is this time different? Is this real traction for Bitcoin, or is this just Chinese capital flows looking for a parking place, again? Likely, the latter. It’s probably no coincidence that as the prospects of a ‘no deal’ with China have elevated in recent months, Bitcoin has again been on the move. As we’ve discussed, if Trump holds firm on his demands, it seems impossible that China can do his deal. It’s political suicide for the Chinese Communist Party. With that, they fight tariffs with a devaluation of the yuan.
With those prospects, if you have money in China, you have been getting it out! While cryptocurrency exchanges have been banned in China, owning and buying Bitcoin in China is not banned. The Bitcoin futures market and off-exchange (peer-to-peer) trading are liquidity sources for Chinese citizens to respond to potential devaluation in the yuan.
With the above in mind, this round of Bitcoin bubble may not deflate until/unless Trump makes concessions to do a deal (which seems unlikely until, at least, we get past the July Fed meeting).
If you haven’t signed up for my Billionaire’s Portfolio, don’t delay … we’ve just had another big exit in our portfolio, and we’ve replaced it with the favorite stock of the most revered investor in corporate America — it’s a stock with double potential.
Join now and get your risk free access by signing up here.
This morning Mnuchin was interviewed by CNBC. He was the headline of the day, despite saying nothing new.
When trade talks broke down in early May, the Trump administration said they were 90% of the way to a deal. But China balked and reneged on concessions. Mnuchin said the same thing today (we were 90% there), and the media presented it as if he said progress was made this week, heading into the meetings. That’s not what he said.
Let’s talk about the backdrop heading into the weekend negotiations. Remember, Trump is in the driver’s seat in this negotiation. He can’t force a good deal, but he can claim victory on the trade front just by doing ‘a’deal.
With that in mind, as we’ve discussed over the past month, he seems to be attempting to surgically optimize the economy heading into next year’s election. He’s been fighting for a Fed rate cut, and through introducing heightened risks of a standstill on trade, he’s gotten what looks like Fed compliance coming down the pike (for a July cut).
The timeline set up perfectly for a June rate cut, and then for Trump to settle on a China deal at the G20 meeting. The economy would have launched like a rocket-ship. The Fed didn’t comply.
With that, at this weekends Trump/Xi meeting, let’s see if Trump extends the timeline on new tariffs, to get through the July Fed meeting (in hopes of getting his Fed fuel for the economy). At this point, the market has backed the Fed into the corner, with high expectations of not just 25 bps, but a 50 bps cut. Without an extension of trade uncertainty, those expectations will sustain if not grow.
Now, we’ve discussed over the past month, the prospects for this trade war with China ending with a grand and coordinated currency agreement — perhaps a big depreciation of the dollar, similar to the 80s “Plaza Accord.”
As I said a couple of weeks ago, we may wake up one day and find a similar agreement has been made between the U.S. and major global trading partners (which may include China, or not). It might be a deal between the U.S. and China to “revalue” the yuan (i.e. strengthen it). Or it may exclude China (just G3 economies). An interesting takeaway from this morning’s interview with Mnuchin: Mnuchin did make a point to emphasize that they look forward to many bi-lateral meetings at the G-20 — not just with China.
How do you position for a dollar devaluation? Buy commodities. Is that what the move in gold is telling us (and Bitcoin)? Maybe.
If you haven’t signed up for my Billionaire’s Portfolio, don’t delay … we’ve just had another big exit in our portfolio, and we’ve replaced it with the favorite stock of the most revered investor in corporate America — it’s a stock with double potential.
Join now and get your risk free access by signing up here.
Remember, last year was the first year since 1994 that cash was the best producing asset class (among stocks, real estate, bonds, gold).
This year, as it did in 1995, the pendulum has swung.
Stocks are up 16% year-to-date. The Dow Jones Real Estate Index is up 19%. Gold is up 11%.
As you can see below, there is a lot of green on the year for global asset prices …
As we’ve discussed for much of the year, what else is similar between the current and 1994-1995 period? We had an overly aggressive Fed, that tightened into a low inflation, recovering economy. In 1995, they did an about face, cutting rates at their July meeting. And now we head into the July Fed meeting with expectations of a 50bps cut.
On that note, we heard from the Fed just days ago, signaling that they were ready to act if conditions deteriorated. And as I said following the meeting: “What is clear, from Powell’s press conference, is that this is all about the China trade deal. If it drags out, sentiment continues to erode. When sentiment erodes, the economic momentum will erode. If that’s the case, they will be reactive, with stimulus (rate cuts and/or slowing the runoff of Treasuries on the Fed balance sheet).”
Today, Jerome Powell was again on a stage talking about monetary policy, at a conference on the Economic Outlook and Monetary Policy at the Council on Foreign Relations. He had a prepared speech and did a Q&A. So what message was he trying to send to markets?
He did a lot of talking. But I suspect his posturing doesn’t matter at this point. This less about him, or the economy, and more about Trump. If Trump were to back off the hardline demands and signal a deal with China over the weekend, the Fed would be off the hook — no rate cut. If the meeting comes and goes, and it’s a clear kick the can down the road, or no deal –we get a cut by the Fed come July (whatever size and scope is necessary).
Let’s take a look at gold as we head into the Trump/Xi meeting scheduled to take place at the end of the week’s G20 meeting.
Gold has been sold all along as an “inflation hedge.” But unless you have Weimar Republic-like hyperinflation, you’re unlikely to get the inflation-hedge value out owning it.
Remember, gold went on a tear from sub-$700 to above $1,900 following the onset of global QE (led by the Fed). Gold ran up as high as 182%. That was pricing in 41% annualized inflation at one point (as a dollar for dollar hedge). Of course, inflation didn’t comply. Still, ten years after the Fed’s first round of QE and massive global responses, we’ve been able to muster just a little better than 1% annualized inflation.
If you bought gold at the top in 2011, the value of your “investment” was cut in half just four years later. That’s a lot of risk to take for the prospect of “hedging” against the loss of purchasing power in the paper money in your wallet.
So, gold isn’t a hedge against inflation, it’s a hedge against the worst-case scenario. It’s for sovereign wealth and anyone else that can take delivery, own and control the storage. For almost everyone else, it’s a speculative trade.
Join now and get your risk free access by signing up here.
As we end the week, any questions on whether or not the central banks have your back, have been answered.
Just as they have for the better part of a decade, they have no choice but to respond to any shocks that might knock the global economic recovery off path. And as I said yesterday, the major central banks of the world have lined up, because they are unable to predict what Trump will do on trade. To maintain market confidence, they have to posture as if they assume the trade war will go on indefinitely.
On that note, it seems to be priced into the global treasury markets and the gold market that China can’t accept Trump’s deal (or at least can’t deliver on the current demands of the deal). It’s politically unpalatable and an existential threat to the Chinese Communist Party. So, the question is, will Trump end the trade dispute with more bark than bite? Will he do a deal (not the deal) and remove the overhang of uncertainty from the global economy, and an election coming next year. Next week should be interesting, as we await the Trump/Xi meeting at the G20 (scheduled for Friday 6/28 and Saturday 6/29).
As we head into this weekend, markets hang around big levels: record highs in stocks, the big 1,400 level in gold, just above 2% on the 10-year, and closing in on 10k in Bitcoin (a haven for Chinese capital flight).
We’ve talked about the set up for positive surprises in the data. We’ve looked at the first two components of GDP (consumption and investment) both of which are set up for positive surprises. Today let’s look at government spending.
It’s typical for debt to balloon in economic downturns. Not only did our debt/gdp ratio balloon in the U.S. but it ballooned everywhere. With that, as the global economy was being propped up by central banks, for the better part of the past decade, the politicians were reluctant to help on the fiscal side. Instead, they went the other way. They went the path of austerity. They focused on debt when the economy desperately needed growth.
Fiscal tightening in a widespread global recession is a recipe for tipping it all into depression. That required the central banks to do more, and more, and more to keep the economy from entering into a deflation spiral — fighting the drag of fiscal belt tightening. And it all began tipping over the edge in mid-2016.
But that changed with Trump election. Trumponomics has been all about restoring growth and breaking from the rut of economic stagnation. And a key pillar in that plan has been infrastructure and government spending.
On that note, he’s been pushing for a trillion dollar infracture spend over 10 years. And as we’ve discussed, while adding debt isn’t popular for the politicians to approve, natural disasters last year gave them an excuse to approve spending packages. Fast foward just six months and we’ve had more than $200 billion in aid approved from Congress. And now we’ve had an increase of $400 billion in government spending as part of the lastest government budget.
So the government spending piece has been in motion. And expect the rest of the world to follow. As we’ve discussed in recent weeks, we’ve seen the populist push back across the world, from Grexit, to Brexit, to the Trump vote, and now to the “Italy first” movement. The real fight in the “populist movement” is against economic stagnation. And much of that is due to mistakes on policy in response to the global economic crisis. And the core mistake has been austerity. Growthsolves a lot of problems.
What about the debt?
The media loves to talk about the $20 trillion dollar debt load, as if we are going to default and/or the rest of the world is going to dump our Treasuries and send interest rates skyrocketing and implode our economy.
Government debt and deficits are judged (by global trade partners, allies, global allocators of capital) on a relative basis – size relative to GDP. Again, our debt relative to GDP has ballooned since the global financial crisis. But it also has for everyone else in the world. That’s why people/countries are still plowing money into our Treasury market for virtually no return, because lending the U.S. money is still the safest place and way to preserve wealth.
The only alternative in this post global financial crisis environment is to focus on growth. Growth can solve a lot of problems, including the debt and deficit relative to GDP problems. As growth goes up, our debt relative to size of the economy goes down.
If we get the economy back on a sustainable growth path, then, in good times, we can work on the structural flaws that led us to the crisis. That’s the only option.
So, when we look at the components of GDP, the policy execution in Washington has been driving lift-off in all of the components. And yet the experts have still underetimated the potential for a growth boom. We’ve talked about the positive surprises that are coming down the pike in consumption, investment and govenment spending. Tomorrow, we’ll take a look at the trade piece.
Yields continue to grind higher toward 3%. That has put some pressure on stocks, despite what continues to be a phenomenal earnings season. This creates another dip to buy.
Yesterday, we talked about a reason that people feel less good about stocks, with yields heading toward 3%. [Concern #1] It conjures up memories of the “taper tantrum” of 2013-2014. Yields soared, and stocks had a series of slides.
My rebuttal: The domestic and global economies are fundamentally stronger and much more stable. But maybe most importantly, the economy (still) isn’t left to stand on its own two feet, to survive (or die) in a normalizing interest rate environment. We have fiscal stimulus doing a lot of heavy lifting.
Let’s look at a couple of other reasons people are concerned about stocks as yields climb:
[Concern #2] Maybe this is the beginning of a sharp run higher in market interest rates — like 3% quickly becomes 4%?
My Rebuttal: Very unlikely given the global inflation picture, but more unlikely with the Bank of Japan still buying up global assets in unlimited amounts (Treasuries among them, through a variety of instruments). They can/and are controlling the pace, for the benefit of stimulating their own economy and for the benefit of stimulating and maintaining stability in, the global economy.
[Concern #3] I hear the chatter about how a 3% 10-year note suddenly creates a high appetite for Treasuries over stocks at this point, especially from a risk-reward perspective (i.e. people are selling stocks in favor of capturing that scrumptious 3% yield).
My Rebuttal: In this post-crisis environment, a rise toward 3% promotes the exact opposite behavior. If you are willing to lend for 10-years locked in at a paltry rate, you are forgoing what is almost certainly going to be a higher rate decade than the past decade. If you need to exit, you’re going to find the price of your bonds (very likely) dramatically lower down the road. Coming out of a zero-interest rate world, bond prices are going lower/not higher.
Remember this chart …
The bond market has become a high risk-low reward investment. Meanwhile, with earnings set to grow more than 20% this year, and stock prices already down 7% from the highs of the year, we have a P/E on stocks that continues to slide lower and lower, making stocks cheaper and cheaper. That makes stocks a far superior risk/reward investment, relative to bonds – especially with the prospects of the first big bounce back in economic growth we’ve seen since the Great Recession.
As we head into the Thanksgiving day weekend, let’s talk about oil and Saudi Arabia.
On Thanksgiving night three years ago oil was trading around $73, when the Saudis blocked a vote on an OPEC production cut. Oil dropped 10% that night, and that set off a massive oil price bust that ultimately bottomed out early last year at $26.
The goal of the Saudis was to put the emerging, competitive U.S. shale industry out of business–to force oil prices lower so that these shale companies couldn’t product profitably. The plan: They go away, and Saudi Arabia retains its power on global oil. It nearly worked. Shale companies started dropping like flies, with more than 100 bankruptcies between 2015 and 2016.
But cheap oil had broader implications for the global economy, following the Great Recession. It exposed the global banks that had lent the shale industry hundreds of billions of dollars.
Additionally, collapsing oil prices directly weighed on inflation measures and the inflation expectations. That was bad news for the central banks that had committed trillions of dollars to avert a deflationary spiral and promote a normalization of inflation. High inflation is bad. Deflation is worse. Once a deflationary mindset takes hold, it feeds into more deflation. Central banks can raise rates to kill inflation. They have few tools to fight deflation (especially after the financial crisis).
So cheap oil became bad news for the fragile global economic recovery. With that, central banks stepped in early last year and responded with coordinated easing (which included direct asset purchases, which likely included outright oil and oil-related ETFs). Oil bottomed the day the Bank of Japan intervened in the currency market, and prices jumped 50% in a month as other major central banks followed with intervention.
Now, the other piece of this story: cheap oil damaged the shale industry and the global economy, but it also damaged the same folks that set the collapse into motion–Saudi Arabia and other oil producing countries. These countries, which are heavily reliant on oil revenues, have seen their budget deficits balloon. So, with all of the above in mind, in November of last year, the oil producing countries (led by Saudi Arabia) reversed course on their plan, by promising the first production cuts since 2008.
Oil prices have now recovered to the mid-$50s. And since OPEC announced production cuts last year at this time, U.S. petroleum supply has drawn down 5%. Meanwhile, global demand is running far hotter than forecasts of last year. Yet, OPEC is extending their production cuts into this market and may get even bolder next week at their November meeting. Why? Because now it suits them. Remember, Saudi Arabia’s next king has been cleaning house over the past two weeks, in the process of seizing hundreds of billions of dollars from his political foes. Higher oil prices help his efforts to reshape the Saudi economy.
As liquidity dries up into the end of year and holidays, we may see oil find its way back up toward those November 2014 levels (low $70s)–where the whole price-bust debacle started.
Join our Billionaire’s Portfolio today to get your portfolio in line with the most influential investors in the world, and hear more of my actionable political, economic and market analysis. Click hereto learn more.


 As we head into the Thanksgiving day weekend, let’s talk about oil and Saudi Arabia.